A fleet that tracks total fuel spend but not who that spend belongs to is managing a single number nobody can act on. When fuel sits in one pooled account, a department running its vehicles efficiently pays the same rate as one running them wastefully, and neither manager has a reason to change anything. Allocating fuel cost down to the vehicle, the department, and where relevant the driver turns that one flat number into dozens of numbers with an owner attached — and owners are what make a cost controllable instead of just visible. Most fleets that build this out start with a "showback" phase, letting departments see their true fuel number before any budget is actually charged against it, which cuts disputes sharply once real chargeback begins. Book a demo to see how OxMaint attaches every gallon to the vehicle, department, and driver that used it.
Fleet Fuel Management · Cost Allocation
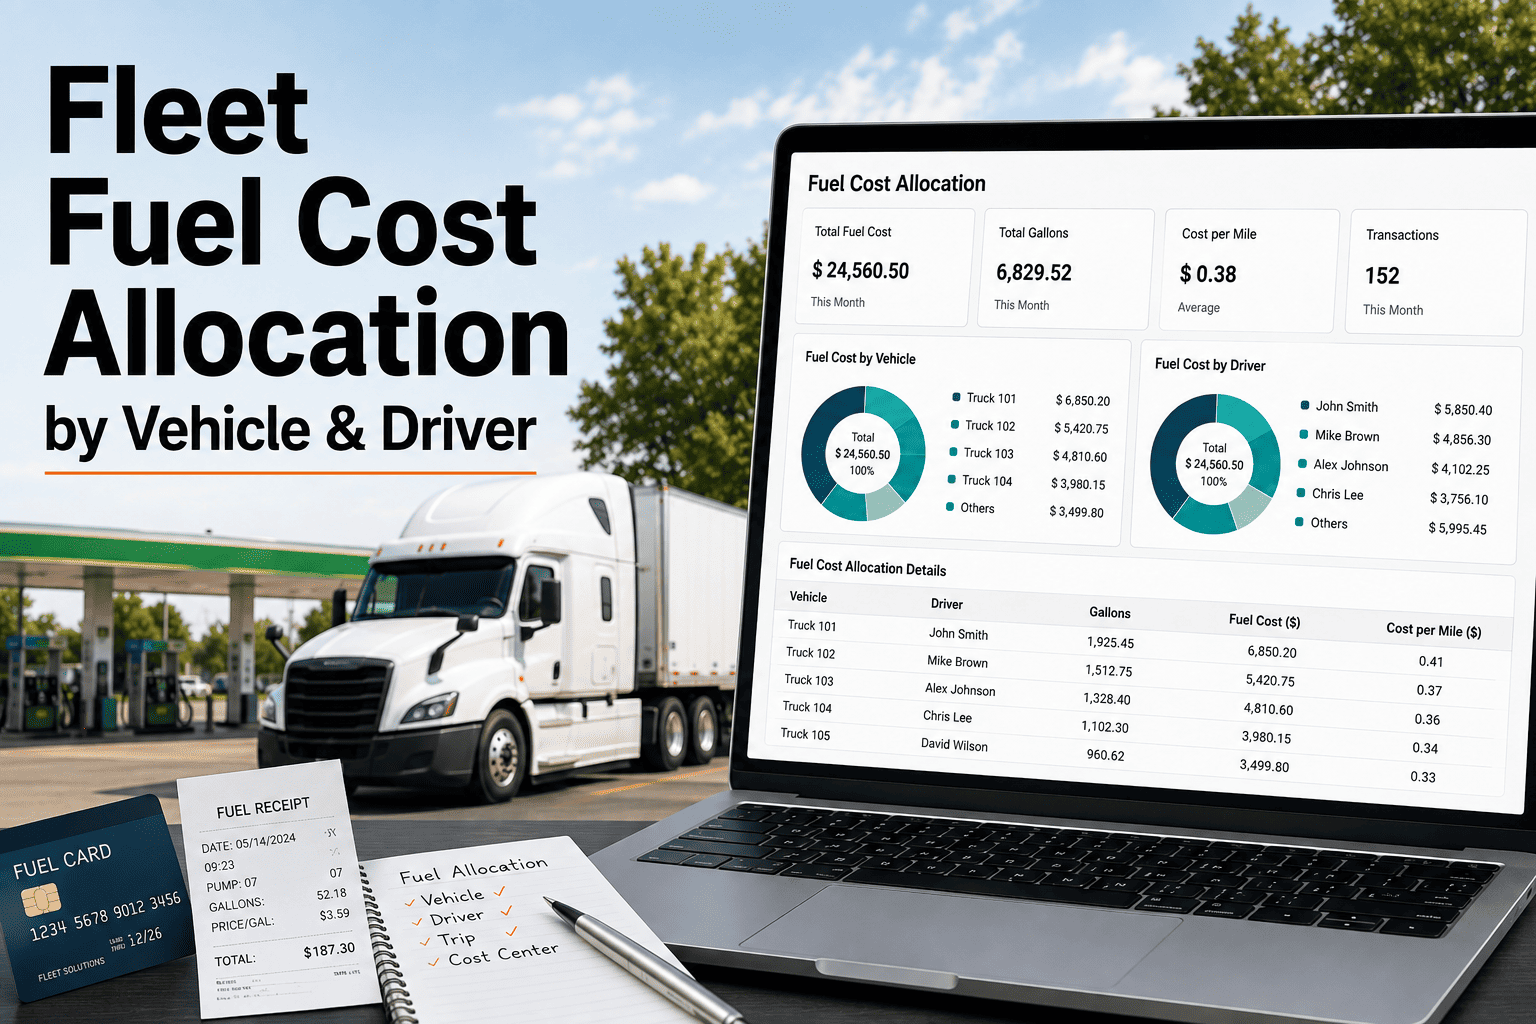
Fleet Fuel Cost Allocation by Vehicle & Driver
A pooled fuel budget has no owner. Allocate it down to the vehicle, department, and driver, and waste finally has somewhere to be found.
One Fuel Bill, Three Views
By vehicle — cost per mile, cost per hour of use
By department — budget line each manager can actually see
By driver — behavior pattern tied to a name, not a card number
Vehicle vs. Department vs. Driver: What Each Level Answers
Before setting up allocation, it helps to know exactly what question each level is built to answer — because the three levels aren't interchangeable, and building only one tends to leave an obvious blind spot.
Vehicle-level allocation
AnswersIs this specific asset getting more expensive to run over time?
Good forReplacement timing, right-sizing decisions, spotting a developing mechanical issue
Blind spotDoesn't separate a bad vehicle from a heavy-handed driver operating it
Department-level allocation
AnswersWhich budget should absorb this cost, and is it trending the right direction?
Good forBudget accountability, year-over-year forecasting, cross-department comparison
Blind spotAverages out individual vehicles and drivers, hiding outliers inside the total
Driver-level allocation
AnswersIs the cost coming from the equipment or from how it's being driven?
Good forCoaching conversations, shared or pool vehicle accountability, policy enforcement
Blind spotRequires reliable driver-to-transaction assignment, which shared cards make harder
Why a Pooled Fuel Budget Hides Waste
Most fleets already know their total annual fuel spend to the dollar. Far fewer know which ten vehicles account for a disproportionate share of it, or whether one department's fuel-per-mile is running well above the fleet average. That gap exists because fuel is usually coded to a single general-ledger account rather than split across the assets and people actually generating the cost. Without that split, a manager reviewing the monthly fuel total has no way to ask a useful question — there's nothing in the number to investigate. The moment the same total is broken into a per-vehicle and per-department view, patterns that were invisible in the aggregate become obvious: a specific truck running 20 percent above its class average, a department whose fuel cost per mile has crept up for three straight quarters, a card being used more often than its assigned vehicle's mileage log can explain.
A single number can't be questioned
One fuel total for the whole fleet gives finance nothing to drill into — no vehicle, department, or driver breakdown means no starting point for a conversation about why it moved, so the number just gets accepted and re-budgeted at the same level next year.
No manager owns the outcome
When fuel isn't charged to a department's budget, the department has no financial reason to manage it — the cost belongs to "fleet," which in practice usually means it belongs to no one in particular and gets reviewed by no one in particular either.
Efficient and wasteful units look identical
Two departments running similar vehicle counts can have very different fuel efficiency, but a pooled budget reports them as one combined figure, hiding which one actually needs attention and letting the inefficient one coast on the efficient one's numbers.
Budget requests lack evidence
A department asking for a larger fuel budget next year, or fleet asking finance for more vehicles, has no per-unit cost data to justify the request with — only a total that grew for unclear reasons and a request finance has little basis to approve.
Three Ways to Allocate Fuel Cost
Fuel cost allocation isn't one method — most mature fleet programs run all three views at once, layered on top of the same underlying transaction data, because each one answers a different question.
By Vehicle
Which assets cost the most to run?
Every fuel transaction is tied to the vehicle's card or telematics ID, giving a true cost-per-mile or cost-per-hour figure per asset. This is the view that drives replacement and right-sizing decisions — a vehicle whose fuel cost per mile is drifting upward against its class average is often signaling a maintenance issue before it shows up as a breakdown.
By Department
Which budget should carry the cost?
Vehicle-level costs roll up to the department or cost center that owns the vehicle, turning fuel into a real budget line a department manager reviews the same way they review any other operating expense. This is the layer that actually changes behavior, because a department manager watching their own number has a reason to ask why it moved.
By Driver
Whose behavior is driving the cost?
Fuel is tied to the driver assigned to the card or vehicle at the time of purchase, separating a genuinely inefficient vehicle from a driving style — hard acceleration, excessive idling, out-of-route detours — that's costing extra fuel regardless of which vehicle that driver is in that week.
Fleet Fuel Program · OxMaint
Fuel Data Only Helps Once It's Attached To Someone
OxMaint ties every fuel transaction to the vehicle, department, and driver behind it automatically, rolling the same data up into three live views instead of one flat monthly total nobody can act on.
Showback Before Chargeback
Rolling out allocation as a live budget charge on day one is the fastest way to generate disputes — a department manager seeing an unfamiliar number deducted from their budget for the first time will contest the methodology before they trust the data. A showback phase, where departments can see their allocated fuel cost without money actually moving, gives everyone time to find and fix data errors before the number becomes real.
1
Publish showback reports, no charges yet
Each department sees its allocated fuel cost by vehicle for one or two full cycles, with a clear note that the figures are informational and not yet posted to any budget.
2
Let departments contest vehicle assignments
Vehicle records with stale department codes, mid-year reassignments not yet reflected in the system, and shared-pool vehicles miscoded to one department are the most common errors surfaced at this stage.
3
Correct the allocation rules, not just the totals
If a department consistently disputes its number, the fix is usually a wrong allocation driver or an outdated vehicle-to-department mapping — correcting the rule prevents the same dispute from recurring every cycle.
4
Switch showback to chargeback on a fixed date
Once two or three cycles run without material disputes, the same report starts posting as an actual budget charge, with the methodology already understood and accepted by every department it affects.
Choosing the Right Allocation Driver
An allocation driver is the variable used to split a shared or partially-shared fuel cost across vehicles, departments, or drivers when a transaction isn't already cleanly attributed. The right driver depends on what's actually causing the cost to vary — using the wrong one is the single most common reason a department disputes its allocated number, so it's worth getting right before the methodology goes live.
| Allocation driver |
Formula basis |
Best fit for |
Watch out for |
| Miles driven |
Fuel cost ÷ total miles, applied per vehicle or route |
On-road fleets with reliable odometer or telematics mileage data |
Underreports cost for vehicles that idle heavily without covering miles |
| Vehicle count |
Shared cost ÷ number of vehicles assigned to a department |
Simple starting point when usage data isn't yet reliable |
Treats a light-duty van the same as a heavy truck unless weighted by class |
| Operating hours |
Fuel cost ÷ hours of engine or equipment run time |
Off-road equipment, generators, and yard vehicles without mileage tracking |
Requires reliable hour-meter or telematics data to stay accurate |
| Gallons consumed |
Direct allocation from metered or card-level gallon data |
Fleets with per-vehicle fuel card assignment and clean transaction data |
Most accurate driver, but only as good as the underlying transaction match rate |
Most fleets end up blending two drivers rather than relying on one alone — vehicle count for the fixed portion of cost, miles or gallons for the variable portion. A department with three vehicles that barely leave the lot shouldn't carry the same fuel charge as a department with three vehicles running long routes daily, and a blended formula is usually what catches that difference where a single-driver formula would miss it.
A Department Fuel Line, Before and After Allocation
Consider a public works department running 18 vehicles across three functions — street maintenance, parks, and fleet support. Before allocation, the department's monthly fuel line is a single number that moves for reasons nobody can point to. After allocation, the same total splits into three trackable lines.
Before
The department's fuel line reads one combined total each month. When it rises 15 percent quarter over quarter, the manager can only guess whether it's fuel prices, more work, or a specific vehicle — there's no way to isolate the cause from the number alone.
After — by function
The same total splits into street maintenance, parks, and fleet support lines. The rise turns out to be concentrated almost entirely in street maintenance, narrowing the investigation from eighteen vehicles down to six.
After — by vehicle
Within street maintenance, one specific truck's cost per mile has climbed 30 percent over two quarters while its peers stayed flat — a pattern consistent with a developing mechanical issue rather than heavier route demand.
Resolution
A maintenance check on that truck finds a fuel system issue that was gradually reducing efficiency for weeks before anyone noticed — a problem the pooled department total would never have surfaced on its own.
Common Allocation Mistakes That Undermine Trust
A methodology that's technically correct still fails if departments don't trust the number it produces. Most trust problems trace back to one of the following, and catching them during the showback phase is far cheaper than fixing them after chargeback has already gone live.
Stale vehicle-to-department mapping — a vehicle transferred months ago is still coded to its old department, silently distorting both departments' numbers
Shared cards with no driver log — a pool vehicle's card used by whoever grabbed the keys makes driver-level allocation meaningless without a checkout record
One driver applied fleet-wide — a mileage-based formula built for on-road trucks misallocates cost badly when applied to off-road or yard equipment without hour-meter data
No reconciliation against actual fuel card totals — allocated figures that don't sum back to the real fuel bill undermine confidence in the entire report
Charging live before the showback period runs its course — skipping the trial phase means every early data error becomes a live budget dispute instead of a quiet correction
What Changes Once Fuel Has an Owner
The value of allocation isn't the report itself — it's what a department manager does differently once their own number is in front of them every month instead of buried in a fleet-wide total.
Department managers start asking questions
A manager watching their own fuel line notices a jump the same month it happens, rather than finding out at year-end that the department ran well over budget with no clear cause and no time left to correct it.
Vehicle replacement decisions get evidence
A per-vehicle cost-per-mile trend that's been climbing for two years is a far stronger replacement case to bring to finance than a general sense that "the truck seems to need more fuel lately" with nothing to back it up.
Driver coaching has something to point to
A driver whose fuel cost per mile sits meaningfully above peers running the same route and vehicle class is a concrete, defensible coaching conversation instead of a vague impression that's easy for the driver to dismiss.
Budget forecasting improves year over year
Per-department historical fuel data, broken out by vehicle class and mileage trend, produces a far more defensible next-year forecast than extrapolating a single fleet-wide total forward and hoping it holds.
Frequently Asked Questions
What is the difference between showback and chargeback?
Showback reports an allocated cost to a department without actually moving budget dollars, so the methodology can be reviewed and corrected first. Chargeback posts that same allocated figure as a real charge against the department's live budget.
Should every fleet allocate fuel cost down to the individual driver?
Not always — vehicle and department allocation deliver most of the accountability benefit on their own for many fleets. Driver-level allocation adds the most value where vehicles are shared, pooled, or already part of a coaching program.
Book a demo to see which level fits your fleet.
How do you allocate fuel cost for pooled or shared vehicles?
Shared vehicles are typically split using a reservation or trip-log driver — the department or individual who booked or checked out the vehicle for a given period absorbs the fuel cost for that period, rather than dividing the total evenly regardless of actual use.
What data does accurate fuel allocation actually require?
A current vehicle-to-department mapping, a fuel card or telematics feed matched to the correct vehicle, and a driver assignment log if allocating to the driver level. Gaps in any of the three are the most common source of disputed, distrusted numbers.
How does OxMaint connect fuel allocation to maintenance data?
OxMaint ties fuel transactions to the same vehicle record used for maintenance history, so a rising cost-per-mile trend can be checked against service history and correctly flagged as a maintenance issue rather than assumed to be driver behavior.
Start free to see the vehicle-level view.
Fleet Fuel Cost Allocation · OxMaint
Give Every Gallon an Owner.
OxMaint allocates fuel cost down to the vehicle, department, and driver automatically, rolls it into showback and chargeback reports departments actually trust, and ties the same data to maintenance history so a rising cost trend gets the right explanation the first time.