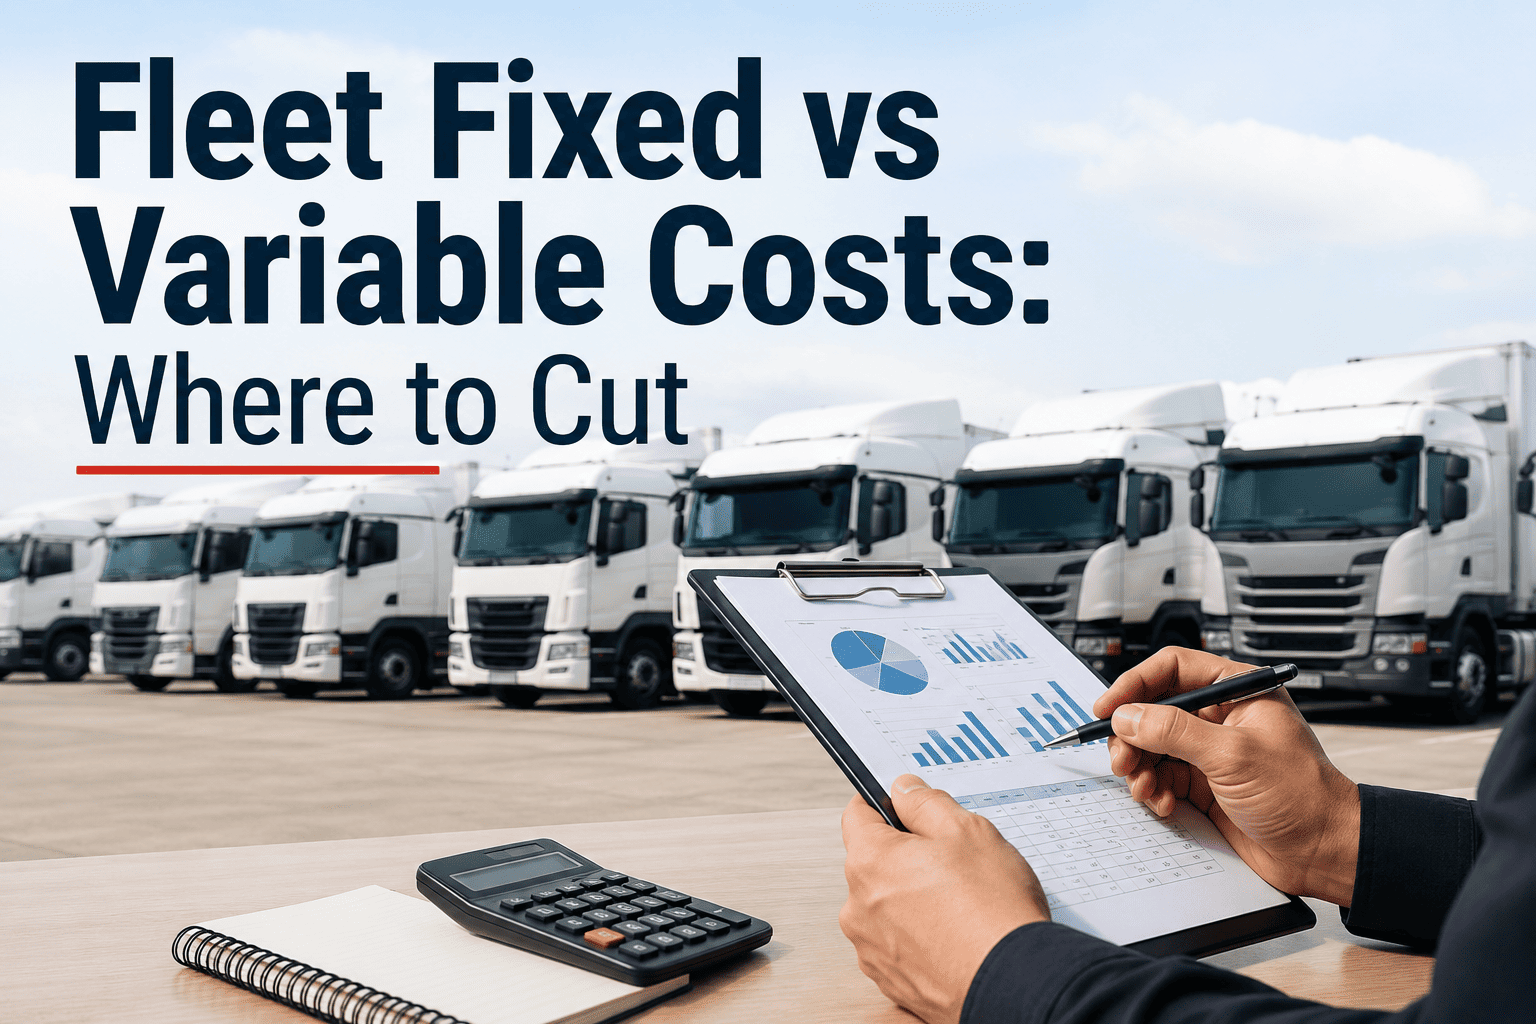
Fleet fixed vs variable costs is the distinction that decides whether your cost-cutting effort actually strengthens the balance sheet or quietly undermines operational capacity. In a typical fleet cost structure, fixed costs like lease payments, insurance, and licensing remain constant regardless of how many miles your assets drive, while variable costs like fuel, tires, and reactive maintenance fluctuate directly with vehicle utilization. A proper fleet cost analysis isolates these categories to reveal which expenses respond to management action and which are simply the cost of being in business. By applying a rigorous fleet cost breakdown analysis, maintenance and finance leaders can target the exact levers—like preventive maintenance compliance and parts inventory—that drive down the variable cost per mile. See how OxMaint turns this fixed/variable cost analysis into targeted action when you Start Free Trial today.
Cut the costs that actually move. Protect the ones that keep wheels rolling.
Slashing budgets blindly weakens fleet readiness without saving money. OxMaint separates fixed from variable fleet costs so you can target the exact expenses that respond to maintenance action.
- Blind 10% budget cuts
- Mixed fixed & variable GL codes
- Reactive maintenance spikes
- No per-asset cost visibility
- Targeted variable cost reduction
- Clean per-vehicle cost hierarchy
- Predictive maintenance scheduling
- Real-time ROI per asset
What are fleet fixed vs variable costs?
A comprehensive fleet expense analysis begins by sorting every dollar into two buckets: costs that exist whether the vehicle moves, and costs generated by the miles it drives. Misclassifying them is the number one reason fleet cost cutting analysis fails to deliver sustainable savings.
Fixed Fleet Costs
Expenses that remain constant regardless of vehicle utilization. They represent the baseline cost of fleet ownership and typically account for 30-40% of total fleet operating cost structure.
- Vehicle leases, loans & depreciation
- Insurance premiums
- Vehicle registration & licensing
- Property taxes on fleet assets
- Storage yard & facility rent
Variable Fleet Costs
Expenses that rise and fall with vehicle miles, hours, or engine hours. They represent 60-70% of total spend and are the primary target for fleet cost optimization analysis.
- Fuel & DEF consumption
- Preventive & reactive maintenance
- Tires & consumable parts
- Wiper blades, fluids & filters
- Tolls, parking & per-mile fees
How to calculate fleet cost per mile: fixed vs variable
To execute a defensible fleet cost reduction analysis, you must allocate expenses accurately using a standard per-mile formula. This normalizes costs across a mixed fleet of light-duty trucks and Class 8 tractors, giving you a true apples-to-apples comparison.
A 150-asset fleet spending $1.2M annually drives 4.2 million miles. Fixed costs (lease, insurance, licensing) total $420,000. Variable costs (fuel, tires, maintenance) total $780,000.
By shifting reactive repairs to predictive maintenance via OxMaint, the fleet cuts variable maintenance CPM by 18%, saving $140,400 annually — without touching fixed asset counts.
Where to cut fleet costs: the fixed vs variable decision matrix
Not all cost reductions are created equal. Cutting fixed costs often means shrinking the fleet, which limits revenue capacity. Cutting variable costs through maintenance optimization preserves revenue capacity while lowering the cost per mile.
| Cost Category | Reduction Lever | Impact on Fleet Capacity | Time to Realize Savings | Defenseibility |
|---|---|---|---|---|
| Fixed Leases & Financing | Right-size fleet, extend lifecycle | Reduces available assets | 6-18 months | Strategic |
| Fixed Insurance | Improve safety records, telematics | None | 3-6 months | Moderate |
| Variable Fuel | Route optimization, idle reduction | None | 1-3 months | High |
| Variable Maintenance & Parts | PM compliance, predictive analytics | Increases uptime & capacity | 1-2 months | Very High |
| Variable Tires | Pressure monitoring, rotation schedule | None | 2-4 months | High |
How OxMaint turns cost analysis into targeted action
A fleet cost breakdown analysis is only useful if it drives operational change. OxMaint bridges the gap between finance and maintenance, translating fixed and variable cost data into automated work orders, predictive alerts, and parts inventory controls that directly lower your variable cost per mile.
Automated Preventive Maintenance
Trigger PM work orders automatically based on engine hours, mileage, or calendar intervals. Ensures 100% PM compliance to eliminate catastrophic reactive repairs.
AI-Powered Predictive Alerts
Machine learning models analyze asset history and sensor data to predict component failures before they happen, shifting costs from reactive to planned maintenance.
Spare Parts Inventory Optimization
Track parts by asset, location, and cost code. Auto-reorder critical components and eliminate both stockouts and expensive obsolete inventory hoarding.
Per-Asset Cost Analytics
Dashboards map every maintenance dollar to specific vehicles and cost categories (fixed vs variable). Instantly identify bad actors draining your variable budget.
See exactly where your fleet maintenance dollars are going
Stop guessing at cost categories. Book a 30-minute demo and let us show you how OxMaint maps your fixed and variable fleet costs to actionable maintenance workflows.
The cost of inaction: what happens when you cut blindly
When leadership demands a 10% fleet budget cut without a fixed vs variable cost breakdown, maintenance teams often defer preventive work. This creates a false short-term saving that multiplies long-term variable costs by up to 4x.
Slashing the PM budget
Cutting preventive maintenance labor saves $15K upfront but leads to a $60K unplanned engine replacement when a $50 oil change is skipped. Variable costs explode.
Optimizing PM frequency
Use asset-specific usage data to adjust PM intervals. Move from time-based to condition-based maintenance, saving labor hours without increasing failure risk.
Stocking fewer parts
Reducing parts inventory to cut carrying costs causes technician downtime and expedited shipping fees. A $200 filter stockout can cost $2,000 in downtime.
Smart parts parity levels
Set dynamic reorder points based on historical PM consumption. Keep critical parts available while freeing up capital tied in obsolete inventory.
Fleet fixed vs variable costs: common questions
What is the difference between fixed and variable fleet costs?
Fixed fleet costs (leases, insurance, registration) remain constant regardless of how many miles a vehicle drives, while variable fleet costs (fuel, tires, maintenance) fluctuate directly with vehicle utilization. In a standard fleet operating cost structure, fixed costs account for roughly 30-40% of total spend, and variable costs make up the remaining 60-70%. Separating them in your fleet cost analysis is critical because only variable costs respond to maintenance and operational tactics.
How do you calculate fleet cost per mile?
To calculate fleet cost per mile, add your total fixed costs and total variable costs for a specific period, then divide by the total miles driven by the fleet in that same period. For example, if a fleet has $420,000 in fixed costs and $780,000 in variable costs over 4.2 million miles, the total cost per mile is $0.285. Using a CMMS like OxMaint automates this calculation by tracking maintenance labor and parts directly against asset mileage. You can Start Free Trial to see your real-time cost per mile instantly.
Which fleet costs should I cut first to save money?
You should cut variable maintenance costs first, specifically by improving preventive maintenance compliance and optimizing parts inventory. Unlike fixed costs—which require selling assets or restructuring leases to reduce—variable maintenance costs can be lowered by 15-20% simply by shifting from reactive repairs to predictive maintenance scheduling. This approach preserves fleet capacity while directly lowering your cost per mile.
How does a CMMS reduce variable fleet costs?
A CMMS reduces variable fleet costs by automating preventive maintenance work orders, tracking spare parts inventory to prevent stockouts, and providing per-asset cost analytics that identify high-maintenance vehicles. By catching component failures before they become catastrophic breakdowns, maintenance software typically cuts unplanned downtime by 30-50% and reduces overall variable maintenance spend by 15-20%, delivering a defensible ROI for fleet cost optimization.
What is included in a fleet cost breakdown analysis?
A fleet cost breakdown analysis includes categorizing all expenses into fixed and variable buckets, allocating those costs to individual assets, and calculating the cost per mile for each vehicle. It should also include a fleet cost reduction analysis that identifies which variable costs (like fuel or reactive maintenance) respond to operational changes. Book a demo at calendly.com/oxmaintapp/30min to see how OxMaint generates this breakdown automatically.
Transform your fleet cost structure with OxMaint
Stop reacting to breakdowns and start optimizing the variable costs that actually move the needle. See how AI-powered maintenance management protects your fleet budget.
Free 14-day trial · No credit card