Battery degradation is the defining variable in electric fleet economics — and it is largely preventable with the right monitoring approach. A fleet electric truck losing 2% battery capacity per year reaches 80% of original range — the operational threshold most fleet managers consider the effective end of service life — at year 10. The same truck operated without thermal management discipline, regular fast-charge cycling beyond 80% state-of-charge, and no state-of-health monitoring reaches that same 80% threshold at year 6. That four-year difference represents $80,000–$120,000 in accelerated replacement cost per vehicle across a 50-unit EV fleet. Battery health monitoring is not a technical feature for engineers — it is a fleet economics tool that belongs in the maintenance manager's daily workflow. The fleets winning on EV economics in 2026 are those that have moved battery SoH data out of the OEM telematics portal and into their CMMS work order system, where degradation alerts trigger preventive action rather than sitting in a dashboard nobody checks until something fails. Start a free trial for 30 days to see how Oxmaint integrates EV battery health data into preventive maintenance scheduling — or book a demo to walk through the EV battery monitoring workflow for your fleet.
EV Fleet · Battery Health Monitoring · 2026 Technology Guide
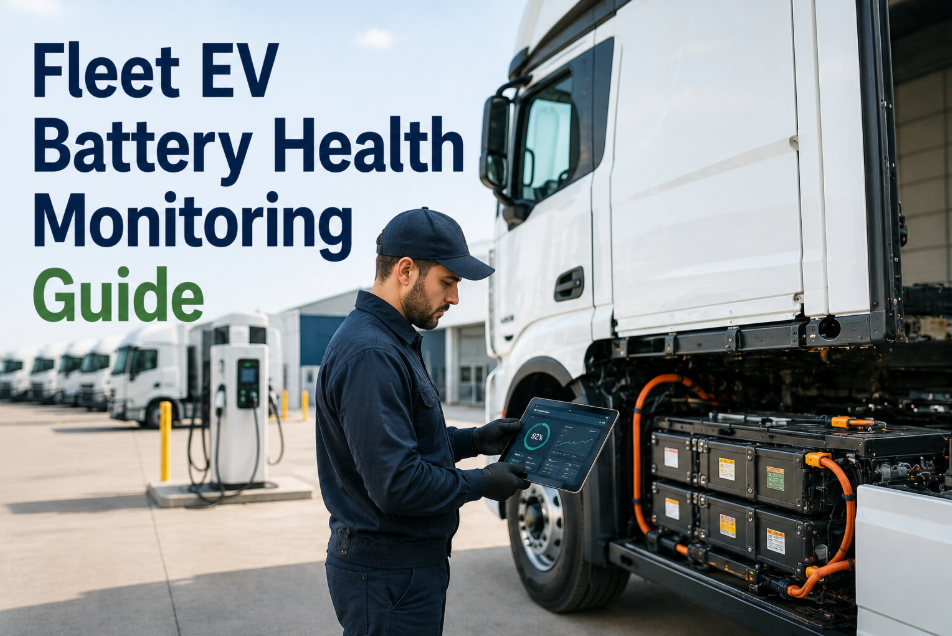
Fleet EV Battery Health Monitoring Guide 2026
State-of-health metrics, battery degradation prevention, thermal management, and CMMS alert integration — the complete operational guide for fleet managers protecting EV battery investment
Connect EV Battery Alerts Directly to Your Maintenance Work Orders
Oxmaint pulls battery SoH, charging cycle counts, thermal events, and degradation rate data from EV telematics APIs — converting raw battery telemetry into actionable preventive maintenance work orders before degradation becomes a range problem. Start a free trial or book a demo to see the battery health alert workflow.
4 yrs
Average battery life extension for EV fleets using active SoH monitoring vs unmonitored operation
2%
Healthy annual capacity degradation rate — fleets exceeding 4% annually need immediate charging protocol review
$95K
Average cost of premature battery pack replacement in Class 8 EV trucks — the consequence of ignoring degradation signals
31%
Lower EV maintenance costs year-over-year for fleets integrating battery health monitoring with CMMS
The 6 Battery Health Metrics Every Fleet Manager Must Track
OEM telematics portals display dozens of battery data points. Six of them determine whether your fleet's EV investment is on track or heading toward premature replacement. These are the metrics that belong in your CMMS dashboard, not buried in a manufacturer's app. Start a free trial to configure battery health alerts in Oxmaint, or book a demo to see the metric integration setup.
SoH
State of Health (%)
The ratio of current maximum battery capacity to original rated capacity, expressed as a percentage. A battery at 91% SoH delivers 91% of its original rated range.
92–100% SoH — Normal operation, no action required
80–91% SoH — Monitor monthly, review charging protocols
Below 80% SoH — Reassign to shorter routes, assess replacement timeline
SoC
State of Charge (%)
Current charge level as a percentage of current maximum capacity. The primary dispatch variable — but the critical insight is the delta between 100% SoC range and actual delivered range, which reveals SoH changes before they become operational problems.
Keep daily charge window: 20–80% for longevity
100% charge only when next-day range requires it
Avoid sustained operation below 10% — accelerates degradation
CDR
Capacity Degradation Rate (%/year)
Annual percentage of capacity lost, calculated from SoH trend data over 90+ days. The single most important battery management metric — it predicts replacement timeline and identifies vehicles with accelerated degradation that need charging protocol intervention.
0–2% annual — Industry benchmark for well-managed fleet EVs
2–4% annual — Investigate charging patterns and thermal events
4%+ annual — Immediate charging protocol review required
TMP
Battery Temperature Range (°C)
Operating temperature is the single largest variable in battery lifespan. Cells operating outside the 15–35°C optimal range experience accelerated degradation from either thermal stress or cold-induced lithium plating. Thermal events above 45°C require immediate review.
15–35°C — Optimal operating range, minimum degradation
35–45°C — Elevated thermal load, check cooling system
45°C+ — Immediate inspection, potential thermal management failure
CCC
Charging Cycle Count
Total number of full charge-discharge cycles completed since manufacture. Battery manufacturers specify capacity at defined cycle counts — comparing actual cycle count to SoH determines whether degradation is within expected parameters or accelerated by operational factors.
Track cycles vs SoH — compare to OEM degradation curve
Faster than expected degradation: review DC fast charge frequency
Excessive DC fast charging accelerates degradation 2–3x vs Level 2
IRG
Internal Resistance Growth
Rising internal resistance reduces charging efficiency and increases heat generation during charge cycles — a leading indicator of accelerated degradation. Resistance increases of more than 20% from baseline typically precede visible SoH decline by 3–6 months, allowing proactive intervention.
0–10% above baseline — Normal aging pattern
10–20% above baseline — Flag for review, check thermal events history
20%+ above baseline — Cell-level inspection, assess replacement
Battery Degradation: The 5 Causes Fleet Operations Control
HIGH HEAT
Thermal Overexposure During Operation
Sustained operation above 35°C — common in desert climates, enclosed loading docks, and vehicles with cooling system faults — accelerates electrolyte breakdown and electrode material degradation. Every 10°C above optimal operating temperature approximately doubles the chemical aging rate of lithium-ion cells.
Prevention: Daily max temperature logging per vehicle, cooling system PM on 6-month interval, alert at 40°C sustained threshold.
FAST CHARGE
Excessive DC Fast Charging Frequency
DC fast charging delivers high current that generates heat within cells during charge cycles. Fleets using DC fast charging for every daily charge cycle experience 2–3x faster capacity degradation versus overnight Level 2 charging. Reserve DC fast for en-route range emergency, not routine depot charging.
Prevention: Track DC fast charge percentage of total cycles per vehicle. Alert when DC fast exceeds 30% of weekly charge events.
DEEP DRAIN
Regular Low State-of-Charge Operation
Operating below 10% SoC stresses cell chemistry and generates excess heat at the anode. Vehicles routinely returned to depot below 15% SoC accelerate degradation at the cell level. Dispatching to maintain 20–25% minimum return SoC is a maintenance practice with measurable battery life impact.
Prevention: Alert dispatcher when a vehicle is projected to return below 15% SoC — trigger route adjustment before departure.
COLD SOAK
Cold-Weather Storage Without Pre-Conditioning
Vehicles stored overnight in temperatures below 0°C and then immediately fast-charged experience lithium plating — metallic lithium deposition on the anode that permanently reduces capacity and creates safety risk. Pre-conditioning the battery to 15°C before fast charging in cold conditions is non-optional in northern climates.
Prevention: Automate pre-conditioning activation for vehicles stored below 5°C — triggered by depot temperature sensor or weather forecast integration.
Reactive Battery Management vs CMMS-Integrated Monitoring
How Oxmaint Integrates EV Battery Health into Fleet Maintenance
Telematics Integration
Live Battery Data from EV Manufacturer APIs
Oxmaint connects to Tesla Fleet API, Detroit Connect, Volvo Dynafleet, PACCAR telematics, and Ford Pro Fleet API — pulling SoH, temperature, charging cycle data, and internal resistance metrics continuously. No manual data entry. No portal-switching between vehicle types.
Automated Alerts
Threshold Breaches Create Maintenance Work Orders
When SoH drops below a configured threshold, battery temperature exceeds limits, or degradation rate accelerates beyond acceptable parameters, Oxmaint automatically creates a maintenance work order assigned to the relevant technician with battery diagnostic checklist pre-loaded. No manual monitoring required.
Trend Reporting
SoH Degradation Curves per Vehicle
Oxmaint plots SoH over time for each vehicle — overlaid on OEM expected degradation curves to identify vehicles performing above or below expectations. Vehicles with abnormal degradation curves are flagged for charging protocol review before range impact becomes an operational constraint.
CapEx Planning
Battery Replacement Timeline Forecasting
SoH trend data extrapolated forward to predict when each vehicle will reach the 80% replacement threshold. Replacement dates projected 12–18 months ahead — enabling planned procurement, budget allocation, and charger infrastructure adjustment for replacement vehicles. No emergency replacements from untracked degradation.
4 yrs
Battery Life Extended
average extension with active SoH monitoring vs unmonitored fleet operation
$95K
Cost Per Premature Replacement
avoided for each vehicle that reaches designed end-of-life instead of early replacement
3x
Faster Degradation
from exclusive DC fast charging vs Level 2 overnight — the monitoring insight that changes protocols
18 mo
Advance Replacement Warning
SoH trend analysis projects replacement needs, enabling planned procurement vs emergency procurement
Frequently Asked Questions
What is the difference between battery State of Charge (SoC) and State of Health (SoH)?
State of Charge (SoC) is the current charge level — like a fuel gauge, it tells you how much energy is available right now. State of Health (SoH) is the battery's capacity relative to its original design capacity — it tells you how much the battery has degraded over its lifetime. A battery at 90% SoH that is 80% charged (SoC) delivers 72% of its original rated range. Fleet managers should monitor SoH monthly for each vehicle and use the SoH trend to project when vehicles will need route reassignment or replacement — SoC is a daily dispatch variable, SoH is a strategic asset management metric.
How often should fleet managers review battery SoH data for each vehicle?
For new EV fleet deployments (0–12 months), review SoH monthly to establish individual vehicle baselines and identify any units with abnormal early degradation. After 12 months, quarterly SoH reviews are sufficient for vehicles degrading within expected parameters. Any vehicle showing greater than 3% annual degradation rate should be reviewed monthly and its charging protocol audited immediately. When a CMMS is integrated with telematics, threshold-based alerts replace manual review cycles — fleet managers receive notifications when SoH breaches monitoring thresholds rather than needing to schedule periodic manual checks.
Can fleet operators improve battery SoH after degradation has occurred, or is it irreversible?
Most battery degradation is irreversible at the cell chemistry level — once capacity is lost, it does not recover through operational changes. However, improved charging and thermal management practices can dramatically slow the rate of further degradation, extending the remaining useful life from a lower SoH baseline. A vehicle at 85% SoH with corrected charging protocols can reach planned end-of-life at 80% in 3–4 years versus reaching 80% in 12–18 months under unchanged damaging protocols. The financial case for monitoring is about preventing the degradation from occurring, not recovering from it after the fact.
What CMMS data does Oxmaint pull from EV telematics APIs for battery monitoring?
Oxmaint pulls eight core data streams from connected EV telematics APIs: state of health percentage, state of charge percentage, battery pack temperature (min, max, average), charging session data including charger type and peak charge rate, charging cycle count, internal resistance if available from the OEM API, energy delivered per charge session, and range-per-kWh efficiency trends. This data is combined with work order history to create a complete battery lifecycle record — showing not just the current SoH but the operational conditions that drove degradation, enabling both corrective action on individual vehicles and fleet-wide protocol improvements based on aggregated data patterns.
EV Battery Health Monitoring · Oxmaint Fleet Management
Stop Monitoring Battery Health in a Separate Portal — Bring It Into Your CMMS
Oxmaint integrates EV battery state-of-health, temperature, charging cycle, and degradation rate data directly into the preventive maintenance workflow. Threshold breaches create work orders automatically. SoH trends project replacement timelines 12–18 months ahead. And every charging event, thermal alert, and diagnostic record is stored against the vehicle asset — visible alongside ICE fleet maintenance history in one unified platform.