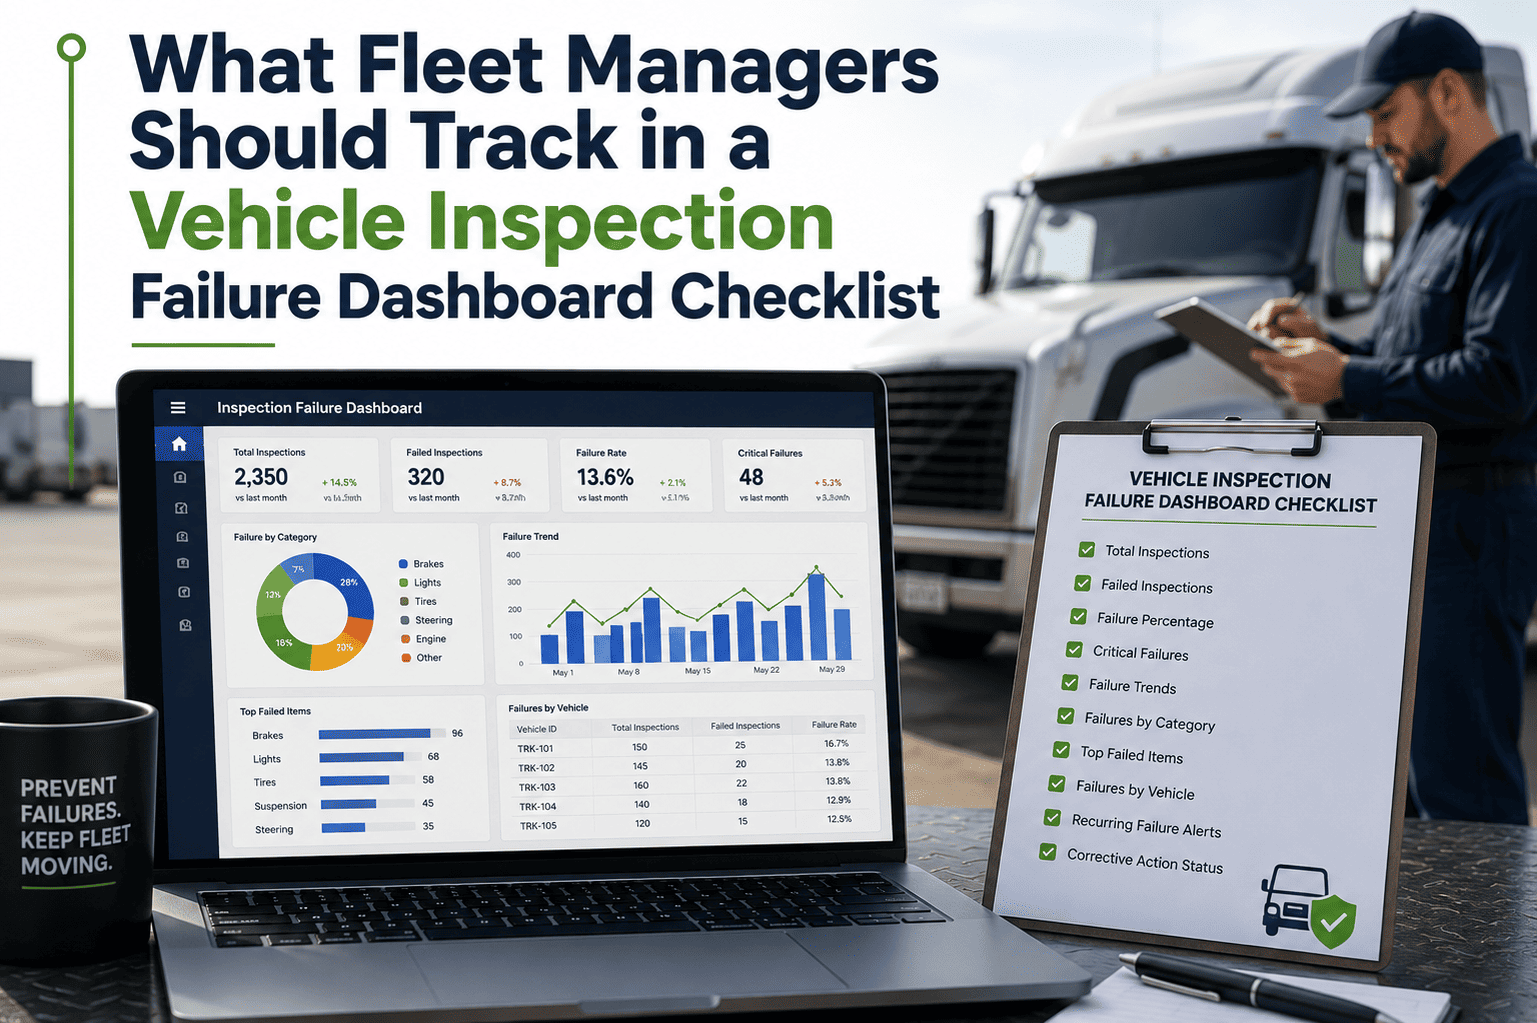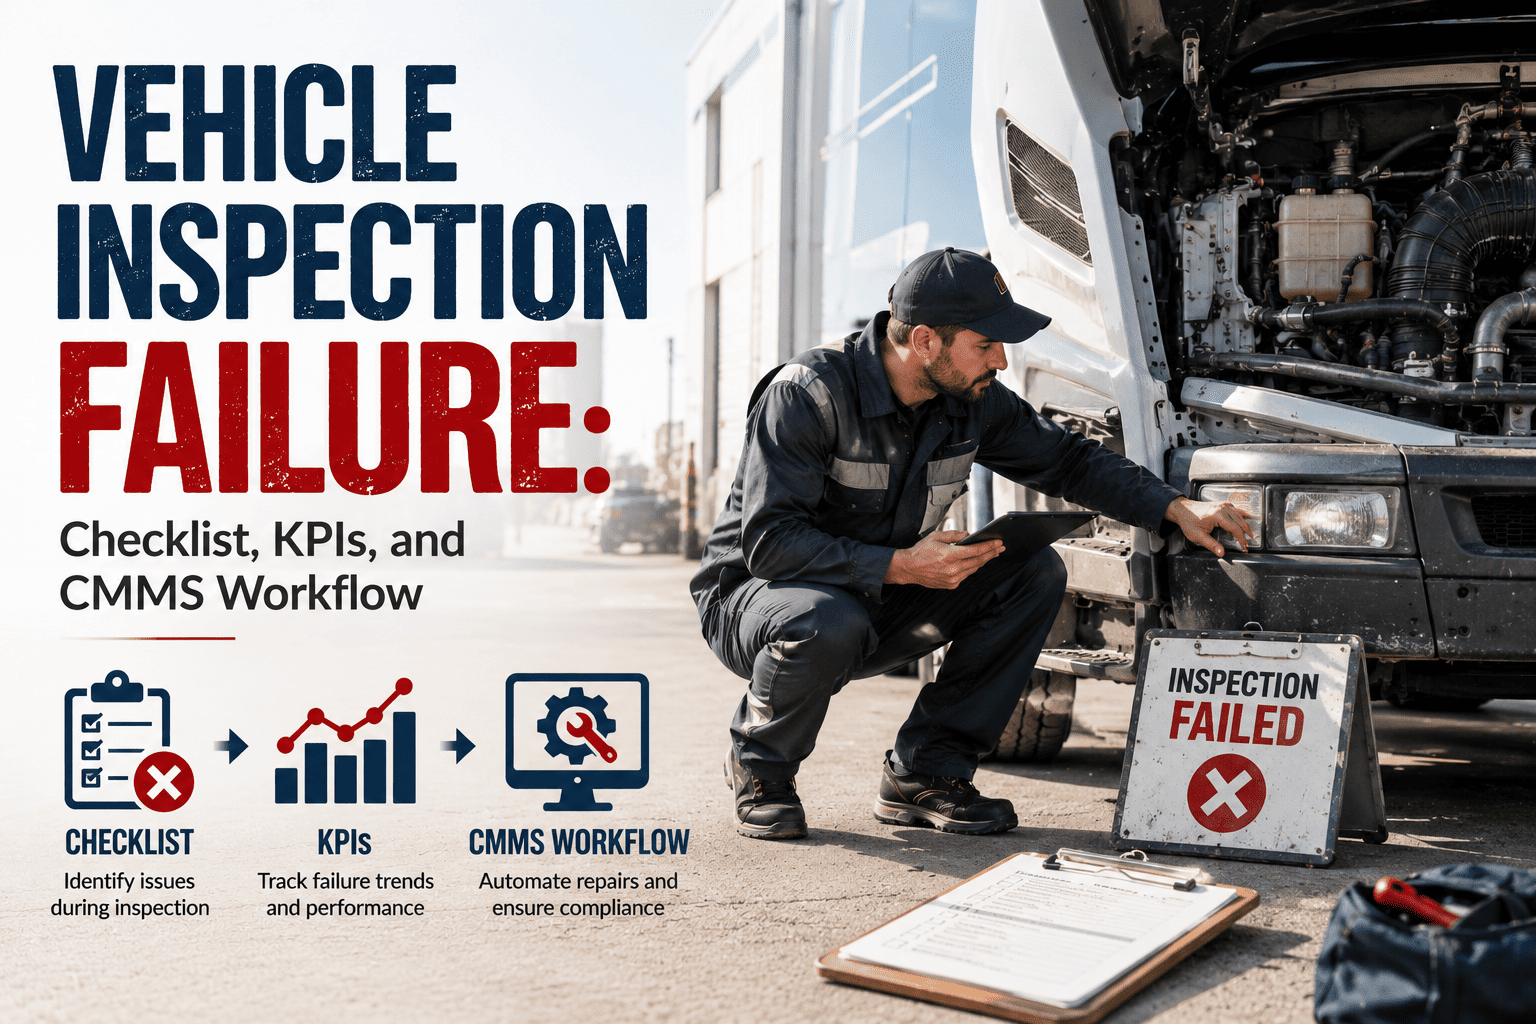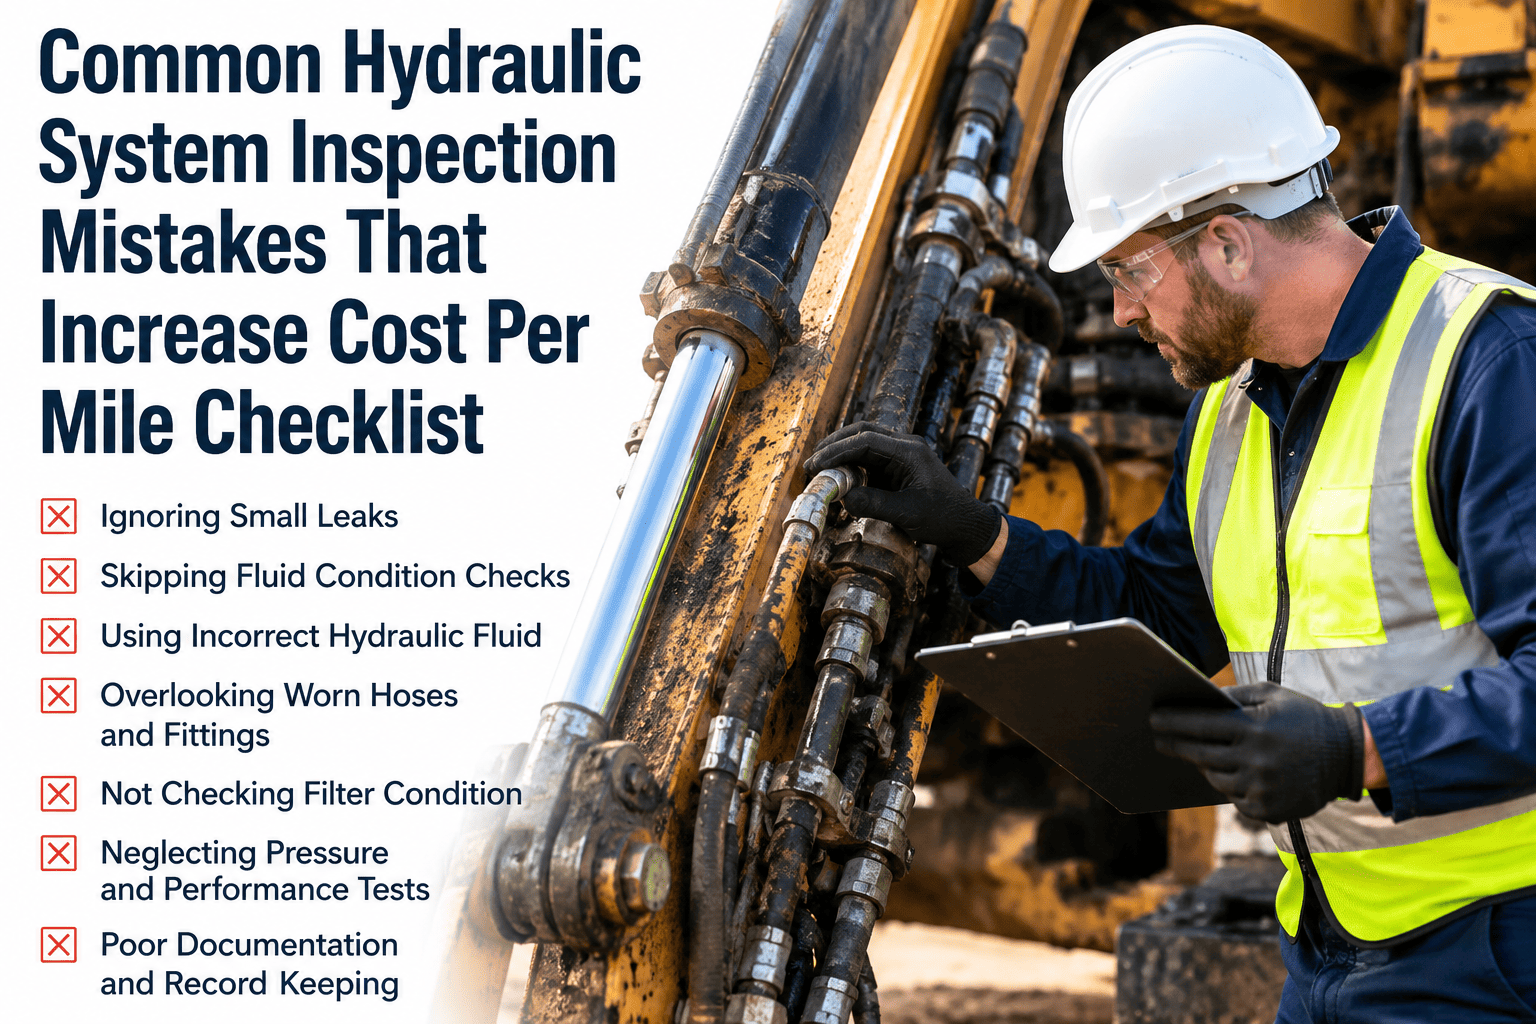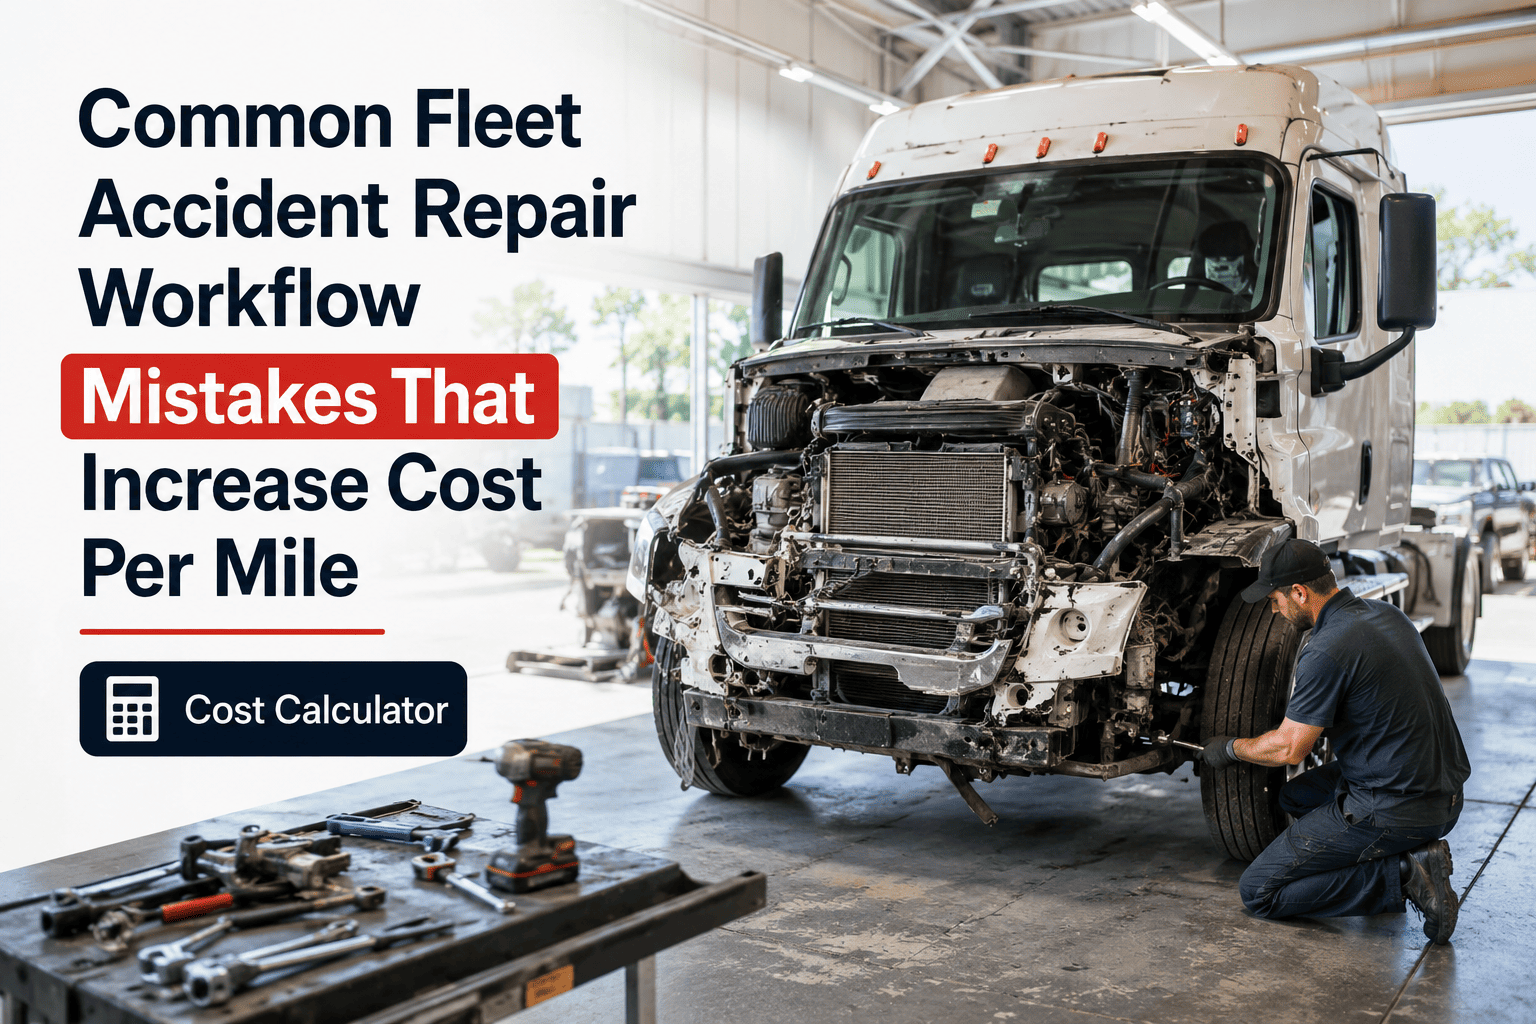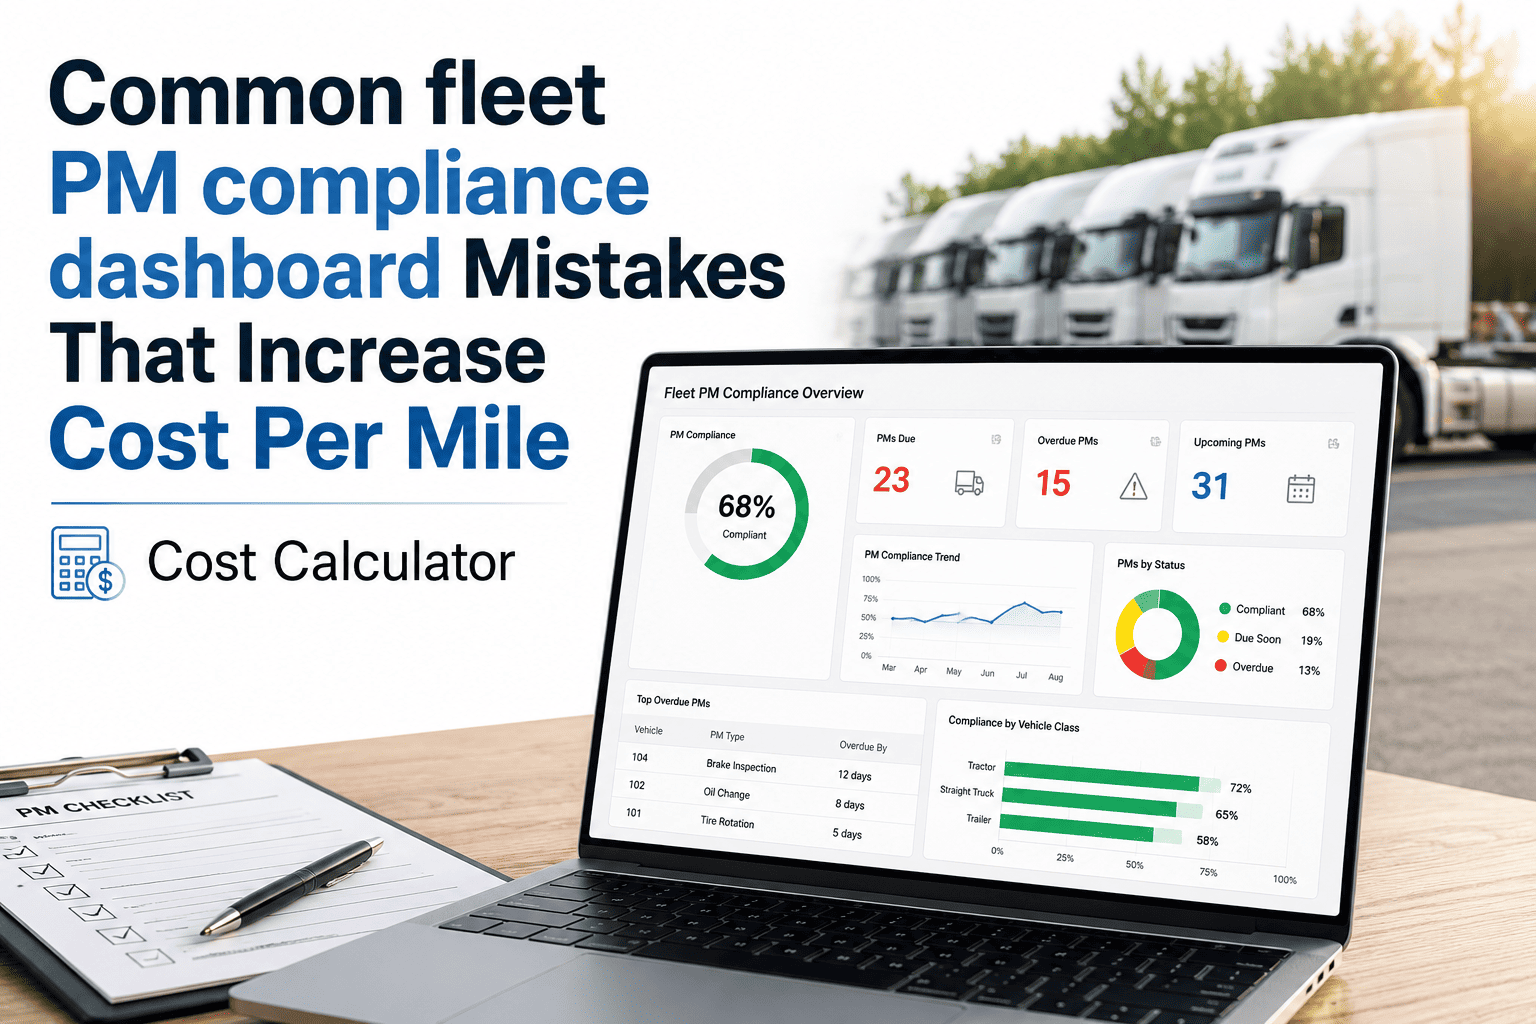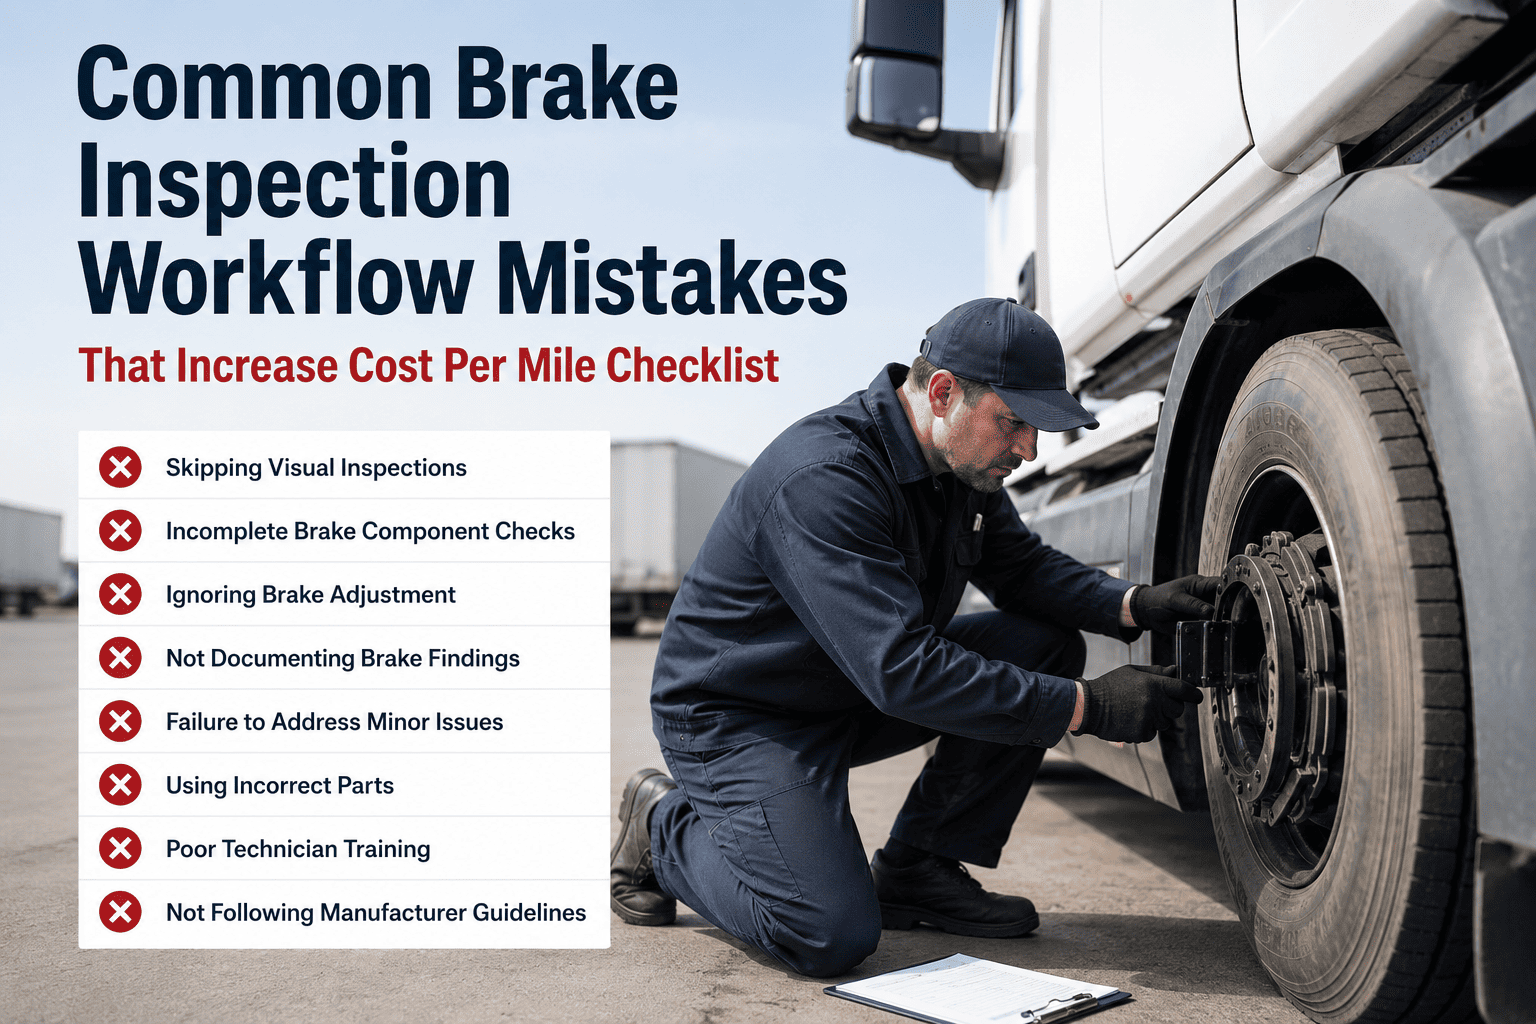
Cost per mile is the number every fleet lives and dies by, and the mistakes that drive it up are rarely dramatic — they are routine inspection failures that quietly stack fuel, wear, and emergency repairs onto the same miles you already bill. A well-maintained fleet runs maintenance near $0.12 to $0.18 per mile; a reactive one drifts toward $0.20 and beyond, and on a 30-truck operation that gap is over $100,000 a year. This guide walks through the common inspection mistakes inflating your cost per mile, what each one really costs, and the fix. Sign Up Free to make the leaks visible.
Find the Inspection Mistakes Draining Your CPM
OxMaint captures labor, parts, and downtime at every work order close and calculates cost per mile per vehicle in real time — so the routine inspection failures inflating your number stop hiding inside a lump maintenance total and become visible, correctable line items.
How Inspection Failures Reach Your Cost Per Mile
Cost per mile divides total operating cost by miles driven. A missed or sloppy inspection does not move the odometer — but it adds fuel, wear, and repair cost to the numerator, so the same expense spreads over fewer productive miles and the number climbs. Every mistake below is a defect that should have been caught cheap at inspection and instead became expensive on the road. Book a Demo to trace the leaks on your fleet.
Pencil-whipped inspections done from memory
Nearly half of paper DVIRs are completed away from the vehicle, so tire wear, fluid leaks, and lighting defects go unreported until they cause a breakdown or a violation averaging over $1,000 — plus CSA impacts that lift insurance premiums 15–25%.
Require a photo and GPS stamp on every inspection so it must be done at the vehicle. Guided digital inspections catch far more defects and auto-generate the work order the moment one is found.
Deferring the small defect the inspection caught
Skipping a small service to save money short-term is one of the most common reasons fleets see runaway costs. A deferred defect becomes a larger repair, and reactive breakdowns run three to nine times the planned cost — before tow charges and lost revenue.
Convert every failed item into a tracked work order with a due date, and escalate any defect open past 48 hours. A defect that cannot be silently deferred cannot silently inflate your CPM.
Scheduling service on miles alone, ignoring hours
A mileage-only interval misses the wear from idling and severe duty, driving emissions-system and engine failures into the repair line that a low odometer hides. Idle hours age an engine like three to six highway hours while adding zero miles.
Trigger PM by mileage, engine hours, or calendar — whichever comes first — and adjust intervals to real operating conditions. Highway units get extended oil intervals; high-idle and city units get accelerated inspections.
Running reactive instead of catching it at inspection
Most maintenance departments still operate mostly in reactive mode — fixing after failure. Emergency roadside repairs average around $1,200 versus roughly $250 for planned service, and the vehicle sits idle at $450–$800 a day in lost use.
Push planned maintenance past 80% of total work. Fleets that make this shift with automated scheduling cut total maintenance spend by around 28% in the first year — straight off cost per mile.
No parts on hand when the inspection finds the fault
When the inspection flags a worn brake set that is not in stock, the repair slips one to three days waiting on overnight shipping — the vehicle idle the whole time — and the parts arrive at premium expedited pricing that compounds the loss.
Tie parts inventory to defect trends with minimum stock levels and reorder alerts. Stocking to your actual failure patterns cuts parts-related delays and eliminates the expedited-shipping premium.
Turn Every Inspection Failure Into Planned Work
OxMaint auto-schedules PM by mileage, hours, or calendar, converts every failed inspection item into a tracked work order, links parts inventory to defect trends, and reports reactive-versus-planned spend live — the exact moves that pull cost per mile back down.
The Cost-Per-Mile Prevention Checklist
Work through these to stop inspection mistakes from inflating your number. Each item attacks one of the leaks above and is something a CMMS can enforce automatically rather than leaving to memory or good intentions.
Photo and GPS proof required on every inspection
Make it impossible to complete a DVIR from the break room. Verified, at-the-vehicle inspections catch the tire, fluid, and lighting defects that otherwise surface as roadside failures and violations.
Auto work order and 48-hour escalation on every defect
No failed item closes without a dated work order, and anything open past 48 hours escalates to a manager. Deferral is where a $250 fix turns into a multi-thousand-dollar breakdown.
PM triggered by mileage, hours, and calendar together
Schedule on whichever threshold comes first and tune intervals to duty cycle. This captures idle and severe-duty wear that a mileage-only schedule lets slide straight into the repair line.
An 80/20 planned-to-unplanned target, tracked weekly
Measure the ratio and drive planned work past 80%. Every point you move from reactive to planned strips emergency-repair premium and downtime cost off your cost per mile.
Parts inventory linked to your defect trends
Set minimum stock and reorder alerts on the components your inspections flag most. Having the part on hand converts a three-day idle wait at premium pricing into a same-shift repair.
Live cost per mile tracked per vehicle and class
Watch CPM trend by unit so a sudden 15% jump without added mileage triggers a cost breakdown. Rising CPM is the earliest signal of either a maintenance process problem or a vehicle past its economic life.
What Fixing These Mistakes Returns
The gap between a reactive fleet and a disciplined one is money you are already spending — it just lands on cost per mile instead of the balance sheet. The table below shows the documented impact of closing each leak, and it scrolls sideways on mobile.
| Fix applied | Documented impact | Where it lands on CPM |
|---|---|---|
| Shift to 80%+ planned maintenance | ~28% lower total maintenance spend in year one | Removes emergency-repair premium |
| PM compliance 72% to 85% | $1,800–$2,400 per vehicle saved in year one | Avoids the $8,000 post-skip failure |
| Digital verified inspections | 40% more defects caught before failure | Fewer roadside repairs and violations |
| Parts tied to defect trends | Parts-related delays cut sharply | Eliminates idle days and expedited fees |
| Structured PM overall | Repair costs down 12–18% | Lower parts and labor per mile |
Our cost per mile had crept up for a year and we blamed fuel and old trucks. When we finally tracked it by vehicle, the real culprit was deferred defects and mileage-only PM — small things the inspection caught and nobody actioned. Enforcing work orders on every failure and switching to hours-based scheduling pulled our maintenance CPM down almost twenty percent in two quarters.
— Fleet Maintenance Manager, regional freight operation, 30 trucks
Frequently Asked Questions
The questions fleet and maintenance managers ask most about the inspection mistakes that quietly raise cost per mile.
Well-maintained fleets run roughly $0.12 to $0.18 per mile, while reactive ones drift toward $0.20 and up. Best-in-class operations sit 20–30% below industry averages through structured PM. Sign Up Free to benchmark yours.
Deferring caught defects into reactive breakdowns, since those cost three to nine times the planned repair. Close behind is mileage-only scheduling, which hides idle and severe-duty wear until it becomes an expensive failure.
Rising cost per mile is the earliest signal of either a maintenance process problem or a vehicle nearing the end of its economic life. A 15% jump in a quarter without added mileage warrants a cost breakdown by repair type.
Yes. Requiring a photo and GPS stamp on defect items forces the inspection to happen at the vehicle. That single change surfaces the tire, fluid, and lighting faults that paper checklists routinely miss.
It automates PM scheduling, turns every failed inspection into a work order, links parts to defect trends, and reports live CPM per vehicle — closing each leak that inflates the number. Book a Demo to see the cost view.
Stop Inspection Mistakes From Inflating Your Cost Per Mile
OxMaint makes every hidden leak visible: verified inspections that catch defects early, automatic work orders that end deferral, hours-based PM that captures real wear, defect-linked parts stocking, and live cost per mile per vehicle — so the routine failures quietly raising your number become correctable, and your CPM heads back down.