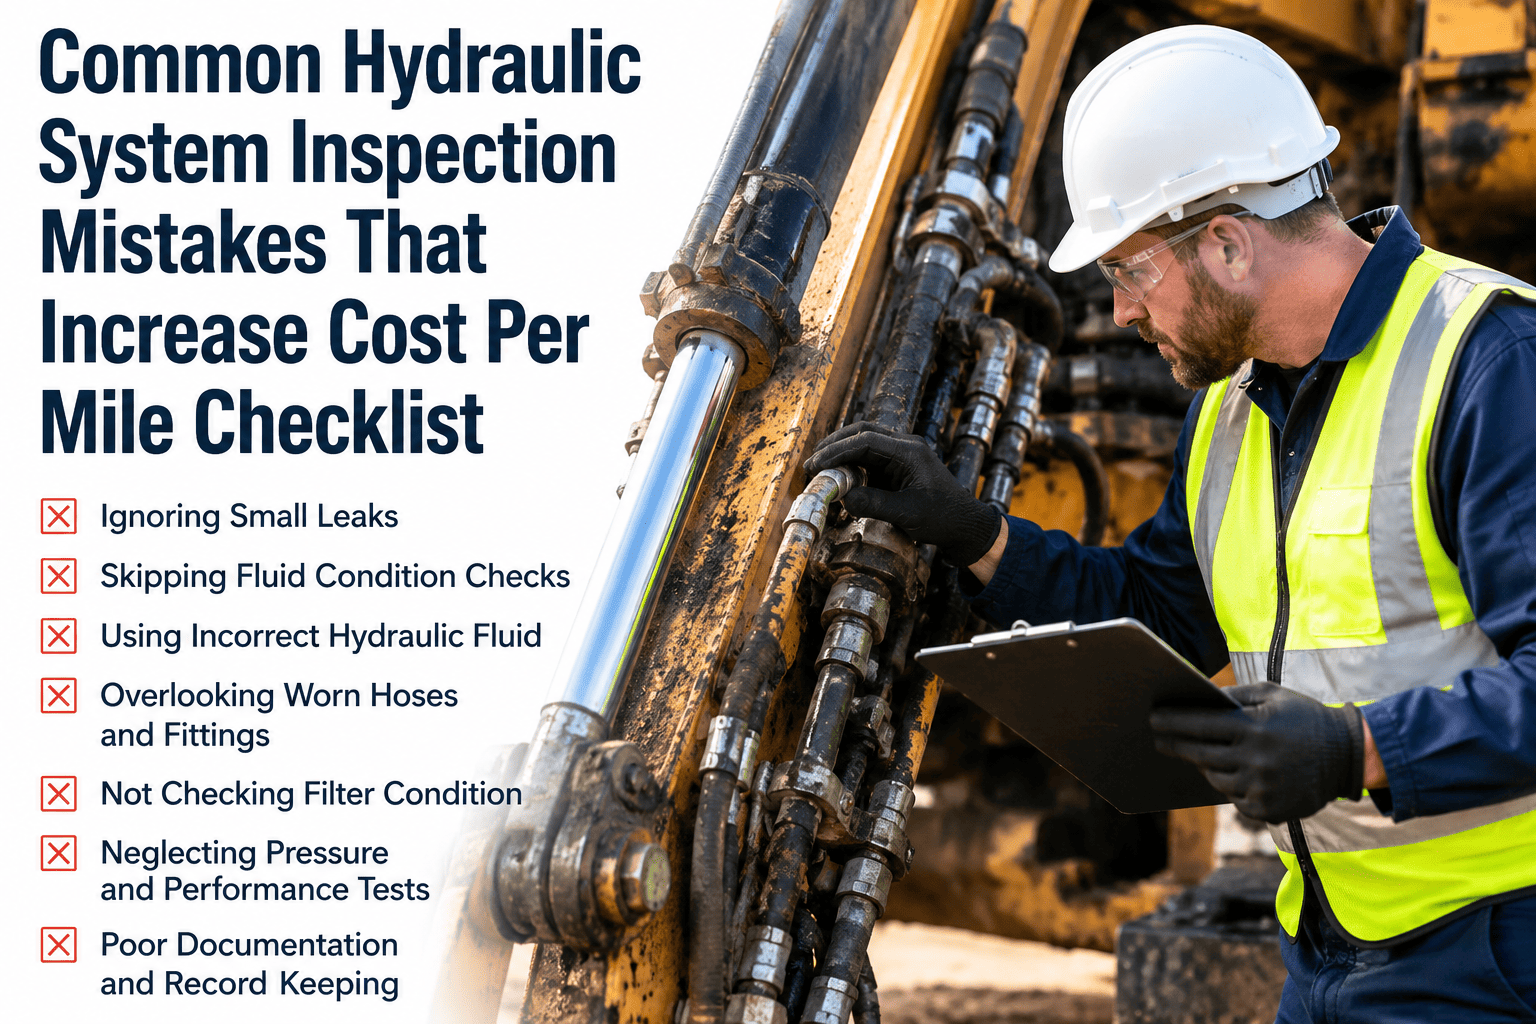
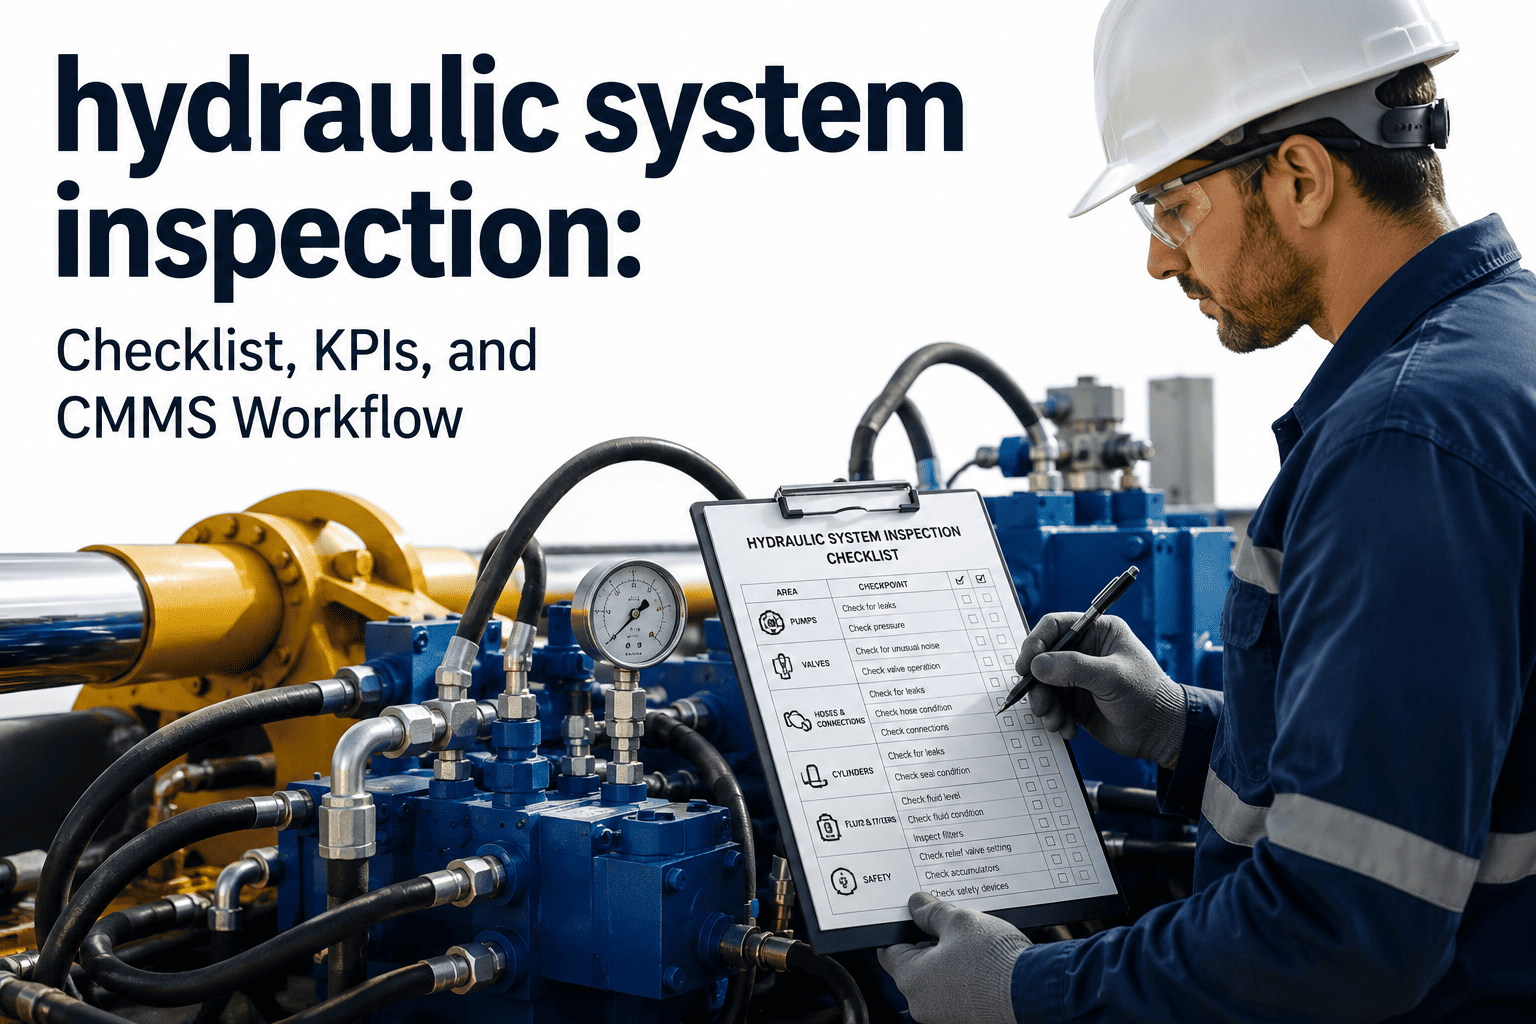
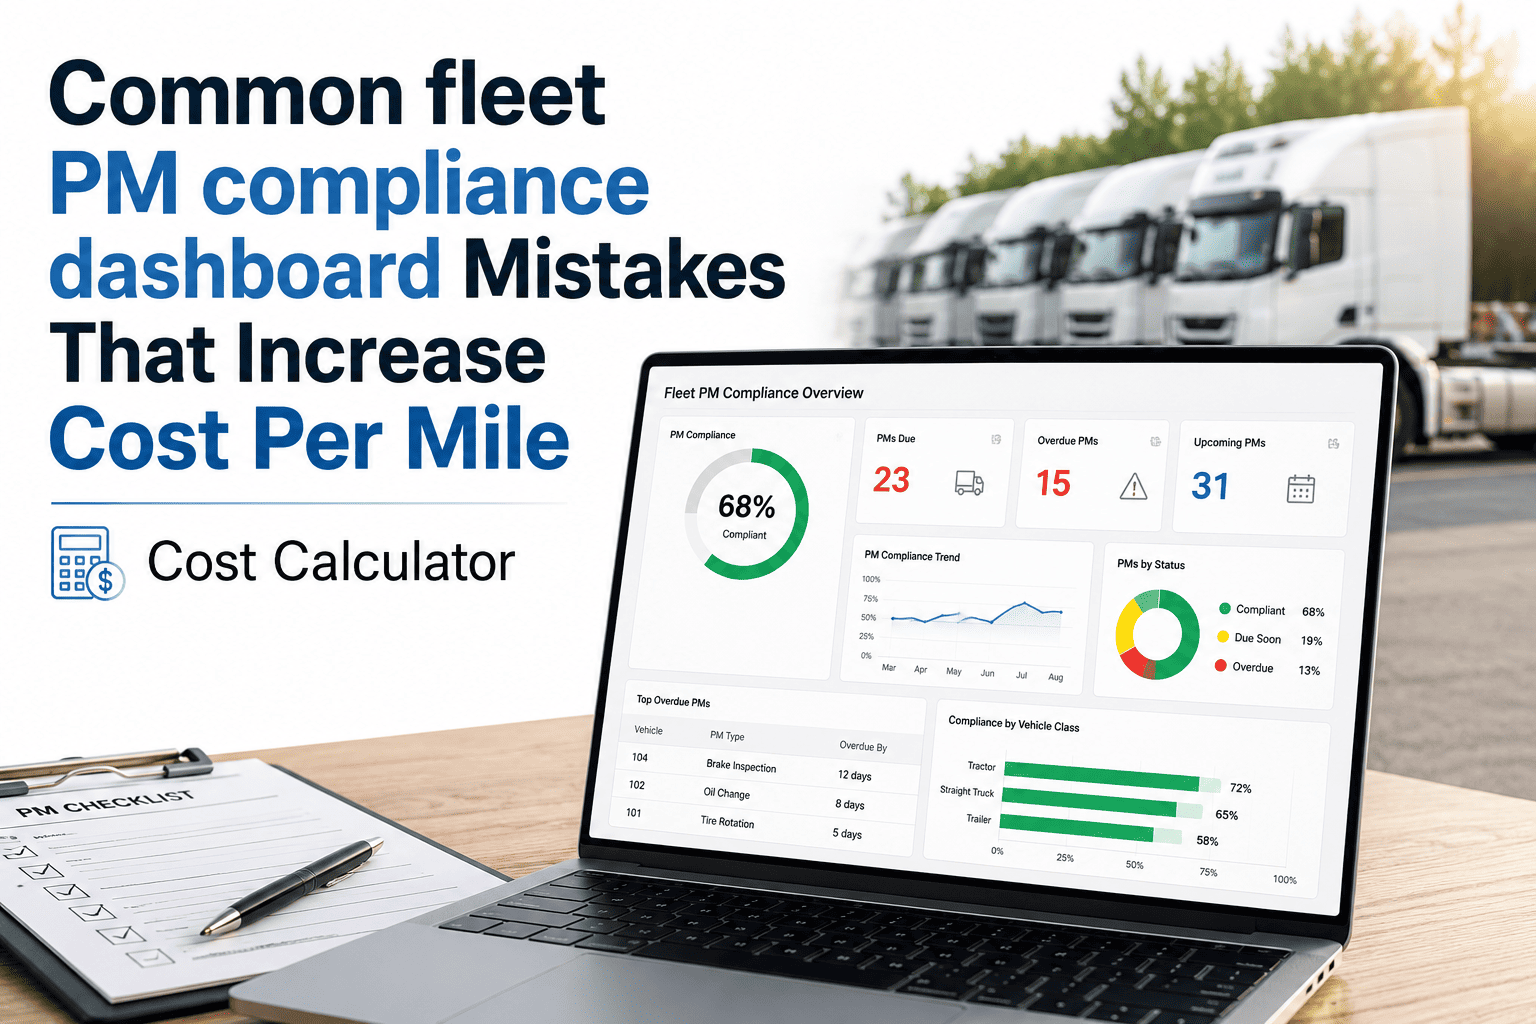
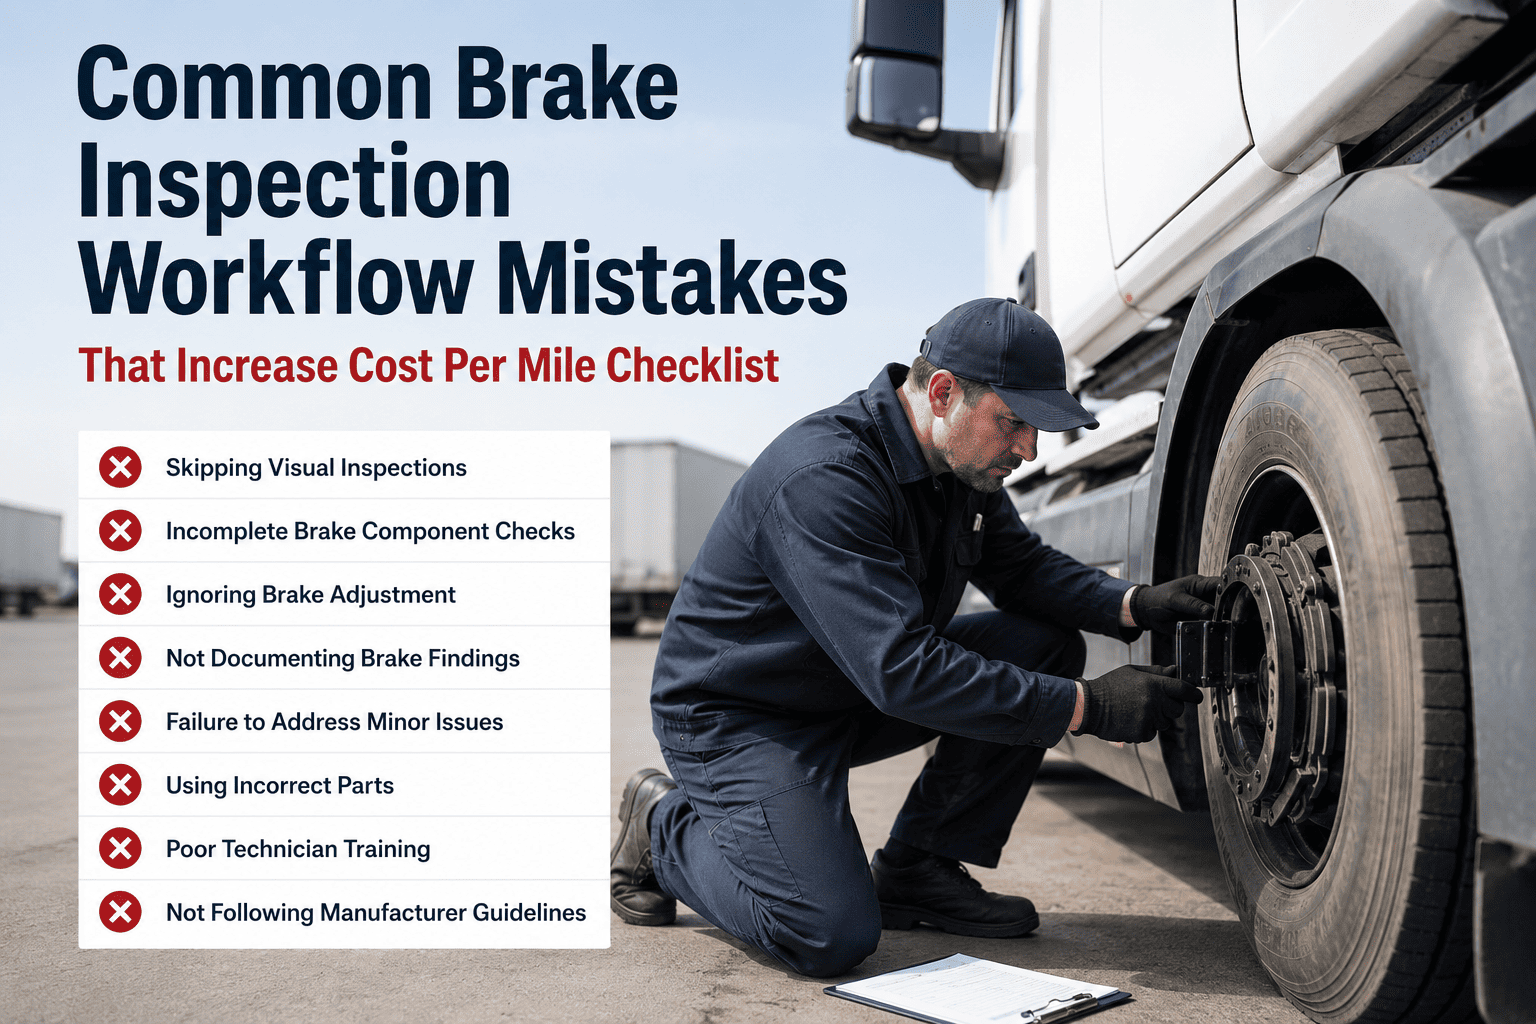
A hydraulic hose seep that costs $50 to fix during a walk-around becomes a $25,000 pump replacement and a two-week downtime event — not because the defect was hard to find, but because an inspection mistake let it slide. Most hydraulic failures are not bad luck; they are the predictable end of a chain that started with a rushed inspection, a vague note, or the wrong oil. Each of those mistakes quietly pushes your cost per mile higher, one deferred defect at a time. The fleets that keep cost per mile low are not luckier — they have simply stopped making the seven mistakes below. Oxmaint closes the gaps that let small hydraulic defects become expensive failures.
Stop the Mistakes That Inflate Cost Per Mile
Oxmaint enforces structured hydraulic inspections with required fields, photo capture, pressure logging, and automatic work orders — eliminating the rushed checks and vague notes that let cheap defects become expensive breakdowns.
How One Missed Seep Becomes a Five-Figure Bill
Hydraulic failures rarely happen all at once. They follow a cascade — each missed action creating the conditions for the next, more expensive one. The cost multiplies at every stage you fail to intervene. Understanding the cascade is how you know exactly where a single inspection mistake costs you the most.
$50–150
Stage 1 — Visible seep at a fitting
A minor weep, easily caught on a proper walk-around. No operational impact yet. Fixed in minutes during scheduled PM.
$500–1,500
Stage 2 — Contamination + air ingress
Where oil leaks out, contamination gets in. Fluid degrades, seals start to suffer, and the developing fault is now hidden inside the system.
$3,000–8,000
Stage 3 — Seal and valve damage
Contaminated oil scores cylinder rods and erodes valve spools. Performance drops, the operator adapts, and the root cause stays unaddressed.
$8,000–25,000
Stage 4 — Pump or cylinder failure
The cavitating pump fails mid-shift, often with the body locked in position. Now it's emergency parts, overtime labour, towing, and lost route revenue.
The Seven Mistakes That Push Cost Per Mile Up
These errors show up across fleets of every size. Each one is small in the moment and expensive over a year. Recognising them in your own operation is the first step to pulling cost per mile back down. Each of these is a gap Oxmaint is built to close.
01
Rushing the inspection
The mistake: A proper hydraulic walk-around takes 10–15 minutes. Under pressure, operators finish in 3–5 — not enough time to look behind the boom where the hose actually runs.
The cost: One construction fleet lost an excavator for two weeks after a pooling leak was missed on rushed morning checks. The pump was destroyed.
02
Vague, undocumented findings
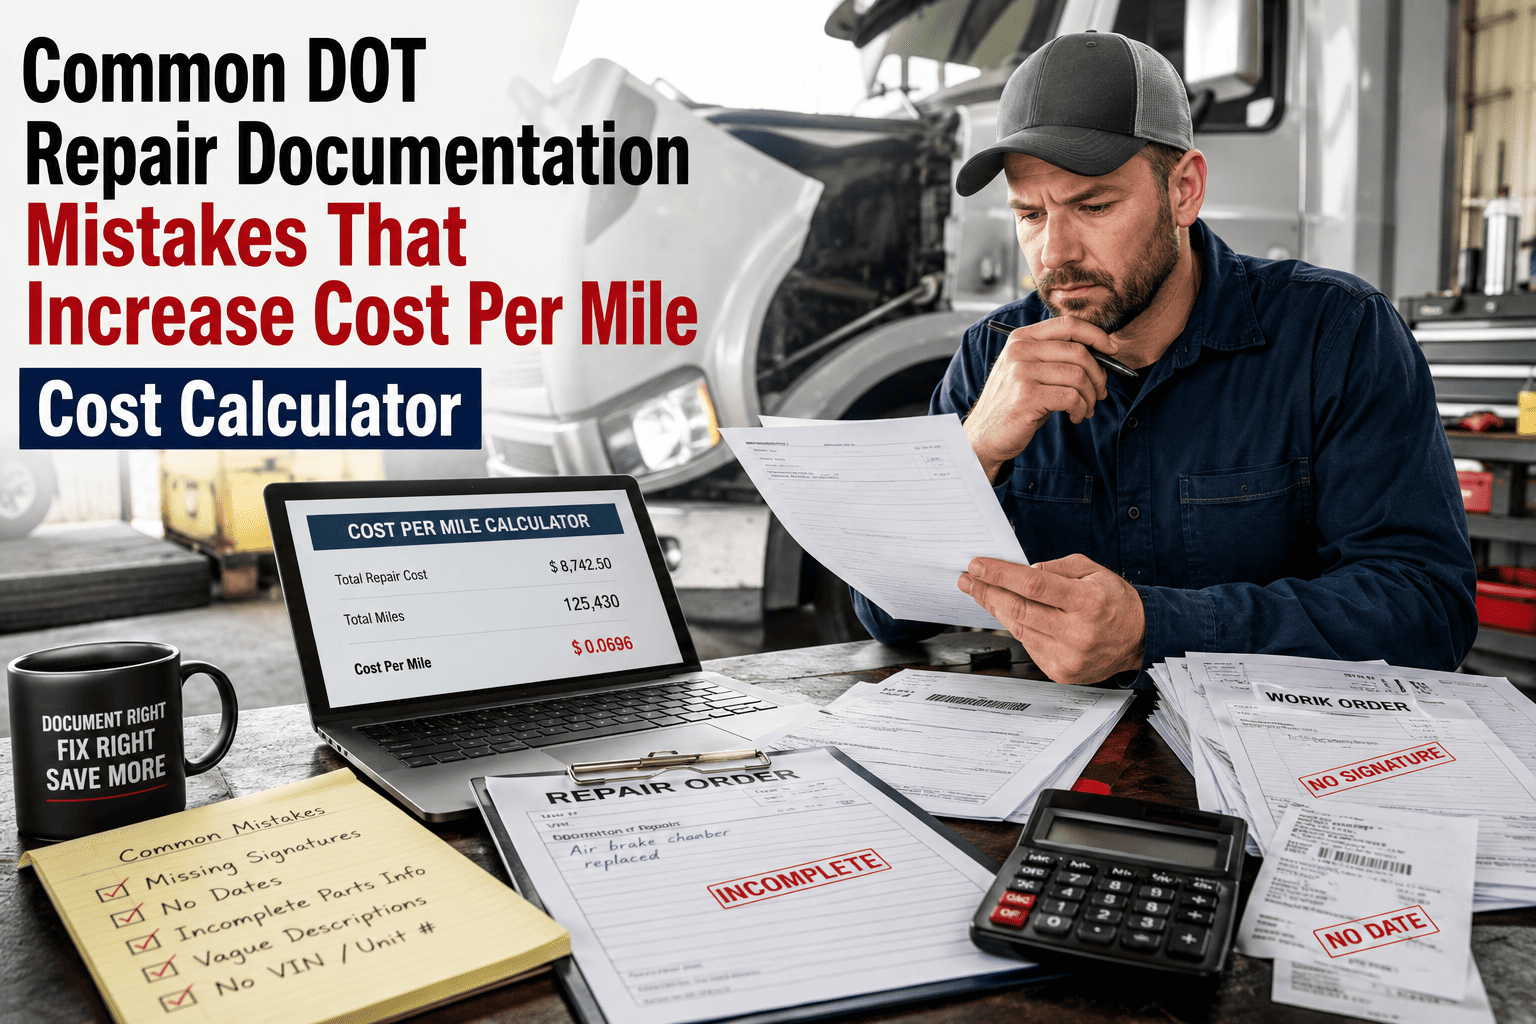
The mistake: A note that just says "hydraulic leak" — no location, no severity, no photo, no hour reading. Every inspection becomes a standalone snapshot with no trend.
The cost: No way to see a worsening leak, defend a liability claim, or prove due diligence. Generic "OK" checkmarks document nothing.
03
Using the wrong hydraulic oil
The mistake: Topping up with whatever is on the shelf. Wrong viscosity means poor lubrication, high operating temperature, and increased friction throughout the system.
The cost: Premature wear, higher fuel and power draw, and early component failure — all compounding silently into cost per mile.
04
Ignoring hose age and routing
The mistake: Replacing hoses only when they fail. Hoses degrade internally even when they look fine, and poor routing lets them chafe against heat sources.
The cost: A burst hose at 2,500 psi is a fluid-injection and fire hazard — and on telescopic booms, hose replacement is among the most expensive jobs.
05
Skipping fluid sampling
The mistake: Never pulling a sample because the oil "looks fine." Contamination causes the majority of hydraulic failures and is invisible to the eye.
The cost: By the time fluid looks milky or black, abrasive particles have already been grinding through pump and valve clearances for weeks.
06
Running pure calendar PM
The mistake: Servicing every vehicle on the same interval. A high-cycle dump truck and a light-duty unit get identical treatment despite wildly different wear.
The cost: High-cycle units are systematically under-serviced and fail early; low-cycle units are over-serviced, wasting parts and labour.
07
Disconnecting maintenance from cost data
The mistake: Tracking repairs but never tying them to cost per mile per vehicle. Fleet-wide averages hide the specific units that are quietly bleeding money.
The cost: Without per-vehicle cost visibility, you can't spot the unit heading for replacement, justify capital requests, or prove your PM ROI. You're flying blind on the one number that matters most.
Turn Every Inspection Into Cost Data You Can Act On
Oxmaint ties every hydraulic work order, part, and labour hour to the specific vehicle that consumed it — giving you true cost per mile per unit and the early warning when one starts to climb.
What These Mistakes Cost — In Real Numbers
The repair-and-maintenance cost per mile for a typical heavy truck sits around $0.20, with construction fleets averaging higher. Hydraulic mistakes don't just add a repair bill — they shift the whole curve. The numbers below show why the cheapest repair is always the one you catch on inspection.
$0.20
average repair-and-maintenance cost per mile for a heavy truck — rising fast on neglected units
3–9x
more that an emergency hydraulic repair costs versus catching the defect during planned PM
70%
of hydraulic maintenance budgets consumed by emergency repairs in fleets without structured inspection
85%
reduction in hydraulic failures reported by fleets that adopt systematic inspection checklists
The Fix — A Structured Inspection That Can't Be Skipped
Every mistake above has the same root cause: an inspection that depends on memory and goodwill instead of structure. Digital inspections close each gap with required fields and an audit trail. Use this as your correction checklist.
Guided steps with time gates — a structured walk-around the operator cannot finish in three minutes, so the hose behind the boom actually gets checked.
Required fields and photos for every defect — location, severity, and an hour reading captured, turning each finding into trackable trend data.
Fluid sampling and hose-age prompts built into the PM — so the invisible failure drivers get measured, not skipped.
Usage-based PM triggers — service by hours, miles, and cycle count so high-duty units get serviced when they actually need it.
Cost tied to each vehicle — every part and labour hour attributed to the unit that consumed it, exposing the truck that's quietly bleeding money.
How to Apply Each Fix on the Shop Floor
Knowing the fix is one thing; making it stick across a crew under time pressure is another. Here's how each correction works in practice — the concrete change that stops the mistake from recurring. Each of these is enforced by structure in Oxmaint, not left to memory.
A
Replace the rush with a guided sequence
A free-form "look it over" collapses to three minutes under pressure. A guided inspection walks the technician through each zone in order — manifold, hoses, cylinders, fittings — so the hose routed behind the boom is a required stop, not an optional one. The check can't be marked complete until each zone is addressed.
B
Kill the vague note with required fields
"Hydraulic leak" tells the next person nothing. Force a location, a severity level, and a photo on every defect. Now the same leak inspected next week shows a clear before-and-after — you can see it worsening, prove due diligence in a claim, and hand the shop an unambiguous repair scope.
C
Lock the correct oil to the asset
Wrong-viscosity top-ups happen when the spec lives in a manual nobody opens. Attach the approved fluid spec to each machine's record so the technician sees it at the point of service — no guessing, no "whatever's on the shelf," no slow burn into higher fuel draw and early wear.
D
Make invisible failure drivers visible
Fluid contamination and hose age are the two biggest hidden causes of failure. Build a fluid-sample prompt into the 250-hour PM and log every hose install date. The system then counts hoses down to the 6-year mark and trends particle count — turning two untracked items into scheduled, predictable actions.
E
Service by real wear, then tie it to cost
Trigger PM on hours, miles, and cycle count so the high-duty unit gets serviced ahead of the light one. Then attribute every part and labour hour to the specific vehicle. The truck quietly inflating your cost per mile stops hiding in the fleet average and becomes a clear repair-or-replace decision.
Our problem was never the technicians — it was that "hydraulic leak — OK" told us nothing. Once Oxmaint required a location, a photo, and an hour reading on every finding, we started catching seeps at the fitting instead of pumps on the roadside. Hydraulic cost per mile on our worst five units dropped by a third in one season.
— Maintenance Supervisor, regional construction fleet, 60+ hydraulic assets
Frequently Asked Questions
Common questions about hydraulic inspection errors and how they drive up cost per mile across a fleet.
QWhich hydraulic inspection mistake costs fleets the most?
Rushed inspections that miss visible leaks. A $50 seep caught early becomes a destroyed pump and weeks of downtime when skipped. The defect was always findable — the time to look was missing.
QWhy does the wrong hydraulic oil raise cost per mile?
Wrong viscosity causes poor lubrication, higher operating temperatures, and more friction — increasing both fuel draw and component wear. The damage is gradual but it compounds directly into your per-mile cost.
QHow often should hydraulic fluid be sampled?
Take a sample at every 250-hour interval and send milky or black samples for a full particle count before returning the vehicle to service. Contamination is the leading failure cause and it's invisible by eye.
QWhy is calendar-only PM a mistake for hydraulics?
It treats a high-cycle unit and a light-duty unit identically. High-duty machines get under-serviced and fail early. Usage-based triggers in Oxmaint service each vehicle by real wear.
QHow do I find which vehicle is driving up costs?
Track cost per mile per vehicle, not fleet-wide averages. A rising number on one unit is the earliest signal of an approaching replacement threshold — and the clearest justification for capital planning.
Catch Defects at $50, Not $25,000
Oxmaint replaces rushed, undocumented hydraulic checks with structured inspections, fluid and hose tracking, and per-vehicle cost data — so cost per mile goes down instead of up. See it on your own fleet within hours.