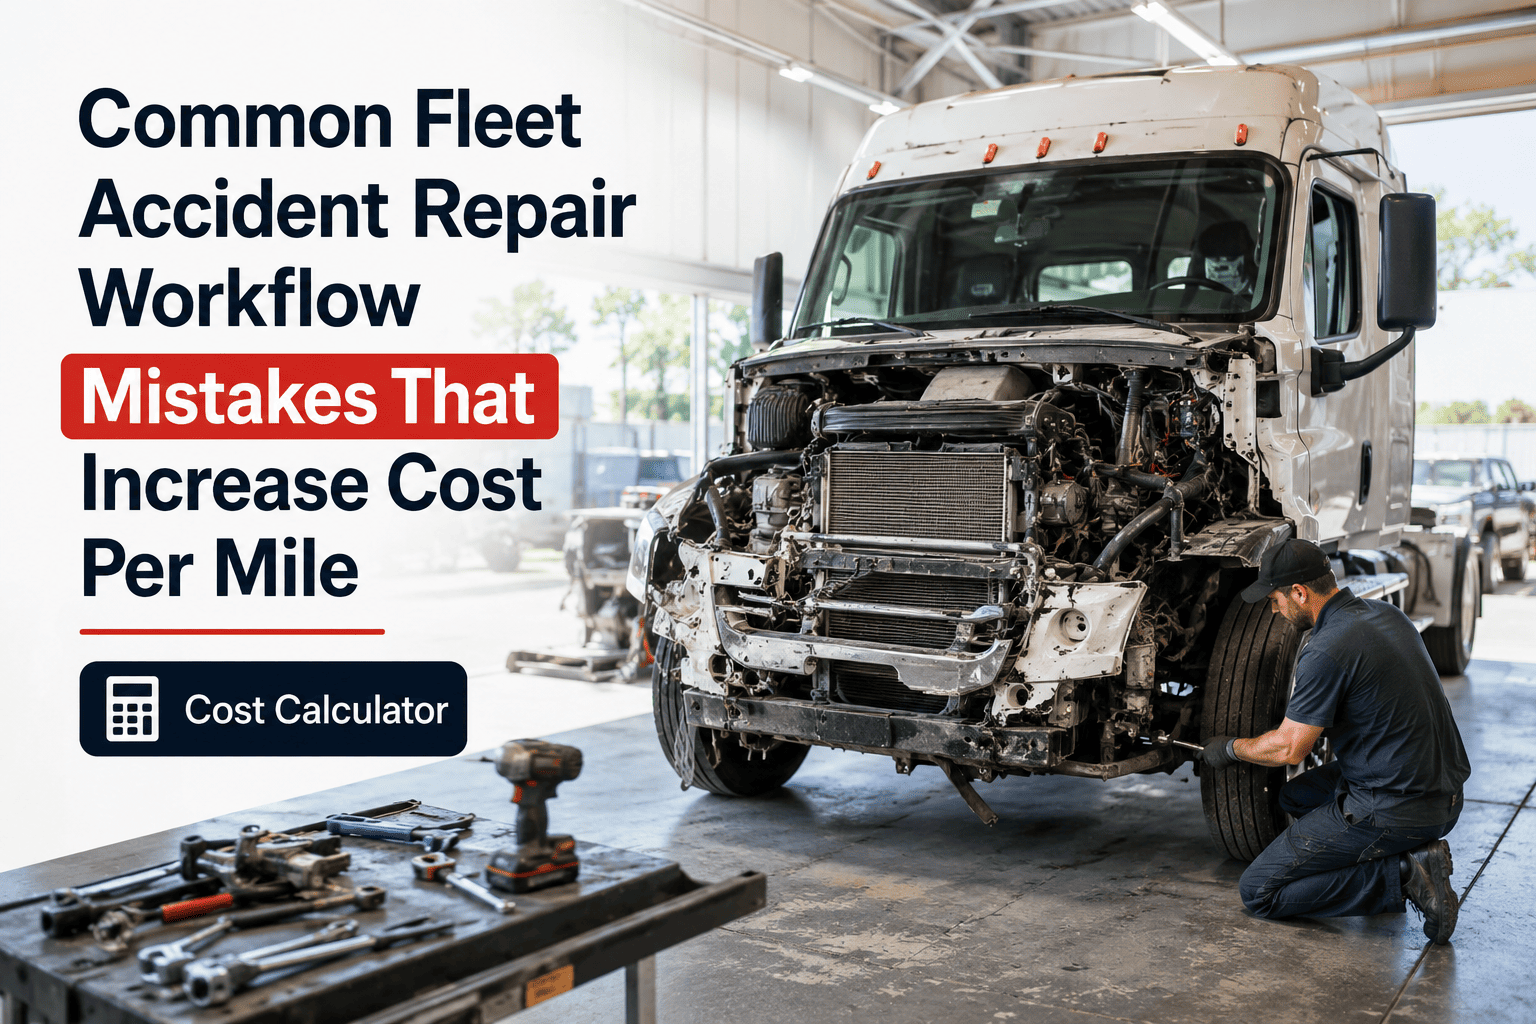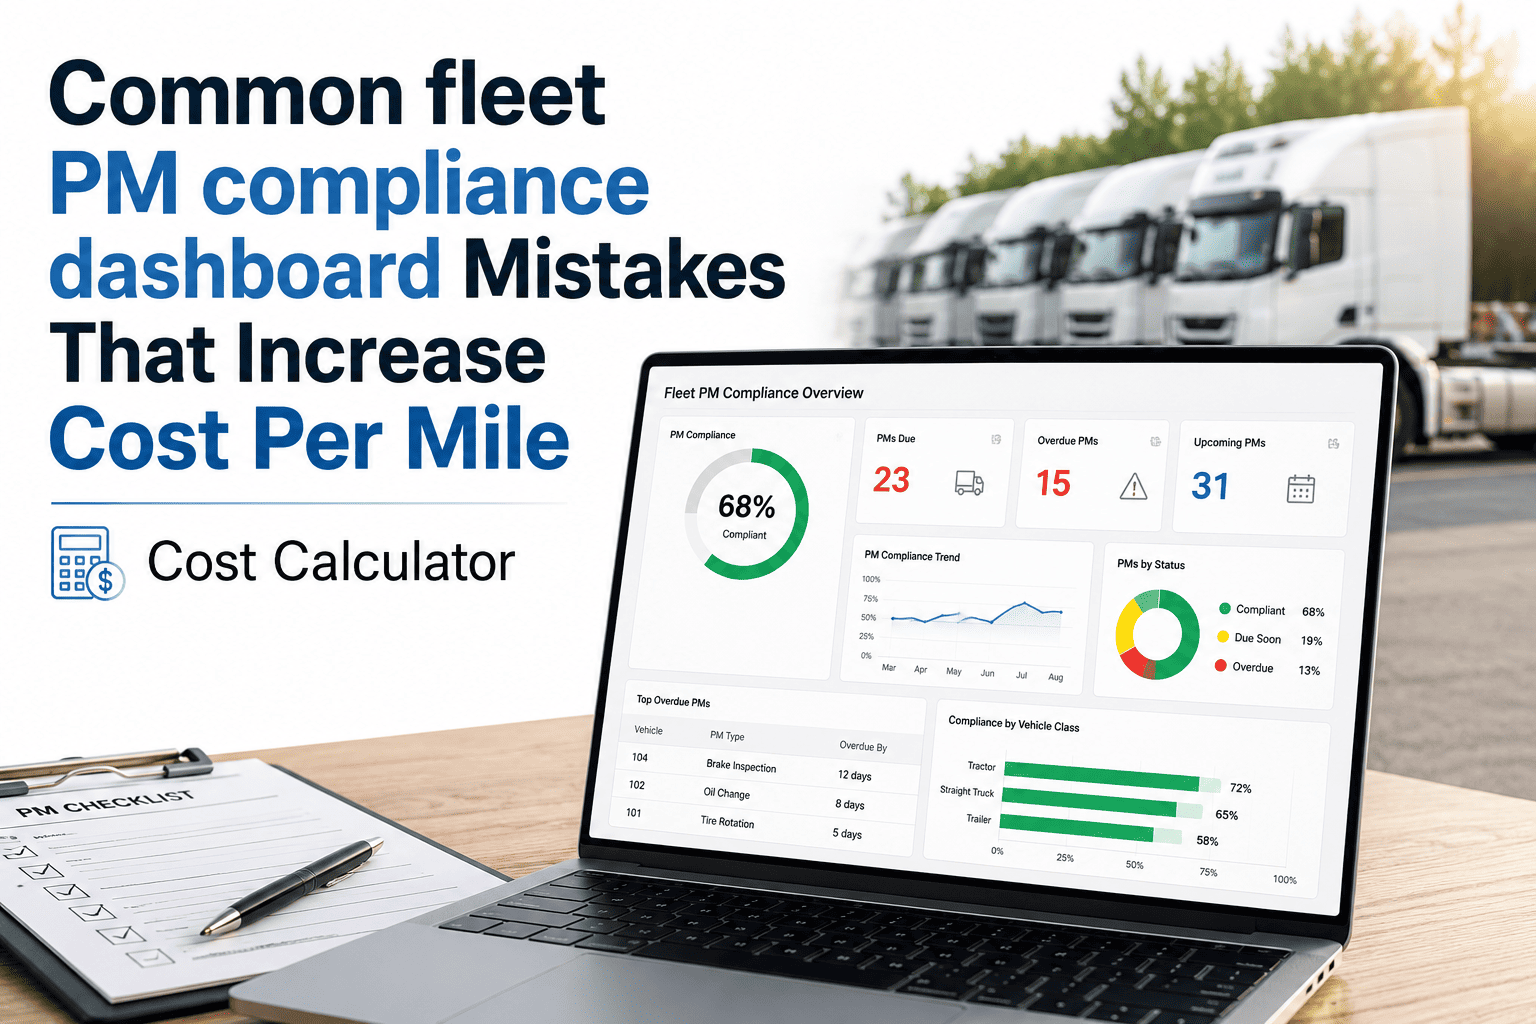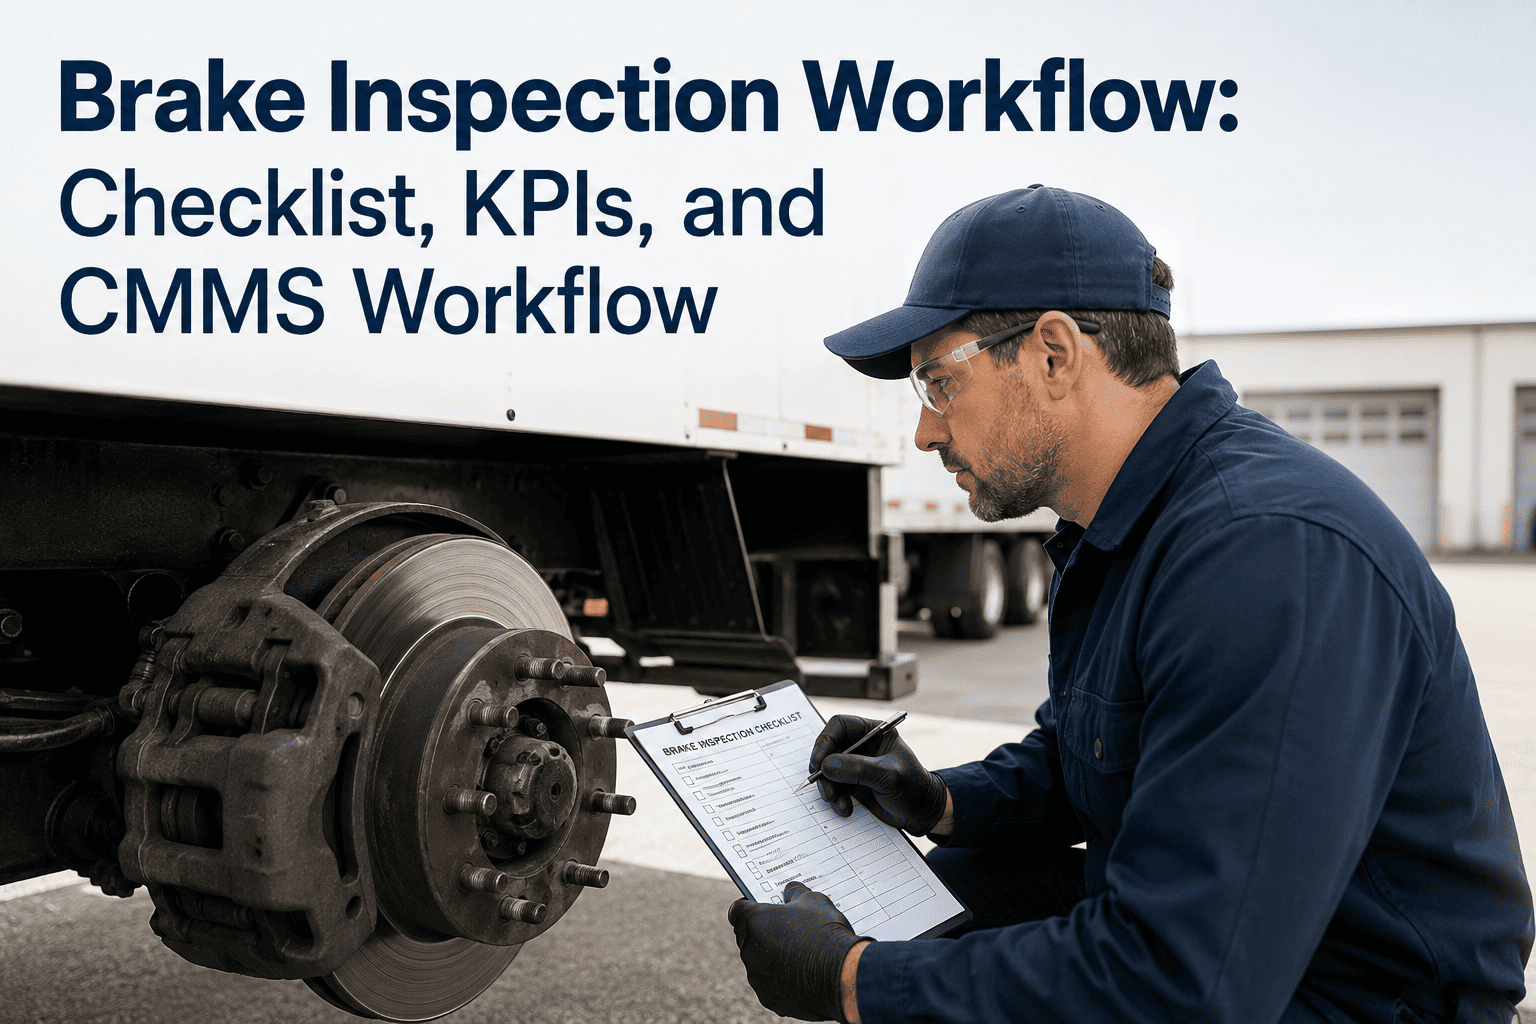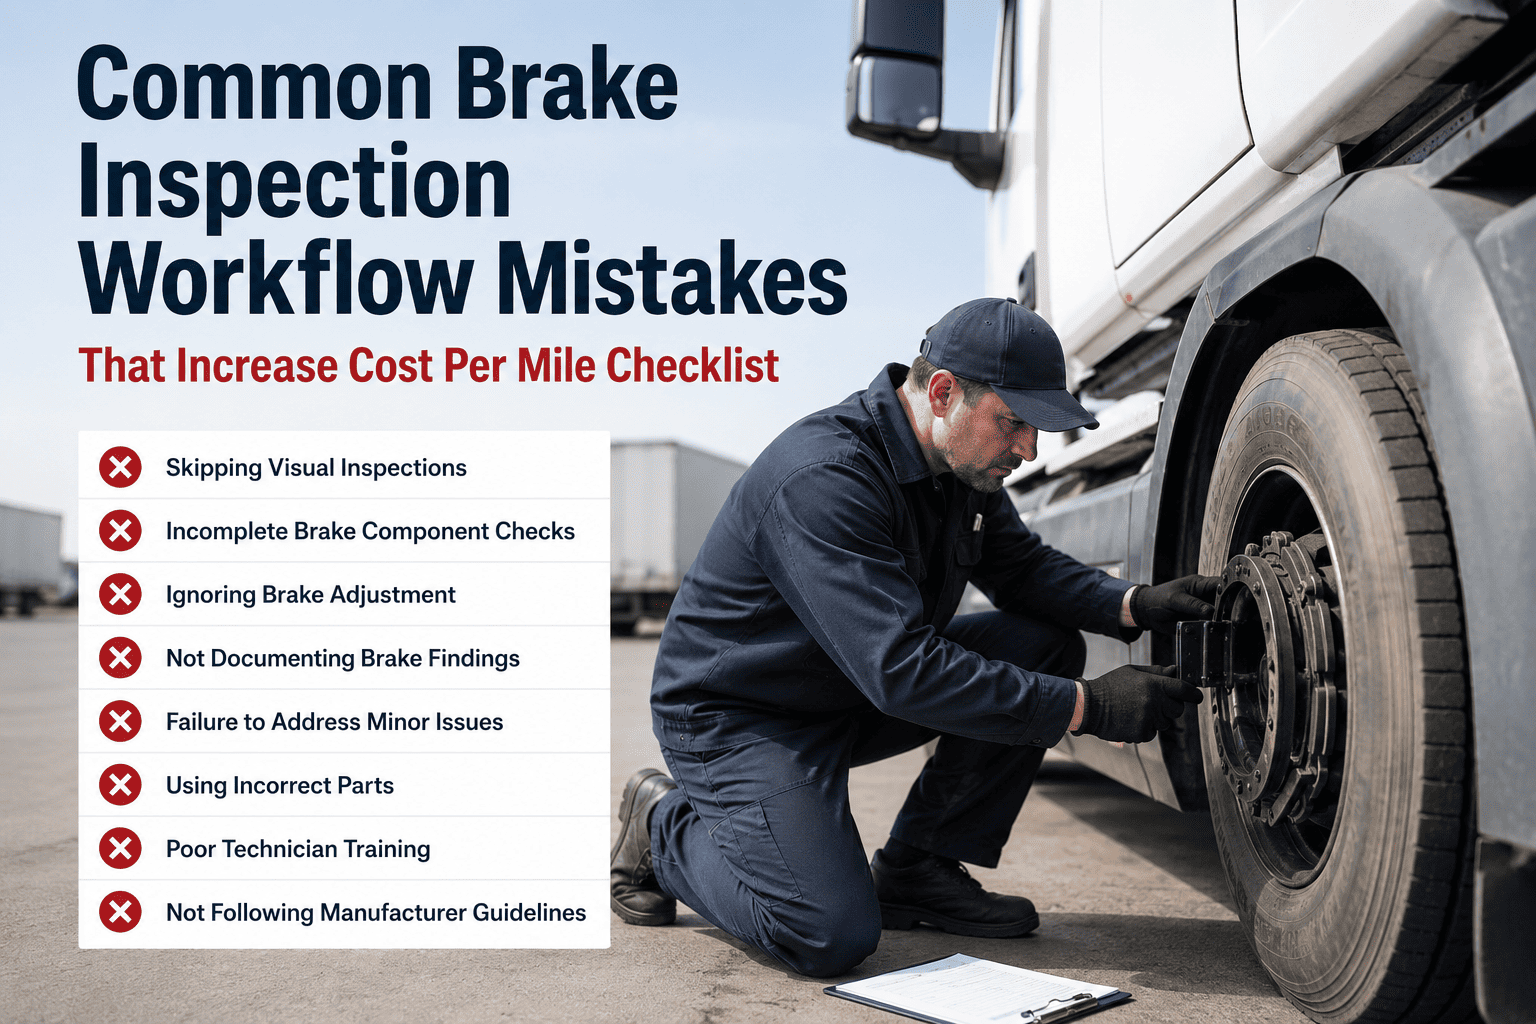
Most brake-related fleet costs do not come from catastrophic failures — they come from systematic inspection mistakes that allow small, fixable problems to progress into expensive component replacements, roadside incidents, and compliance violations. A fleet running brake inspections on a consistent schedule can still face rising brake costs per mile if the inspection workflow produces incomplete data, misses developing defects, or fails to translate findings into timely repairs. Identifying and eliminating these workflow mistakes is the fastest route to measurable cost reduction without increasing inspection frequency. Oxmaint's AI Predictive Maintenance platform helps fleet teams run brake inspections that catch problems earlier, create accurate records, and drive repairs before costs escalate — start at app.oxmaint.ai or book a demo to see the platform.
Stop Paying More Per Mile Than You Should on Brake Maintenance
Oxmaint identifies inspection workflow gaps, tracks brake component wear trends, and alerts your team before small issues become expensive repairs. Fix the process, lower the cost.
The 9 Inspection Workflow Mistakes That Drive Up Brake Costs
Each mistake below has a measurable cost impact — some through direct repair costs, some through compliance penalties, and some through the compounding effect of deferred maintenance on component longevity. The checklist that follows each mistake description shows how to eliminate it from your workflow.
Recording Pass/Fail Instead of Measurements
A pass/fail brake check tells you whether the vehicle is compliant today. A numeric lining thickness measurement tells you when it will stop being compliant — and how much margin you have to schedule replacement at lower cost. Fleets that record only pass/fail results replace brake linings reactively, often when lining is already at or below the OOS threshold, and frequently during a roadside stop rather than a planned PM event.
Inspecting Accessible Wheels Only
When inspection time is limited, technicians check the outer wheels that are easily visible and skip the inner wheels that require more access time. Inner drum and lining conditions are often significantly worse than outer conditions — particularly on rear axles that accumulate road debris on the inner side. Fleets that discover inner wheel brake damage during drum removal during an unrelated repair consistently report significantly higher repair costs than those found during proactive inspection.
Not Testing Air System Leak Rate
Air system leaks rarely cause immediate brake failure — they cause gradual degradation that is invisible until the system cannot build pressure fast enough after multiple stops. Technicians who omit the pressure drop test because the system appears to hold pressure at rest miss leaks that only manifest under repeated brake application cycles. By the time the leak is significant enough to affect build-up time, downstream damage to air dryers and compressors has already occurred.
Manually Readjusting Automatic Slack Adjusters
Automatic slack adjusters that require manual readjustment during an inspection are not "out of adjustment" — they are malfunctioning and must be replaced. Technicians who manually readjust an ASA and return the vehicle to service have temporarily masked a defect that will recur within 5,000 to 10,000 miles, often faster. The repeated readjustment also masks the underlying pushrod stroke trend that would otherwise identify the failing adjuster in the measurement data.
Mixing OEM and Aftermarket Components Without Documentation
When brake components are replaced with different-spec alternatives — whether aftermarket linings with a different friction coefficient or drums with a different thermal rating — the wear rates from previous inspections no longer predict future replacement timing. Fleets that don't document the component specification used at each repair lose the ability to trend lining wear accurately, leading to either premature replacement or late-detected wear-out, both of which increase cost per mile.
No Re-Inspection After Brake Repairs
When a brake repair work order is closed without a documented re-inspection, the fleet has no evidence that the repair corrected the defect. Incorrectly installed brake components — particularly self-adjuster assemblies and cam hardware — often pass a static check immediately after installation but fail under load within 5,000 to 10,000 miles. A formal re-inspection requirement with sign-off catches installation errors before they produce repeat incidents.
Using Mileage Intervals Without Hour-Based Triggers
A single inspection interval in miles cannot account for the difference in brake loading between a highway vehicle traveling 65 mph and a delivery vehicle making 40 stops per day. The stop-and-go vehicle's brakes degrade several times faster per mile. Fleets applying a uniform 15,000-mile inspection interval to both vehicle types consistently find that city vehicles arrive at inspection with linings already below the replacement threshold, while highway vehicles still have significant life remaining.
Treating Drum Scoring as a Visual-Only Assessment
Drum scoring severity can only be assessed accurately by measuring the scoring depth with a depth gauge and comparing it to the maximum allowable depth and the drum discard diameter. Visual assessment of drum condition consistently underestimates scoring severity — what appears to be light scoring is often beyond the 0.090" depth limit when measured. Drums returned to service on visual assessment alone are frequently found to be beyond the discard diameter when removed for the next lining change.
Disconnecting Inspection Records from Cost Tracking
When brake inspection records are stored separately from repair cost records, fleet managers cannot identify which vehicles have disproportionately high brake costs relative to their mileage, age, or duty cycle. The vehicles consuming the most brake maintenance budget are invisible until a manual review is performed — by which time the cost pattern has continued for months. Linking inspection data to repair costs in a single system enables real-time cost-per-mile tracking by vehicle.
Oxmaint links brake inspection records, repair work orders, parts costs, and lining wear trends in a single platform — giving fleet managers real-time brake cost per mile visibility and predictive replacement alerts before costs escalate. See the difference at app.oxmaint.ai or book a platform demo.
Mistake Correction Checklist — For Your Next Inspection Audit
Use this checklist to audit your current brake inspection workflow against the nine mistake patterns above. Each item represents a process check that fleet managers can verify without observing individual technicians.
Verify that inspection forms capture numeric measurements, not pass/fail only
Pull the last 10 completed brake inspection records. If lining thickness appears as "Good," "Pass," or a checkbox rather than a number in 32nds, your current form does not support predictive scheduling.
Confirm that all wheel positions are individually documented
Check whether inspection records show results per axle or per wheel position. Axle-level records allow individual wheel defects to be hidden in an axle-level pass result.
Check that air pressure drop rate is recorded in psi/minute, not as a pass/fail
Review 5 inspection records and look for a numeric pressure drop measurement. If the field shows only a checkbox or "No leaks noted," the air system test is not producing comparable trend data.
Verify that ASA manual adjustment is treated as a defect, not a correction
Review the last 20 inspection records for any mention of slack adjuster adjustment. If adjustments appear as a routine action rather than a defect finding followed by replacement, the workflow is masking failing ASAs.
Confirm that brake repair work orders include a re-inspection sign-off
Pull 5 closed brake repair work orders and check whether a re-inspection is documented after repair completion. If the work order closes at repair sign-off without a re-inspection record, there is no evidence repairs were verified.
Check that inspection intervals are assigned by duty cycle, not a uniform mileage
Review asset profiles for your city delivery vehicles and highway vehicles. If both have the same inspection interval, the city vehicles are being inspected less frequently than their brake wear rate requires.
Frequently Asked Questions
Fix the Workflow, Lower the Cost Per Mile
Oxmaint helps fleet teams eliminate the nine inspection mistakes that drive up brake costs — with digital measurement capture, predictive wear alerts, and repair-to-re-inspection tracking that closes every defect loop before costs compound.