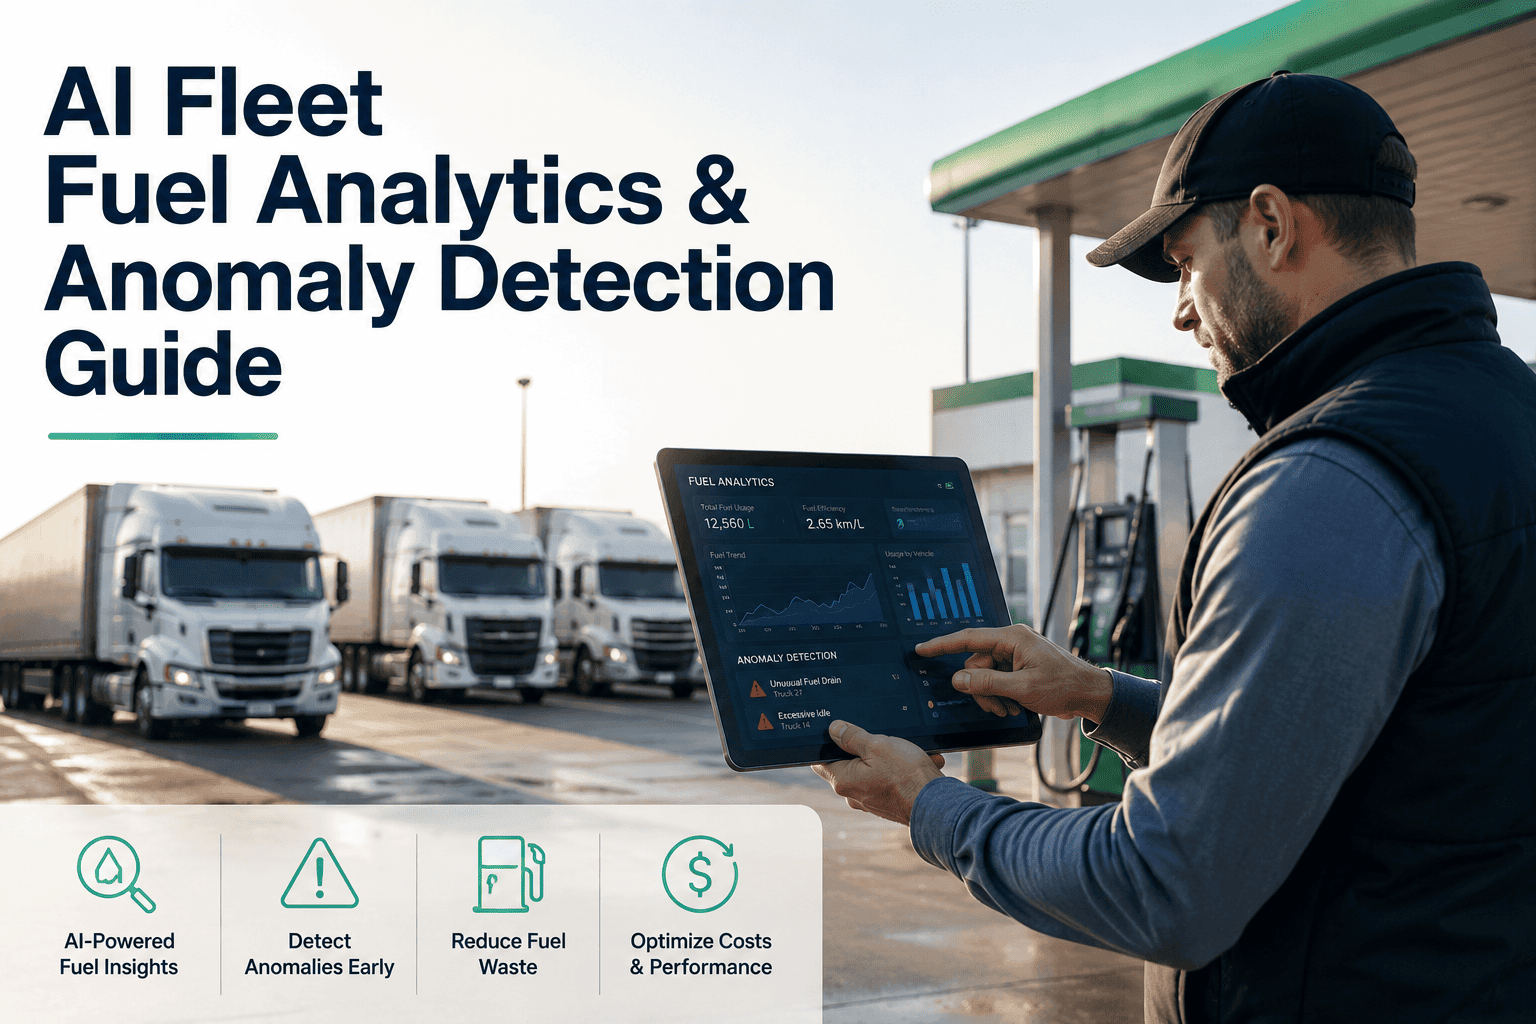
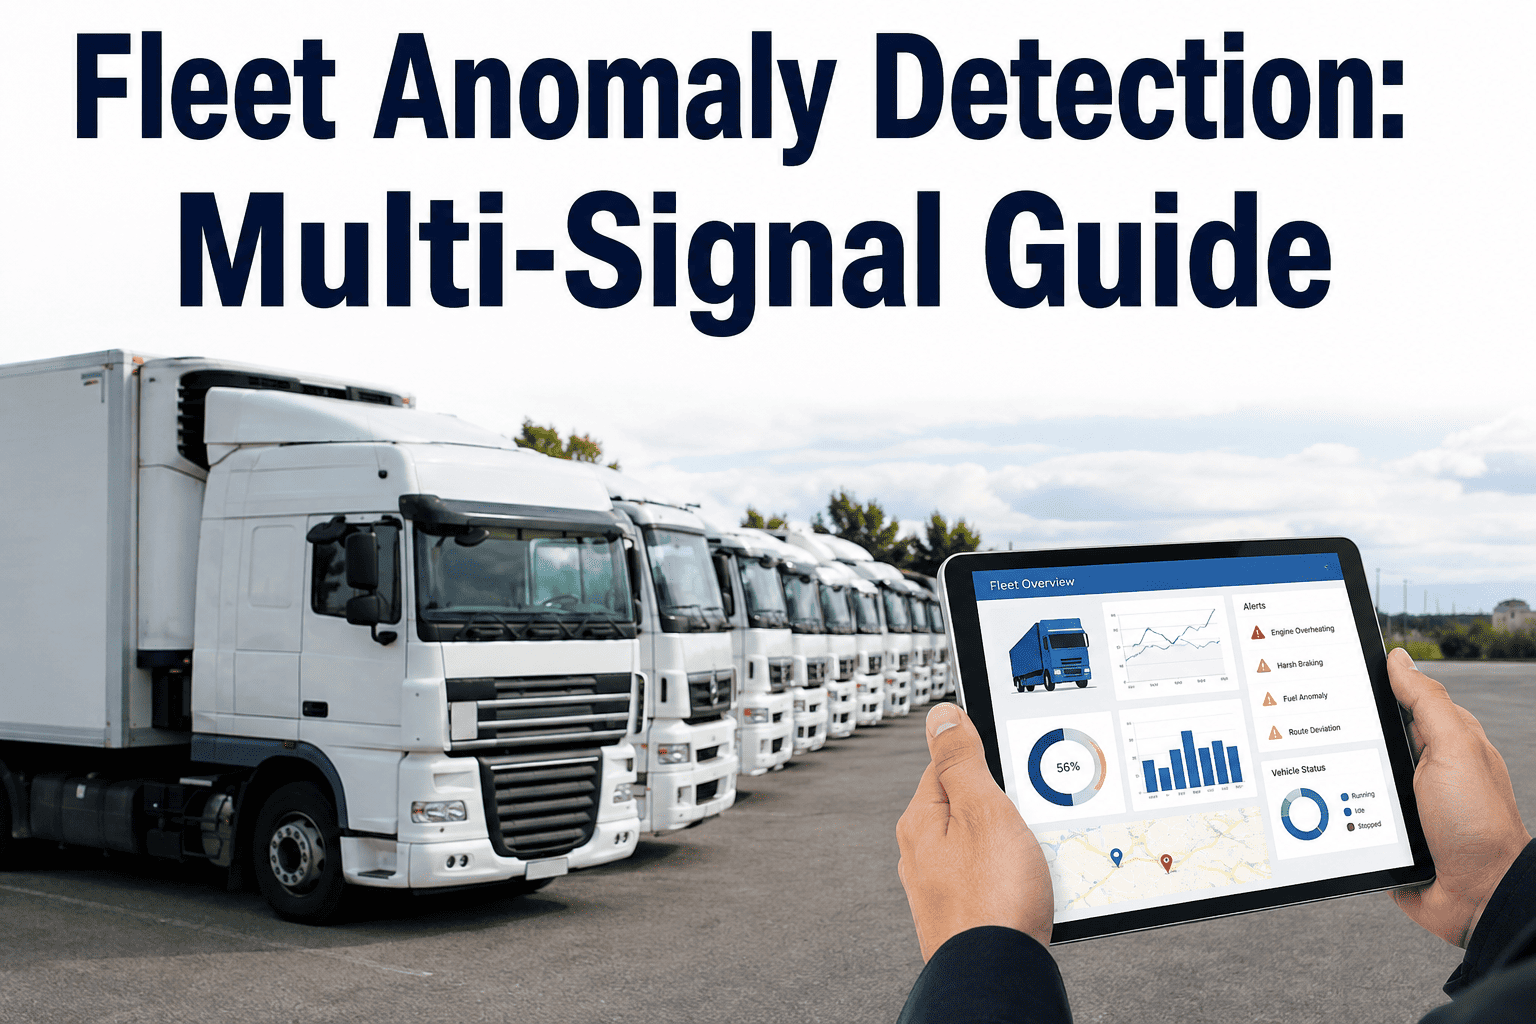
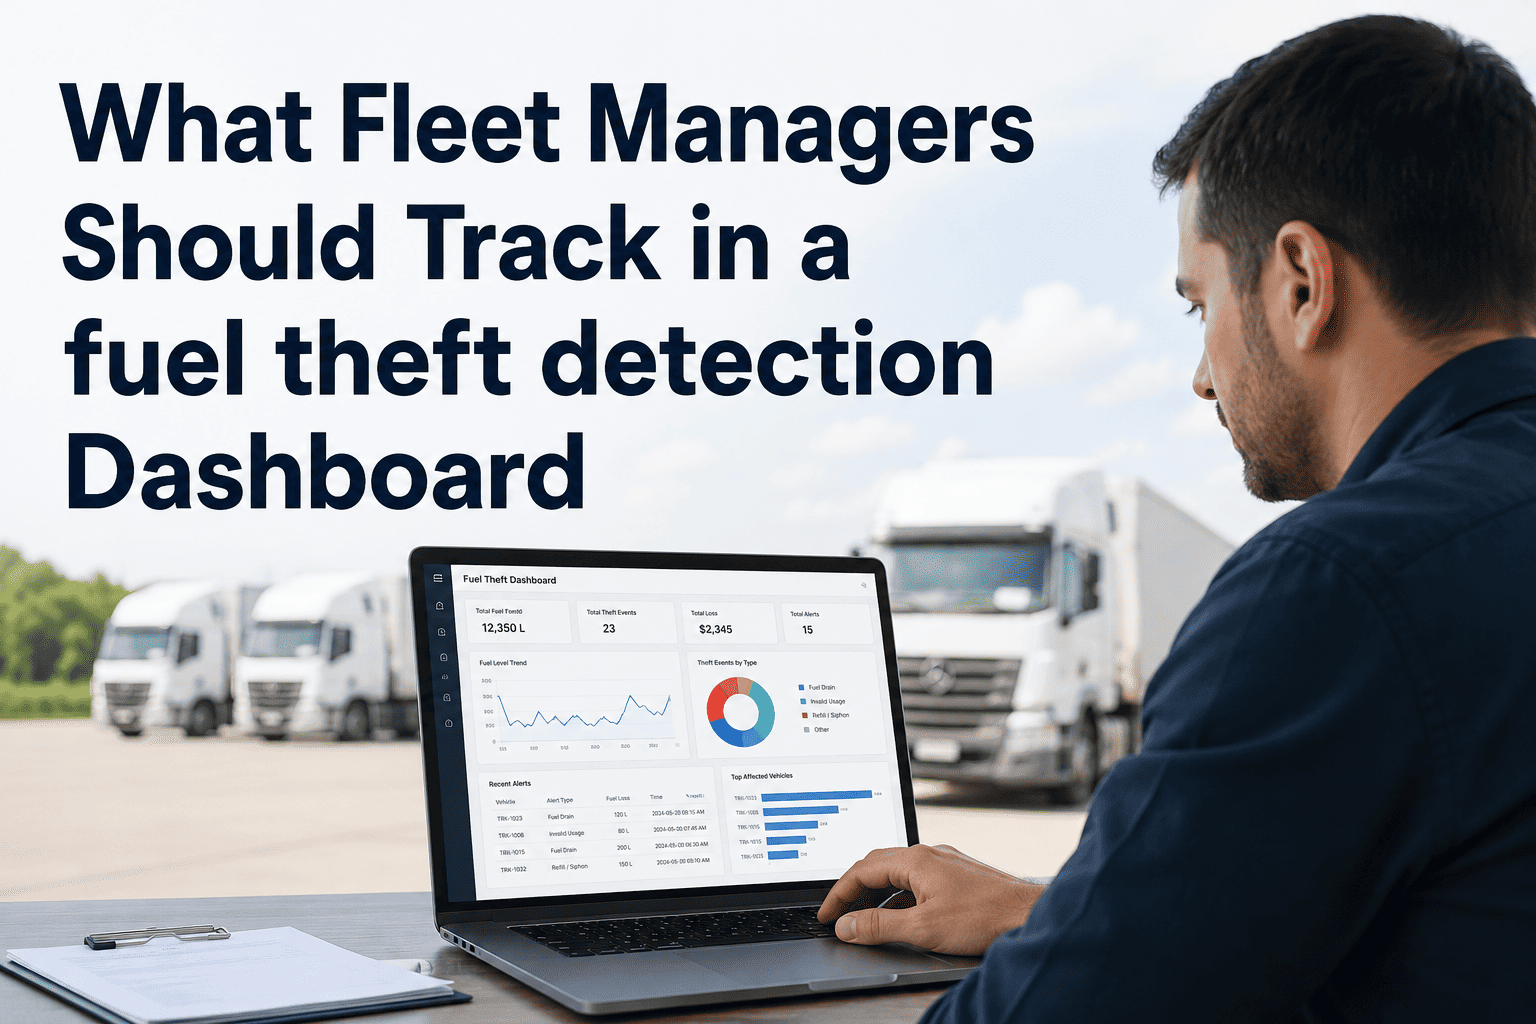
Most fleets already collect fuel data through card transactions, telematics, and fuel sensors — yet almost none of it gets reviewed beyond a monthly total. A single stolen-fuel event or a leaking injector can hide inside thousands of transaction rows for months before anyone notices the pattern. AI fuel analytics changes that by scanning every transaction and every mile in real time, flagging the handful that do not match a vehicle's normal behavior. Fleets sitting on years of unused fuel data are the ones with the most to gain from turning it into an anomaly detection program. OxMaint's fuel analytics module plugs directly into your existing fuel cards and telematics feed to start catching anomalies from week one.
Turn Fuel Data Into Fuel Savings
AI anomaly detection built on top of the fuel data you already collect
15–25%
Fuel spend typically lost to waste, theft, and inefficiency in fleets without active monitoring
3–7%
Average fuel cost reduction achieved in the first 6 months after deploying AI anomaly detection
40+
Data points per fill-up an AI model checks that manual review never touches
24/7
Continuous transaction monitoring, replacing the once-a-month spend report most fleets rely on today
What AI Fuel Analytics Actually Looks For
Manual fuel review usually compares total spend month over month. AI anomaly detection compares every single transaction against that specific vehicle's own learned pattern — catching problems long before they show up in a monthly summary. The workflow below runs continuously in the background, so nobody has to remember to pull a report or open a spreadsheet.
1
Data Ingestion
Fuel card transactions, telematics odometer readings, and tank sensor data are pulled into one continuous timeline per vehicle, closing the gaps between disconnected systems.
2
Baseline Modeling
The model learns each vehicle's normal miles-per-gallon, typical fill locations, fill sizes, and fill frequency across routes, seasons, and driver assignments.
3
Anomaly Scoring
Every new transaction is scored against the baseline — a fill that is too large, too frequent, in the wrong location, or paired with a falling MPG trend gets flagged automatically.
4
Alert & Work Order
High-confidence anomalies route straight into a review queue, and mechanical causes such as a failing injector generate a work order automatically inside your maintenance system.
5
Continuous Re-Learning
Every confirmed alert and every dismissed false positive feeds back into the model, sharpening each vehicle's baseline over time and reducing noise as history builds up.
Manual Review vs. AI Fuel Analytics
Six Anomaly Patterns Worth Automating
Card Skimming & Siphoning
Fills that exceed tank capacity, occur outside route hours, or happen at a location the vehicle never visits get flagged within one transaction cycle.
Excessive Idling
Telematics-linked idling hours are cross-checked against fuel burn, isolating vehicles quietly wasting fuel while parked or waiting.
Route Deviation Waste
Unplanned detours that add mileage without a matching delivery stop are surfaced so dispatch can correct the pattern before it repeats.
Mechanical MPG Drift
A gradual decline in miles-per-gallon on one vehicle — often the earliest sign of a clogged filter or failing sensor — triggers a maintenance work order.
Odometer & Mileage Mismatch
A fill-up logged against an odometer reading that does not fit the vehicle's travel history points to a data entry error or a card used on the wrong vehicle.
Seasonal Consumption Shift
Cold-weather idling and summer AC load are factored into the baseline so a normal seasonal increase does not get mistaken for waste.
Stop Reviewing Fuel Spend a Month Late
OxMaint scores every fuel transaction the day it happens and routes mechanical anomalies straight into a work order — no spreadsheet required.
100%
of transactions scored, not sampled
Same-day
alert delivery on high-confidence anomalies
Auto
work order creation for mechanical causes
2–3 wks
to establish a reliable per-vehicle baseline
We had been staring at fuel reports for years without seeing the pattern. Within the first month of running anomaly detection, we found two vehicles with fuel cards being used outside their routes and one truck with a slow MPG decline that turned out to be a failing fuel injector.
— Fleet Operations Manager, 210-vehicle regional delivery fleet
Getting Fuel Analytics Live in Your Fleet
Most fleets are up and running faster than expected because the program uses data that already exists — there is no new hardware order or install schedule standing between you and the first alert.
1
Connect Your Data Sources
Fuel card provider and telematics platform are linked through existing integrations, typically completed in a single onboarding session.
2
Let the Baseline Build
The model observes 2–3 weeks of normal activity per vehicle before scoring begins, avoiding false alerts based on incomplete history.
3
Review the First Alerts Together
An onboarding specialist walks your team through the first batch of flagged anomalies to calibrate sensitivity to your fleet's real-world patterns.
Frequently Asked Questions
Do we need new hardware to run AI fuel analytics?
No. AI fuel analytics works with the fuel card and telematics data most fleets already collect.
OxMaint connects to existing feeds rather than requiring new sensors or hardware installs.
How long before the model produces reliable alerts?
Most fleets see a usable per-vehicle baseline within 2–3 weeks of connecting data, with alert accuracy improving steadily as more history accumulates.
Can this replace a dedicated fuel card fraud team?
It removes the manual review workload, but a small team should still confirm flagged transactions before action is taken. Most fleets reduce review time by over 80% while keeping a human in the loop for final decisions on flagged cases.
Does it integrate with maintenance scheduling?
Yes. When an anomaly points to a mechanical cause, the system can generate a work order directly, keeping fuel analytics and maintenance in one workflow instead of two disconnected systems your team has to check separately.
What is the fastest way to see this in action?
Book a walkthrough with your own fuel data —
schedule a demo and see anomalies surfaced from a real transaction file.
Your Fuel Data Already Has the Answers
Connect your fuel cards and telematics feed and let AI find what manual review has been missing.