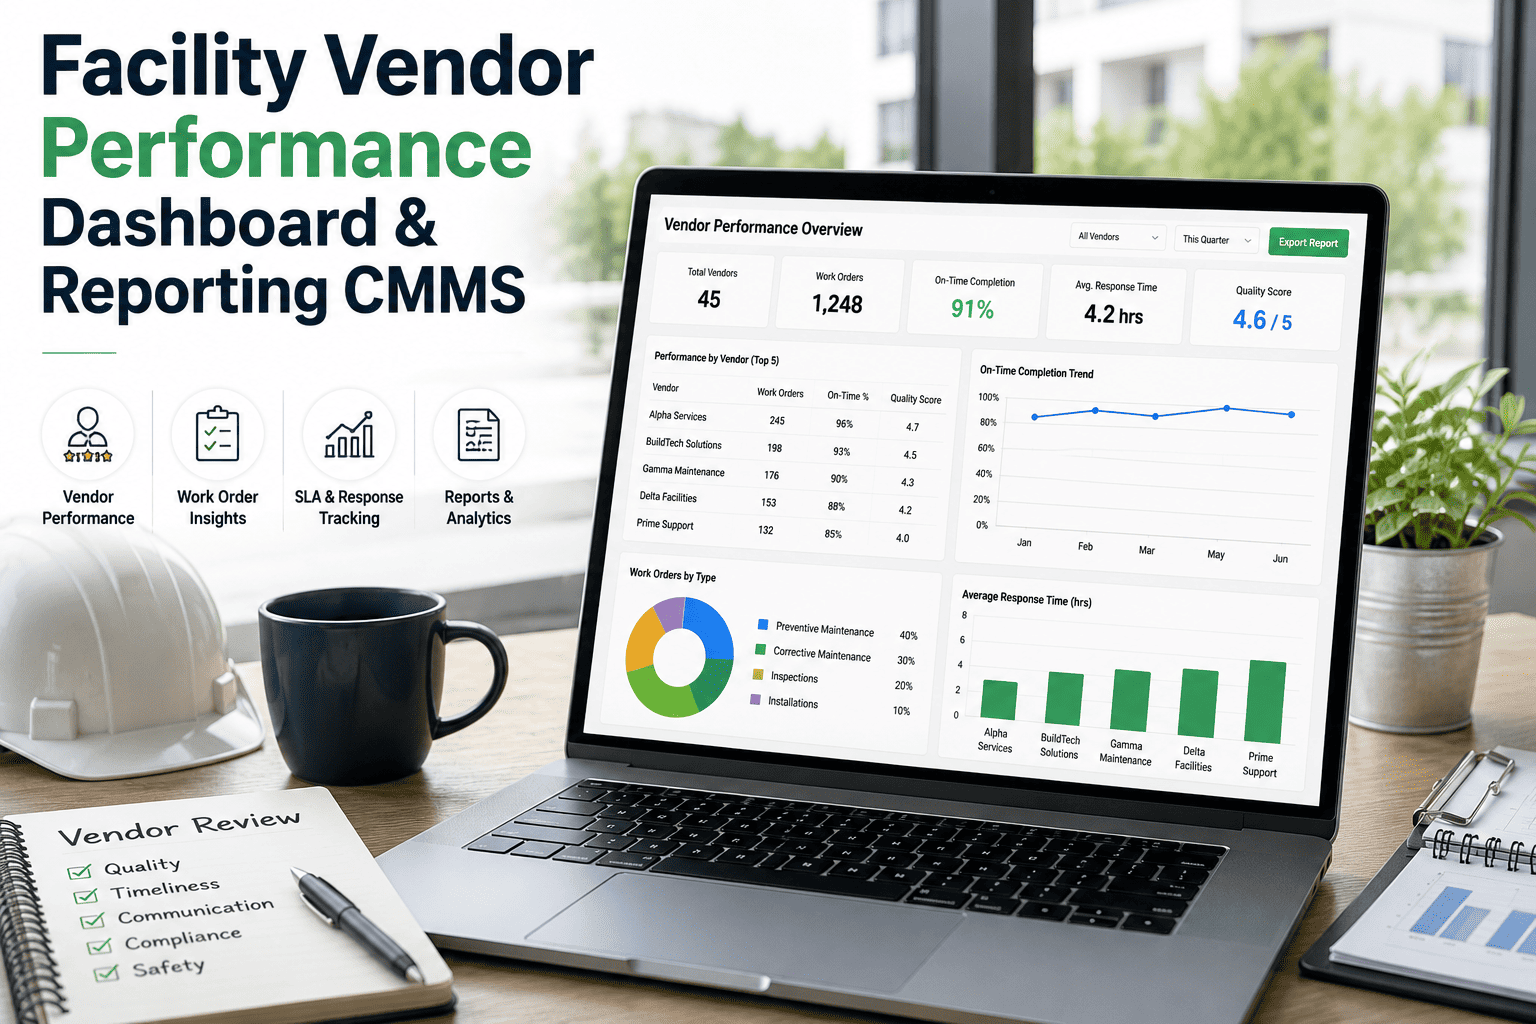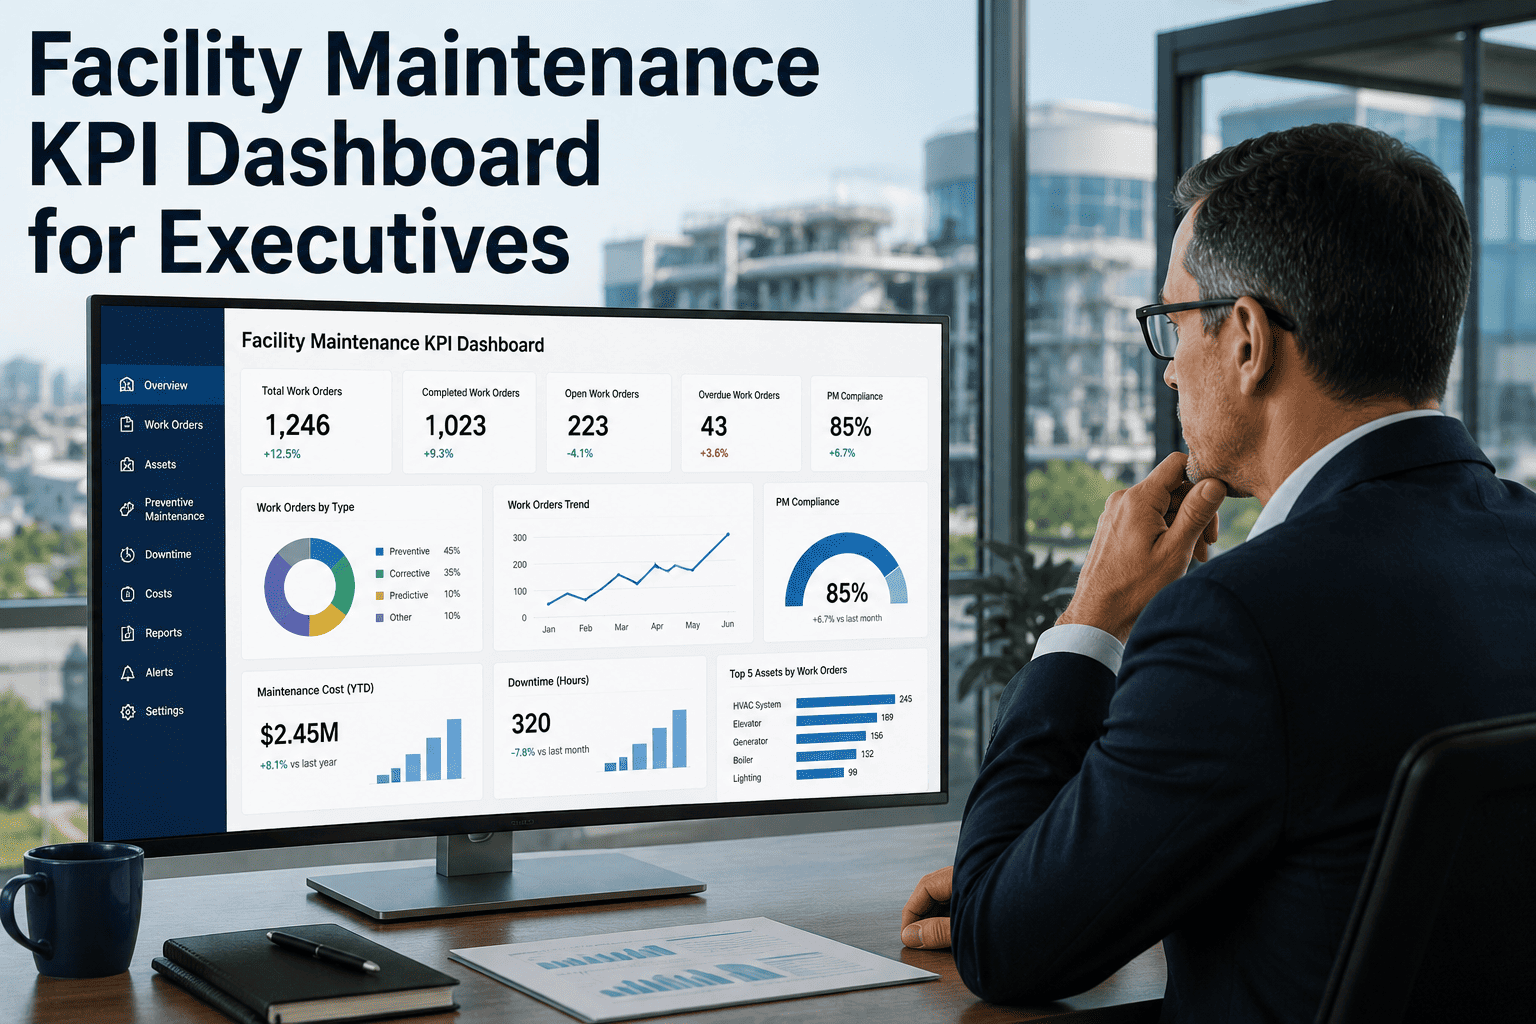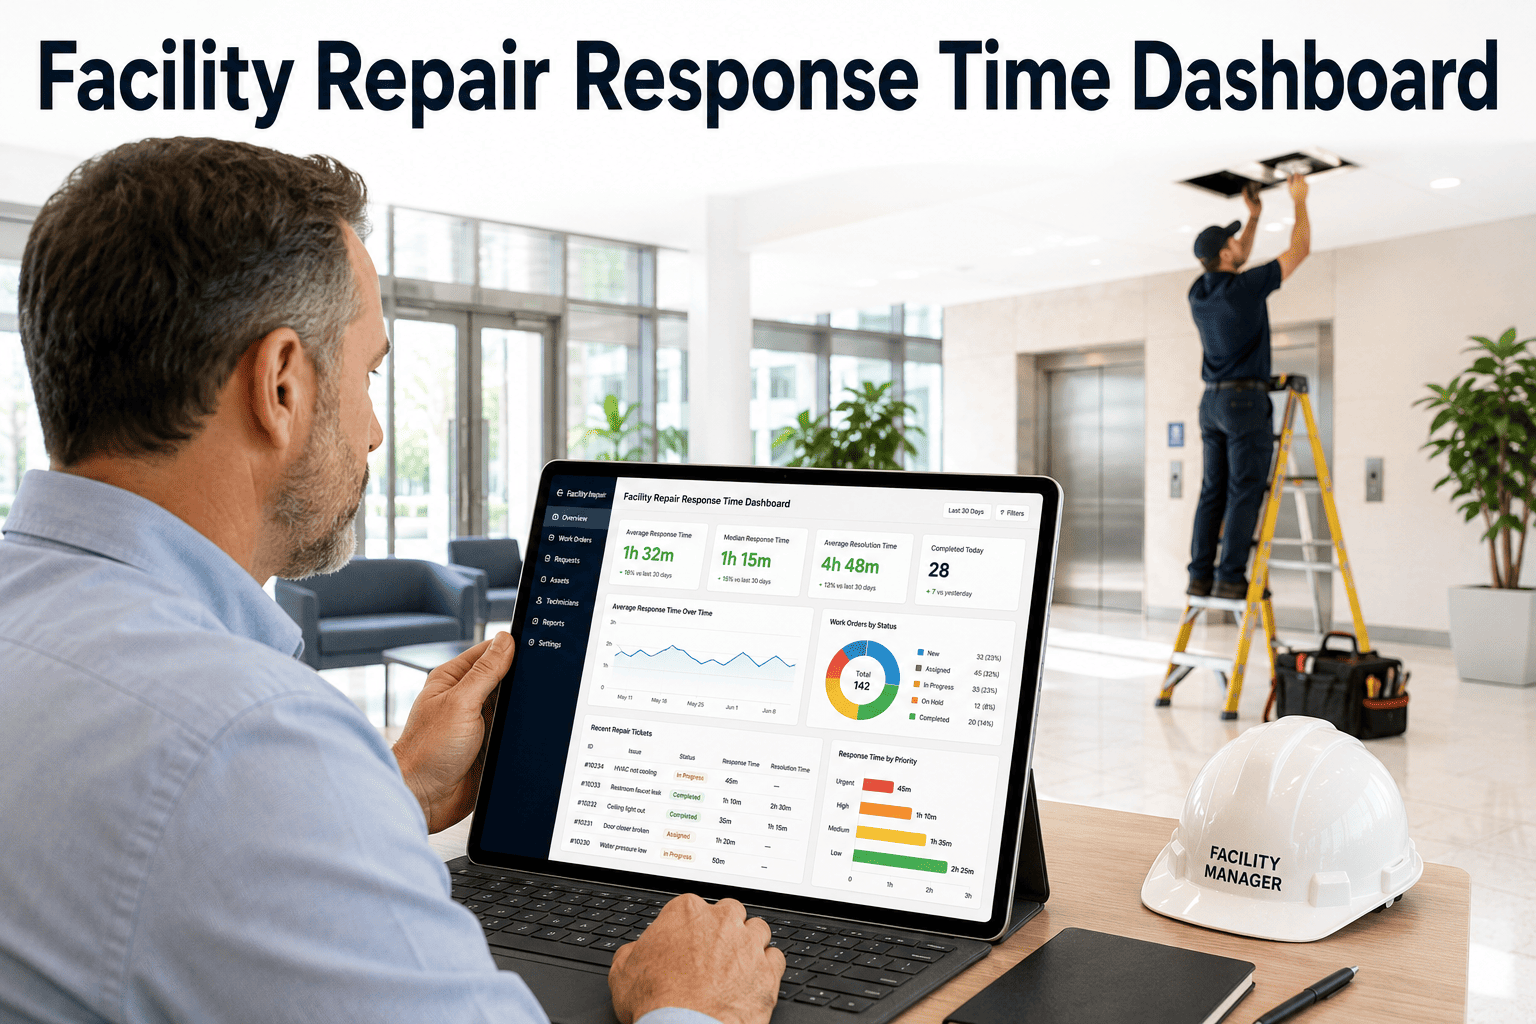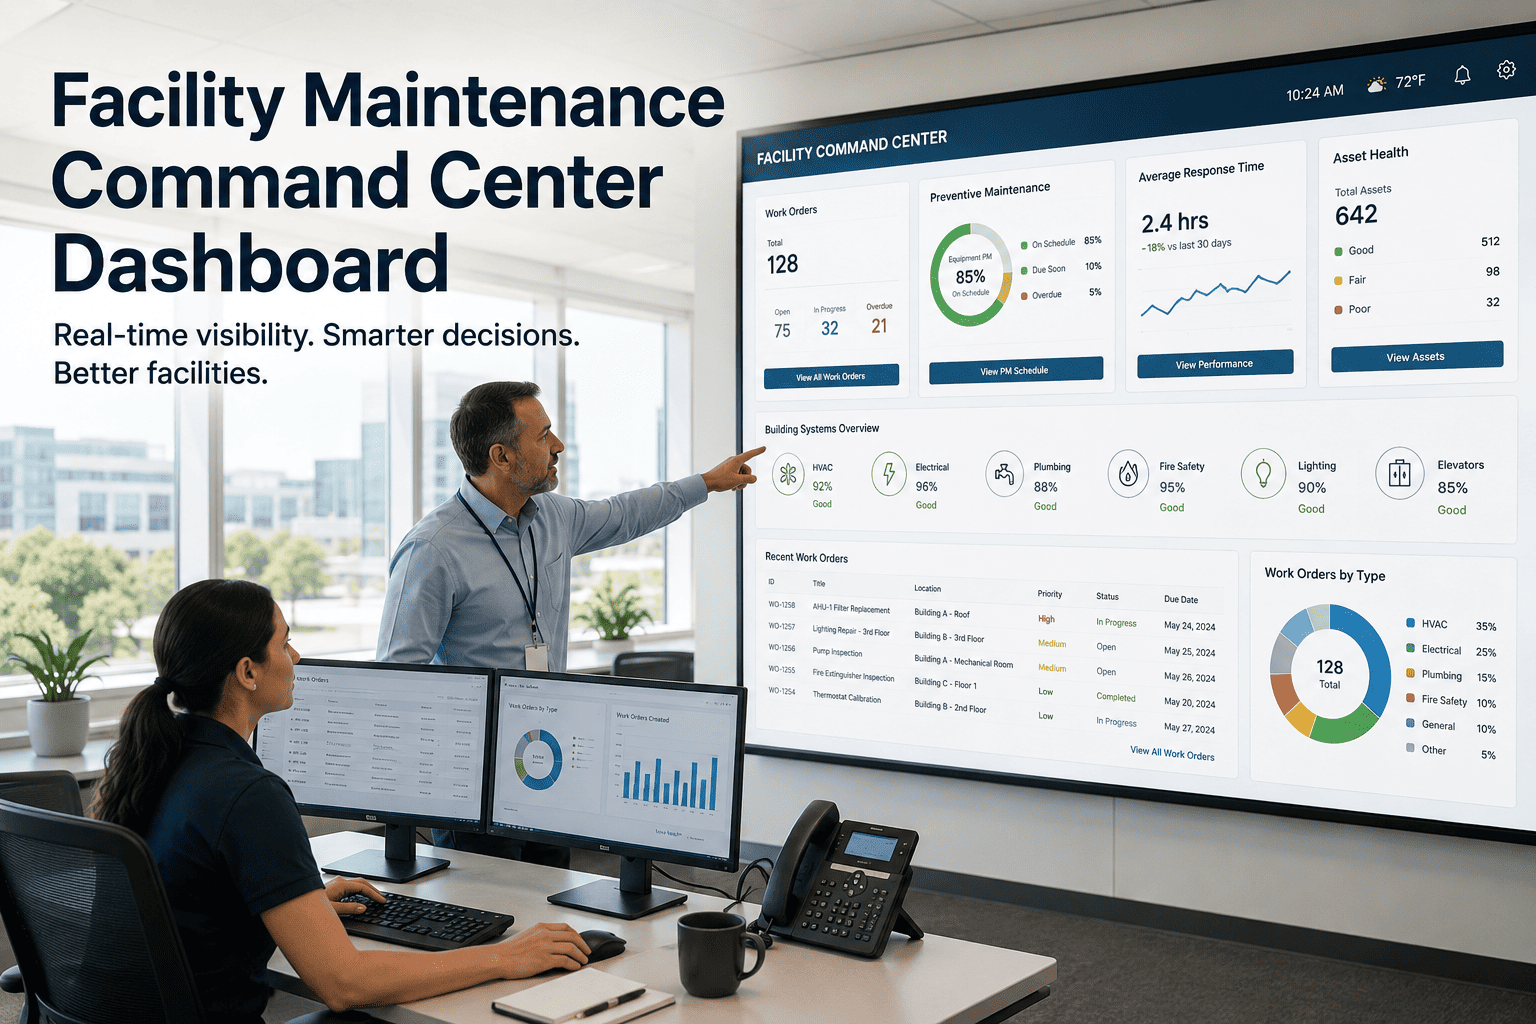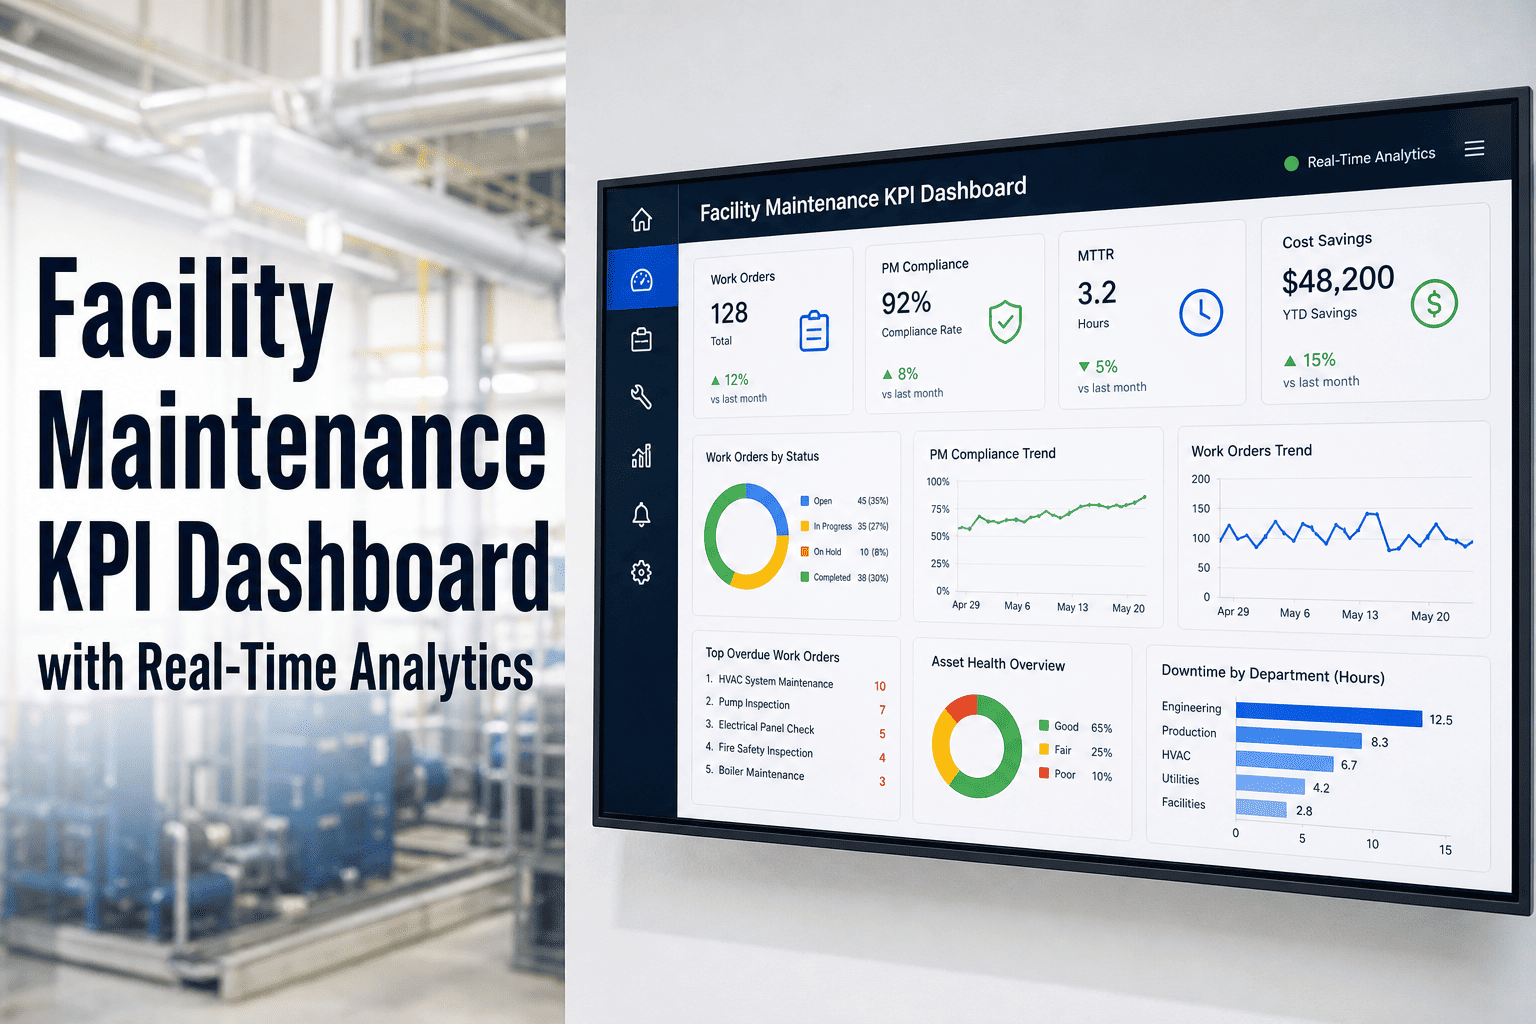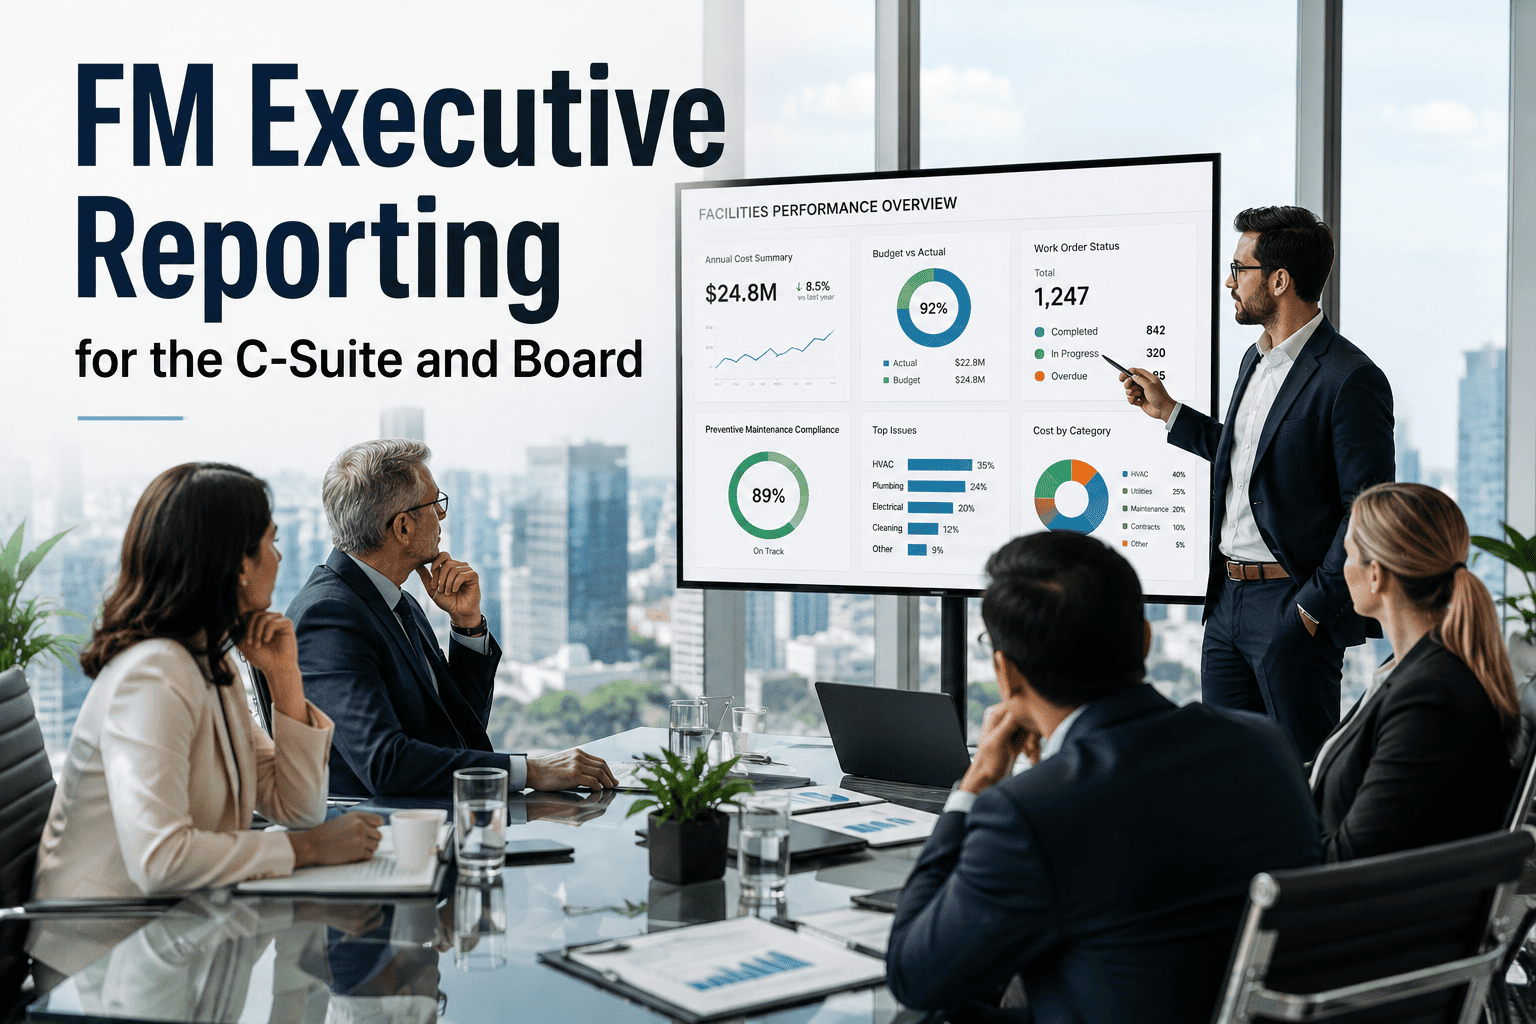
FM executive reporting for the C-suite and board is where facility management either earns strategic recognition or stays pigeonholed as an operational cost center. When executives and board members review facility performance, they don't want raw work order counts or technician logs—they want clear answers on cost containment, compliance risk, capital planning, and asset value. Building a facility executive dashboard that translates maintenance data into business intelligence is the key to securing budget alignment and leadership buy-in. By shifting your FM leadership reporting from operational metrics to strategic narratives, you can demonstrate measurable ROI and position your team as a critical driver of enterprise resilience. Ready to upgrade your reporting? You can Start Free Trial or book a personalized walkthrough to see the difference.
FM EXECUTIVE REPORTING
Is your FM board reporting answering the questions leadership actually asks?
Most facility C-suite reporting drowning in operational data misses the strategic mark. Transform your maintenance metrics into a high-impact facility executive dashboard that drives budget approval, reduces risk, and proves ROI.
THE STATUS QUO GAP
Why most facility management executive reporting fails at the C-suite level
A facility manager might proudly report that 4,200 work orders were completed last quarter at a 94% on-time rate. The CFO hears a cost center. The board hears operational noise. The disconnect happens because operational metrics and strategic metrics are not the same thing.
Reporting on CMMS data like work order completion rates, mean time to repair (MTTR), and backlog volume without translating them into dollars, risk exposure, or capital impact.
Framing that same data as: "A 94% PM completion rate avoided $180K in reactive repair costs and extended three critical asset lifecycles by 4 years, delaying a $2.5M capex request."
FM EXECUTIVE DASHBOARD METRICS
What belongs on a facility board dashboard: 6 strategic KPIs
The right facility executive metrics bridge the gap between the maintenance floor and the boardroom. Select KPIs that tie directly to the organization's financial health, risk profile, and operational continuity. Here are the six pillars of effective FM C-suite reporting:
Maintenance Cost as % of Asset Replacement Value (RAV)
Benchmarking your annual maintenance spend against total asset value. A world-class target is 1.5%–3% of RAV, proving efficient stewardship of physical capital to the board.
Deferred Maintenance Backlog (in Dollars)
Quantifying the financial liability of postponed maintenance. Essential for capital planning and communicating the risk of aging infrastructure to senior leadership.
Compliance & Audit Readiness Score
Tracking adherence to OSHA, EPA, ISO 55000, and internal safety standards. High compliance rates minimize legal risk and prevent costly regulatory fines.
Asset Downtime Cost & Revenue Impact
Translating equipment downtime into lost production dollars. This metric directly aligns FM performance with revenue generation and operational continuity.
Energy & Utility Spend Variance
Comparing actual utility costs against budgeted baselines. Essential for ESG reporting and demonstrating the financial impact of facility sustainability initiatives.
Work Order Cycle Time to Cost Ratio
Measuring the efficiency of maintenance execution. Lower cycle times at optimized labor costs indicate a high-performing, well-resourced maintenance operation.
BUILDING THE NARRATIVE
How to structure a high-impact FM board presentation
A facility board presentation should never exceed 10 slides. Executives need a narrative that moves from current state to financial impact, followed by actionable requests. Follow this four-step reporting cadence to build a compelling case for facility investment.
State the Business Context
Open with a one-sentence summary of facility health tied to enterprise goals. Example: "Facility uptime supported $4.2M in Q3 production, but aging HVAC systems pose a 15% risk of critical failure in Q4."
Quantify Risk & Cost of Inaction
Show the financial exposure. Use your facility executive dashboard to highlight the cost of deferred maintenance, potential regulatory fines, and lost revenue from unplanned downtime.
Demonstrate FM Value & ROI
Highlight recent wins. Showcase how preventive maintenance extended an asset's lifecycle by 3 years, saving $500K in immediate capital expenditure. Tie PM compliance directly to cost avoidance.
Define Capital & Resource Needs
End with clear, data-backed requests. Whether it's a $150K CMMS upgrade or a $1.2M boiler replacement, justify the ask by showing the exact ROI, payback period, and risk mitigation.
Stop translating spreadsheets. Start presenting strategic facility intelligence.
See how OxMaint automatically transforms your work orders and asset data into board-ready executive dashboards.
FM REPORTING METRICS FORMULA
How to calculate facility executive metrics that command respect
If you cannot formulaically prove the financial impact of your maintenance operations, your budget will be the first to be cut. Use these standard calculations in your FM leadership reporting to speak the language of the CFO.
Maintenance Cost to RAV Ratio
Example: A $5M maintenance spend on a $200M asset portfolio yields a 2.5% ratio—a world-class benchmark indicating highly efficient capital stewardship.
Cost Avoidance via PM Compliance
Example: If a reactive fix costs $12K, but PM costs $1.5K, and you prevented failure on 40 assets, you saved $420K in hard costs that quarter.
| Reporting Metric | Operational Data (Status Quo) | Strategic FM Reporting (Board-Level) |
|---|---|---|
| Asset Performance | 92% PM Completion Rate | Extended asset lifecycle by 4 years; deferred $1.2M in capex. |
| Downtime Tracking | 15 hours of downtime this month | Prevented $85K in lost production revenue via predictive alerts. |
| Inventory Management | $120K in spare parts inventory | Reduced carrying costs by 18% while maintaining 99% parts availability. |
| Labor Efficiency | 1,200 labor hours logged | Wrench time improved to 55%, saving $30K in overtime costs. |
HOW OXMAINT HELPS
Turn maintenance data into automated C-suite intelligence
OxMaint eliminates the manual data aggregation and spreadsheet translation that bogs down FM senior leadership reporting. By connecting your work orders, assets, and inventory to an AI-powered analytics engine, OxMaint automatically generates the facility executive dashboard your leadership team needs to see.
Automated Executive Dashboards
Pre-built, customizable widgets instantly visualize cost-to-RAV, downtime impact, and PM compliance—no manual Excel exports required. Cut reporting time by 80% and present real-time facility board metrics.
AI-Powered Risk & Cost Forecasting
Predict which critical assets will fail in the next 90 days. OxMaint calculates the financial impact of inaction, giving you the exact data needed to justify capital requests and mitigate enterprise risk.
One-Click Board Presentation Exports
Generate polished, audit-ready PDF and PowerPoint reports directly from your dashboard. Transform raw EAM data into a compelling narrative for your next facility board presentation in seconds.
Real-Time ROI & Compliance Tracking
Continuously track cost avoidance, capital expenditure deferral, and compliance adherence. Prove the ongoing financial value of your facility management operations to the C-suite at any moment.
Real-World Scenario: A 180-asset manufacturing plant spending $42K/yr on reactive maintenance deployed OxMaint's predictive analytics. By shifting to a proactive model and presenting the automated facility C-suite dashboard to their board, they secured a $120K infrastructure budget, cut unplanned downtime by 35%, and avoided $190K in potential equipment replacement costs within the first year.
FREQUENTLY ASKED QUESTIONS
Common questions about FM executive reporting
What is FM executive reporting?
FM executive reporting is the practice of translating operational facility and maintenance data into strategic business intelligence for C-suite executives and board members. Instead of focusing on granular work order counts, it highlights financial metrics like cost avoidance, risk exposure, compliance, and capital planning to drive enterprise decision-making.
How often should you present a facility board dashboard?
A facility board dashboard should typically be presented quarterly, aligned with financial reporting cycles. However, the underlying data should be updated in real-time so that executives can access live metrics on demand. You can see how automated live dashboards work by booking a demo at Calendly.
What is the most important metric for facility leadership reporting?
The most important metric is Maintenance Cost as a Percentage of Replacement Asset Value (RAV). This allows executives to benchmark facility stewardship against industry standards (typically 1.5%–3%), directly tying maintenance spend to the total financial value of the organization's physical assets.
How does a CMMS improve FM C-suite reporting?
An AI-powered CMMS like OxMaint automates the collection of work order, asset, and inventory data, instantly converting it into financial metrics and visual dashboards. This eliminates manual spreadsheet errors, saves dozens of reporting hours, and provides real-time ROI tracking. Start your Start Free Trial to experience automated reporting.
What is the difference between operational and strategic FM reporting?
Operational reporting focuses on the execution of maintenance tasks—such as MTTR, wrench time, and work order backlog. Strategic FM reporting translates those data points into business outcomes, showing how maintenance impacts revenue, risk, capital expenditure, and regulatory compliance for the C-suite and board.
PROVE YOUR FACILITY VALUE
Ready to build an FM executive dashboard that commands board respect?
Join leading maintenance teams using OxMaint to transform operational data into strategic intelligence that secures budgets and drives enterprise value.
Free 14-day trial · No credit card required