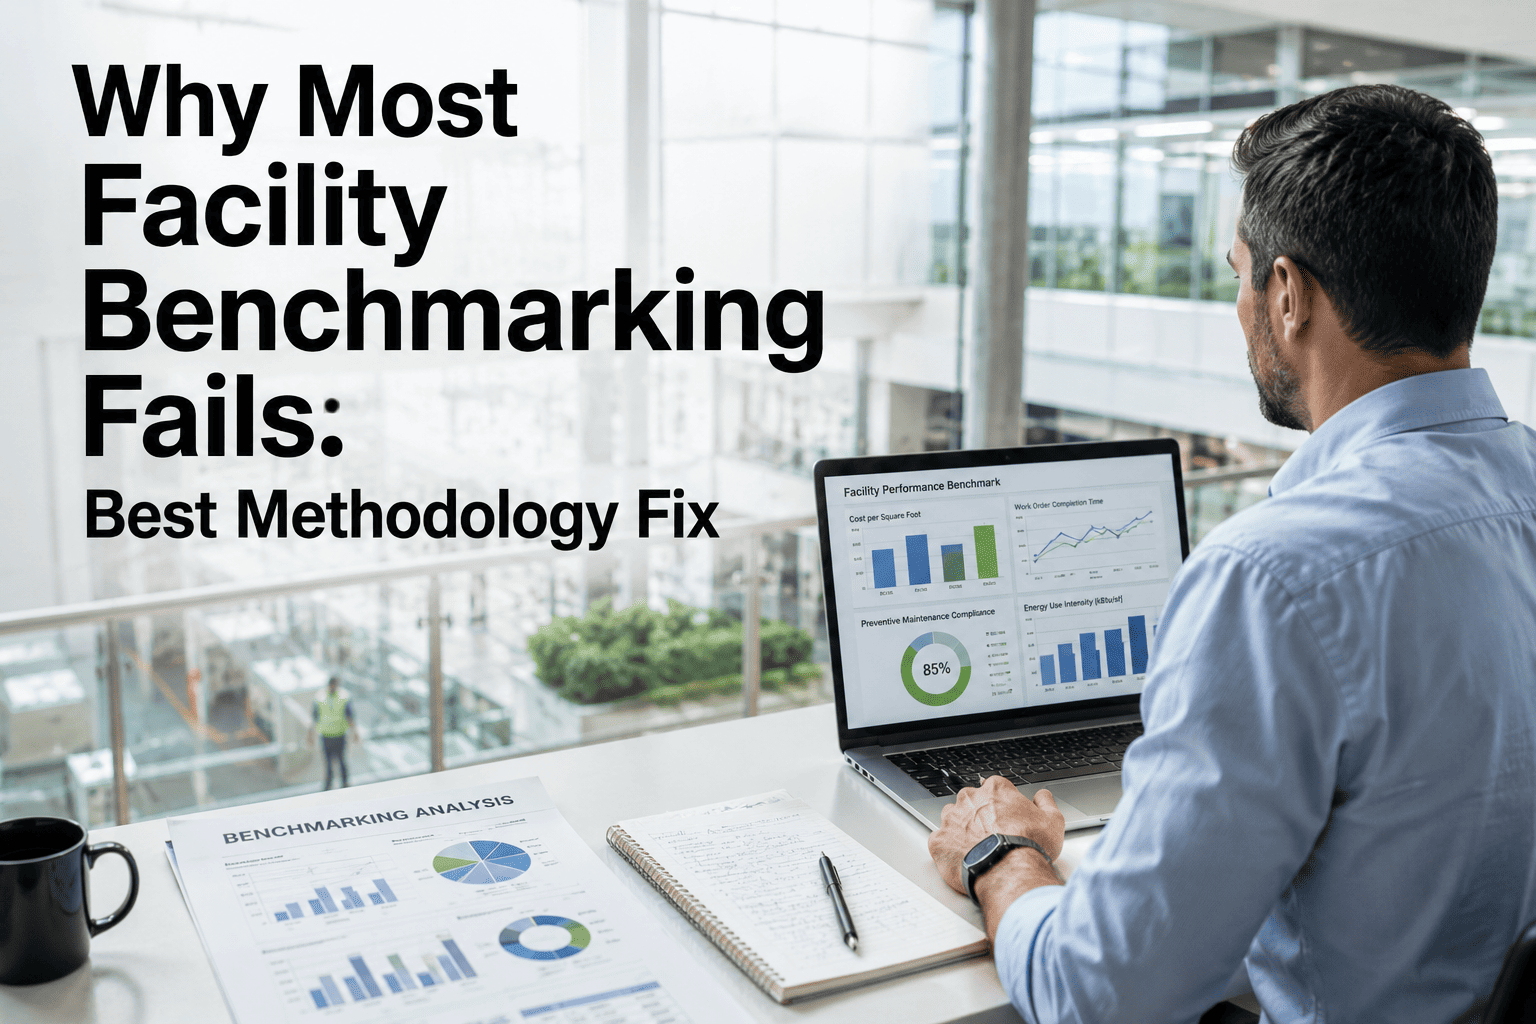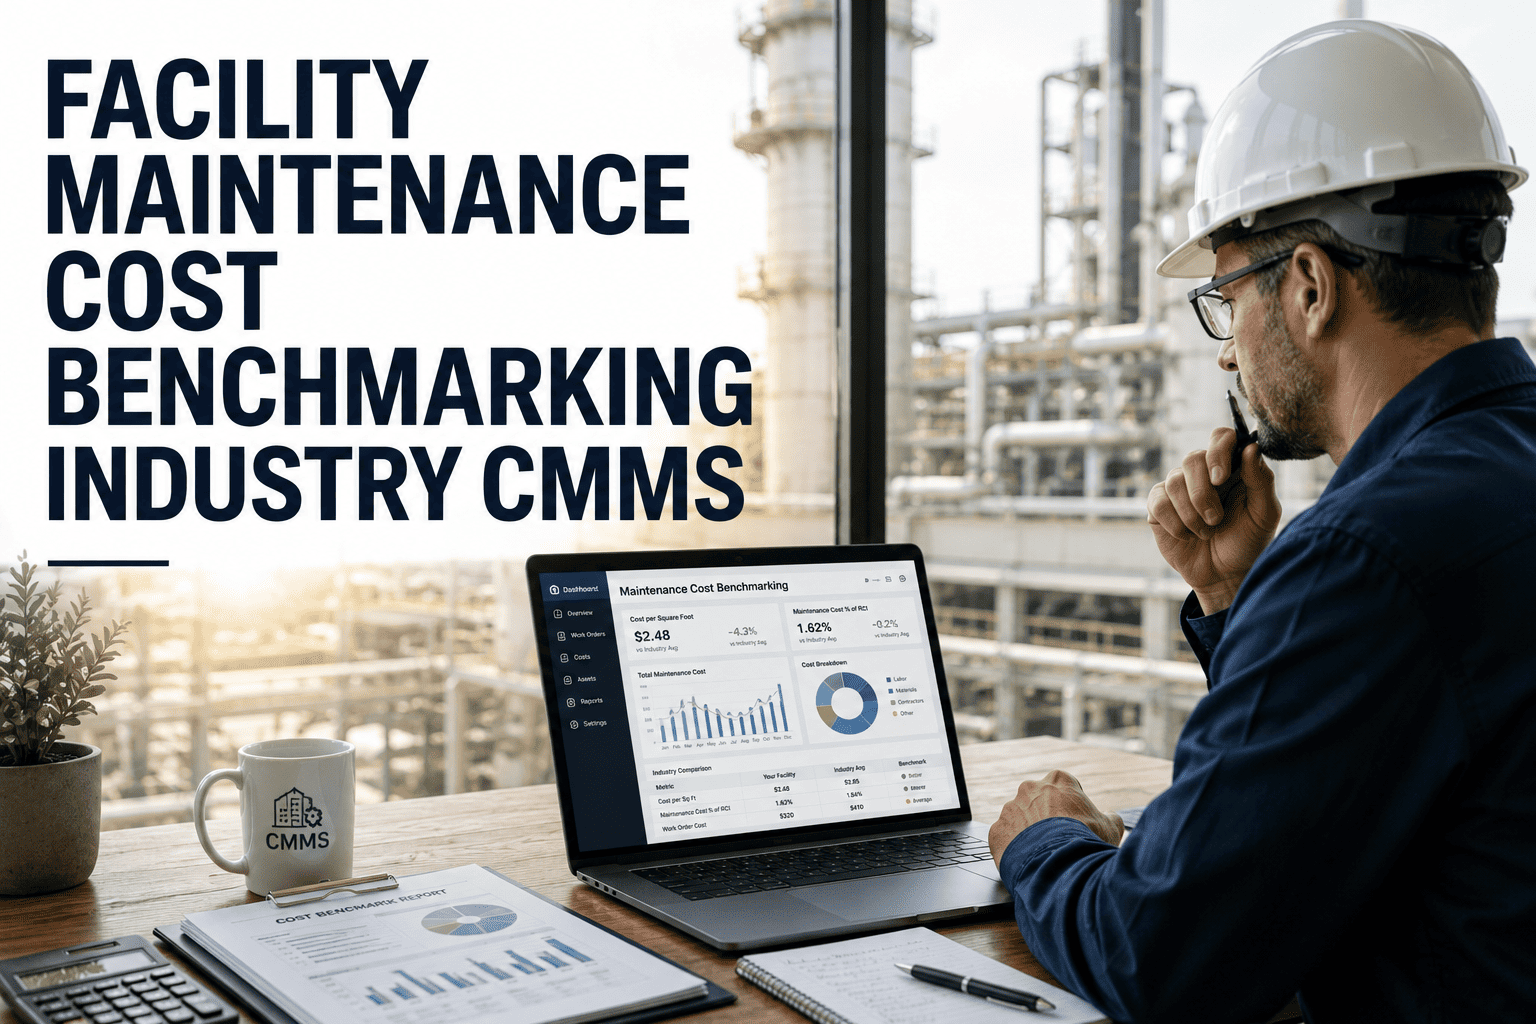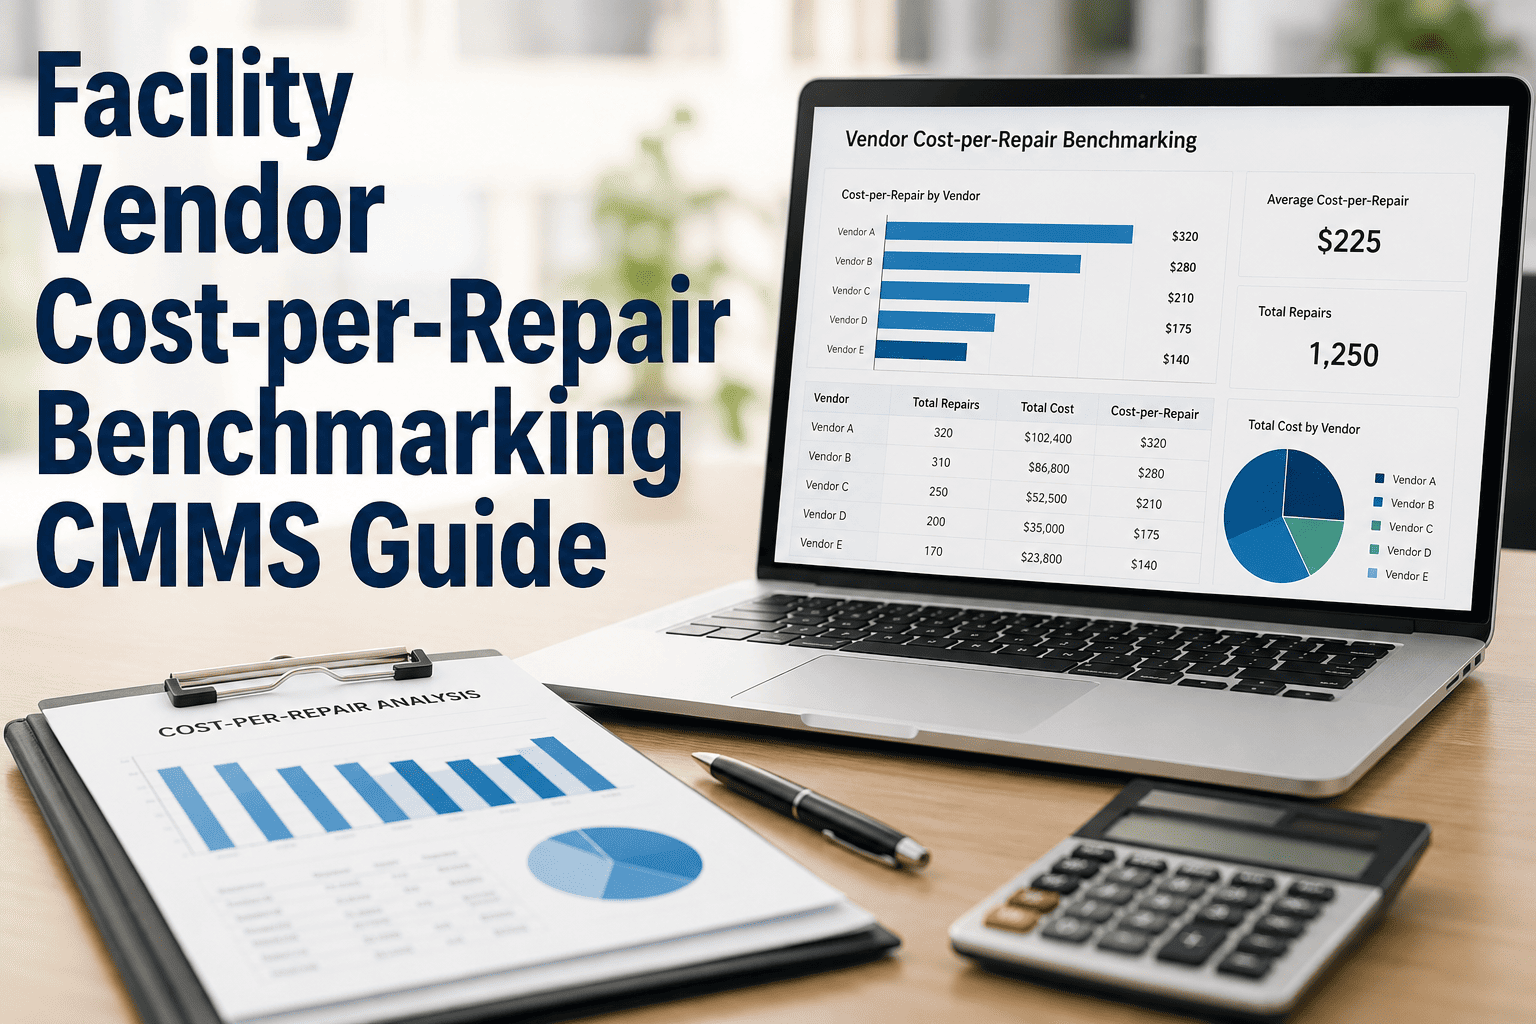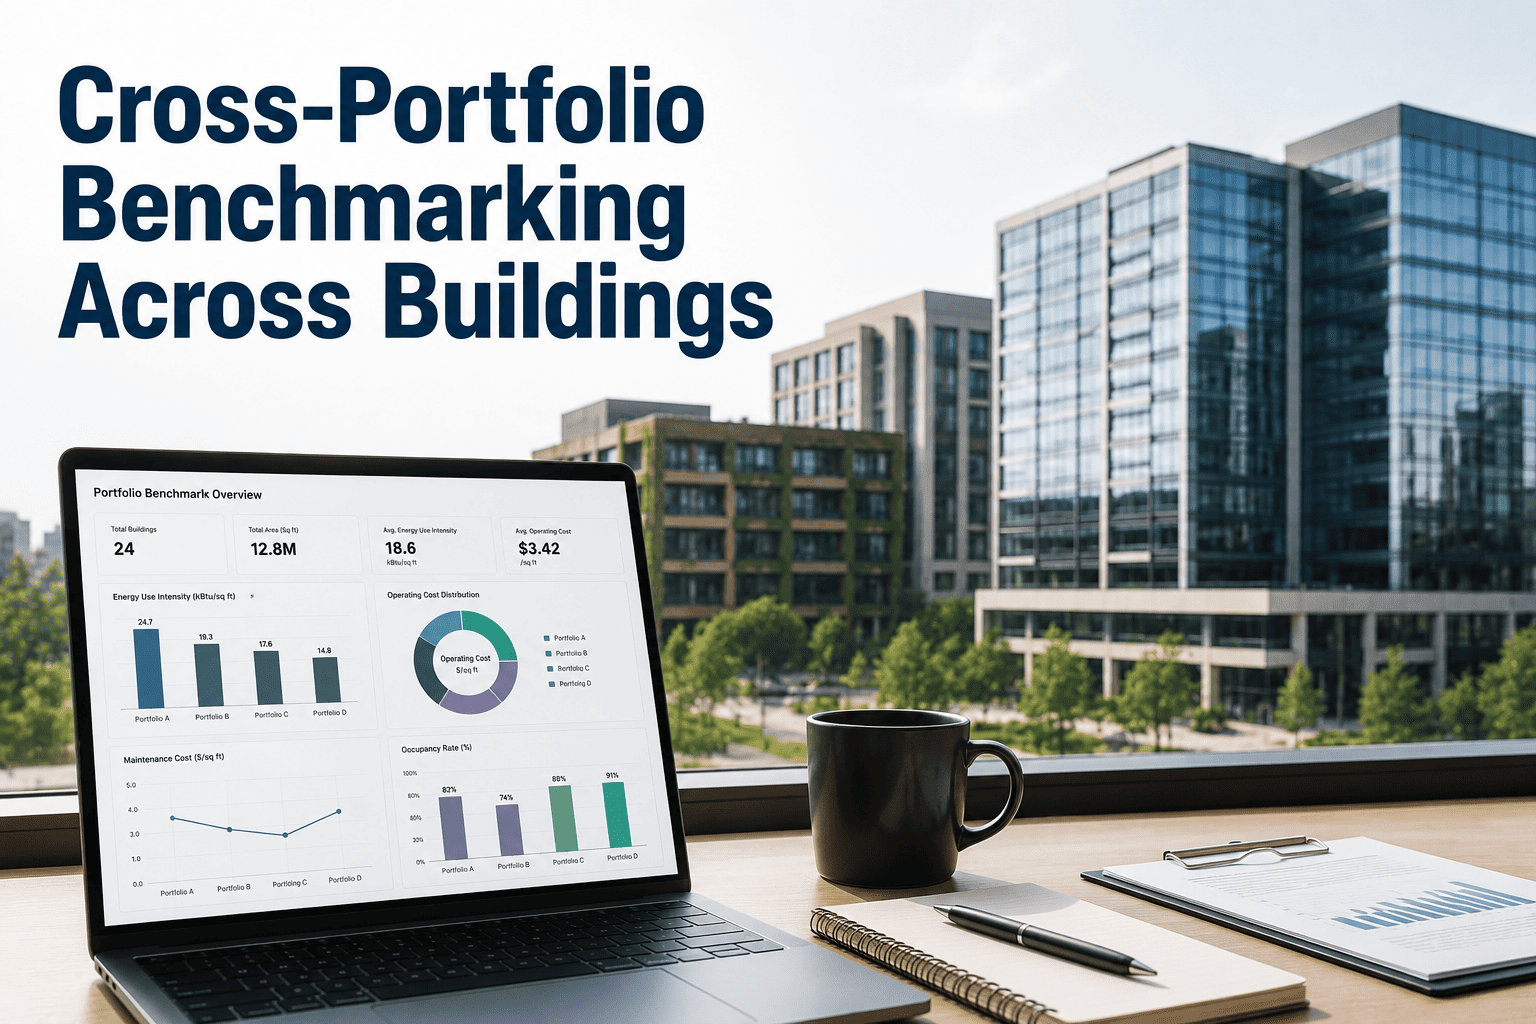
Cross-portfolio benchmarking across buildings is the process of normalizing and comparing maintenance, energy and asset-performance data across every site in an FM portfolio to find the quiet underperformers — before finance does. Done right, FM portfolio benchmarking turns scattered work-order logs and meter readings into apples-to-apples facility cross site benchmarking, exposing the 15–30 percent cost gap between your best and worst buildings. This guide covers the methodology, normalization formulas and benchmarking discipline that convert multi building benchmarking data into portfolio-wide improvement action. Ready to stop guessing and start benchmarking? Start Free Trial with OxMaint today.
FM Portfolio Benchmarking
Which of your buildings is quietly burning cash?
Cross-portfolio benchmarking exposes the outliers your averages hide. Normalize cost, energy and downtime data across every site to see exactly where to act — and prove it to the board.
The Benchmarking Gap
Why 74% of FM portfolios fly blind on cross-building performance
Most facility teams track KPIs per building but never compare them. Without portfolio building comparison, a site spending 2.3× more on HVAC maintenance than its peers blends into an average that looks acceptable — while quietly draining $180K+ per year.
Methodology
How to build an apples-to-apples facility portfolio benchmark
Building benchmark comparison only works when you normalize. Comparing raw dollars across a 12,000 ft² warehouse and a 120,000 ft² hospital produces noise, not insight. Here is the four-step normalization discipline.
Define the scope and asset classes
Group buildings by typology — office, lab, warehouse, retail, healthcare. Benchmarking a Class A office against a logistics depot yields false outliers. Align asset hierarchies so HVAC, electrical and fabric costs roll up identically.
Normalize the data
Convert every metric to a per-unit basis: cost per ft², energy kWh per m², work orders per asset, downtime hours per 1,000 occupants. Apply climate-degree-day adjustments so a Phoenix campus isn't penalized against a Seattle one.
Calculate quartiles and outliers
Rank each building within its peer group. Flag anything above the 75th percentile (cost) or below the 25th percentile (performance) as an investigation target. The interquartile range filters out one-off anomalies.
Investigate, act and re-benchmark
Drill into the outlier's work-order history, PM compliance and asset condition. Deploy a corrective plan, then re-benchmark quarterly. A benchmark without a follow-up action is just a vanity chart.
Worked Example
FM portfolio comparison in action: a 14-building scenario
A regional FM team manages 14 mixed-use buildings averaging 45,000 ft² each. Annual maintenance spend looks normal at $3.2M. After cross-portfolio benchmarking, a very different picture emerges.
Normalization Formula — Cost per ft²
| Building | Size (ft²) | Annual FM Spend | Cost / ft² | PM Compliance | Flag |
|---|---|---|---|---|---|
| HQ Tower | 62,000 | $198,400 | $3.20 | 92% | Top quartile |
| Westport Warehouse | 48,000 | $122,400 | $2.55 | 88% | On benchmark |
| Riverside Office Park | 41,000 | $176,300 | $4.30 | 54% | Bottom quartile |
| Central Lab | 29,000 | $93,500 | $3.22 | 90% | On benchmark |
| Northgate Retail | 55,000 | $253,000 | $4.60 | 49% | Bottom quartile |
Two buildings — Riverside and Northgate — sit 44 percent above the portfolio median cost per ft² while running PM compliance below 55 percent. That combination signals deferred preventive work converting into expensive reactive failures. Closing the gap to the median saves an estimated $94,600 per year across just those two sites.
Key Metrics
The six KPIs that make building performance benchmarking portfolios work
Robust facility benchmarking portfolio analysis rests on a core set of comparable metrics. Track these six and you cover cost, reliability, energy and compliance in one view.
Maintenance Cost per ft²
Total labor + parts + contractor spend divided by floor area. The foundational cross-building cost metric.
PM Compliance Rate
Percentage of scheduled preventive work orders completed on time. Below 70 percent is a leading indicator of future cost spikes.
Energy Use Intensity (EUI)
kWh per m² per year, climate-normalized. Isolates buildings where HVAC controls or envelope issues drive waste.
Mean Time Between Failures
MTBF by asset class. A low MTBF on one campus vs peers points to aging assets or poor PM execution.
Reactive vs Preventive Ratio
Ideal ratio is 20:80. Buildings above 50 percent reactive are bleeding budget and headed for downtime events.
Work Order Backlog Age
Average days open. Backlog over 14 days signals staffing gaps, prioritization failure or parts shortages at that site.
The OxMaint Advantage
How OxMaint automates cross-portfolio benchmarking across buildings
Spreadsheets and siloed CMMS instances make FM cross building benchmarking a quarterly fire-drill. OxMaint unifies every site's work orders, assets, meters and inventory into a single AI-powered EAM — so benchmarking runs live, not retroactively.
Unified portfolio dashboard
Every building's cost, compliance and downtime KPIs auto-normalize and roll up into one live view — no manual spreadsheet consolidation. Spot outliers in seconds, not weeks.
AI outlier detection
OxMaint's engine continuously compares buildings against peer quartiles and flags drift before it becomes a budget problem — cutting outlier identification time by up to 90 percent.
Standardized asset hierarchy
Enforce a consistent asset taxonomy across all sites so HVAC-A in Building 7 compares cleanly to HVAC-A in Building 12. Eliminates the data-mapping tax that kills most benchmarking projects.
Automated corrective work orders
When a benchmark flags an underperforming site, OxMaint auto-generates and dispatches corrective PMs — closing the loop from insight to action in minutes, cutting unplanned downtime 30–50 percent.
See exactly which buildings underperform — on a live demo
Book a 30-minute walkthrough and we'll load your portfolio data into OxMaint to show you the outliers your current reports miss.
Common Questions
FM portfolio benchmarking FAQs
What is cross-portfolio benchmarking in facility management?
Cross-portfolio benchmarking is the practice of normalizing maintenance, energy and reliability data across multiple buildings in an FM portfolio and comparing them on a like-for-like basis — cost per ft², PM compliance, EUI — to identify which sites over- or under-perform their peers. The goal is to turn that comparison into targeted improvement actions.
How do you normalize data for multi building benchmarking?
Normalize by converting raw figures into per-unit metrics: cost per ft², kWh per m², work orders per asset. Then adjust for external variables like climate degree-days, occupancy hours and building typology so a warehouse isn't compared directly against a lab. Standardizing your asset hierarchy in a platform like OxMaint ensures the underlying data maps cleanly across sites.
What KPIs should a facility benchmarking portfolio track?
The core set is maintenance cost per ft², PM compliance rate, reactive-to-preventive ratio, energy use intensity (EUI), mean time between failures (MTBF) and work-order backlog age. Together these cover cost efficiency, reliability, energy performance and operational responsiveness in one comparable view.
How often should we run a portfolio building comparison?
At minimum, benchmark quarterly. Monthly is better for energy and reactive-maintenance metrics because they drift fast. With a live CMMS like OxMaint, benchmarking becomes continuous — the dashboard updates as work orders close, so you see outliers the week they emerge instead of at the next quarterly review. You can Book a Demo to see live benchmarking in action.
Can OxMaint benchmark buildings that currently use different CMMS systems?
Yes. OxMaint ingests historical work-order, asset and meter data from spreadsheets and legacy CMMS instances, maps it to a unified asset hierarchy and begins benchmarking immediately. Most portfolios are live within 2–4 weeks, and the platform auto-normalizes incoming data going forward so the benchmark stays clean without manual effort.
Stop averaging away your worst performers
Find the 31 percent cost gap in your portfolio. Start benchmarking every building against its peers with OxMaint — live, normalized and automated.
Free 14-day trial · No credit card