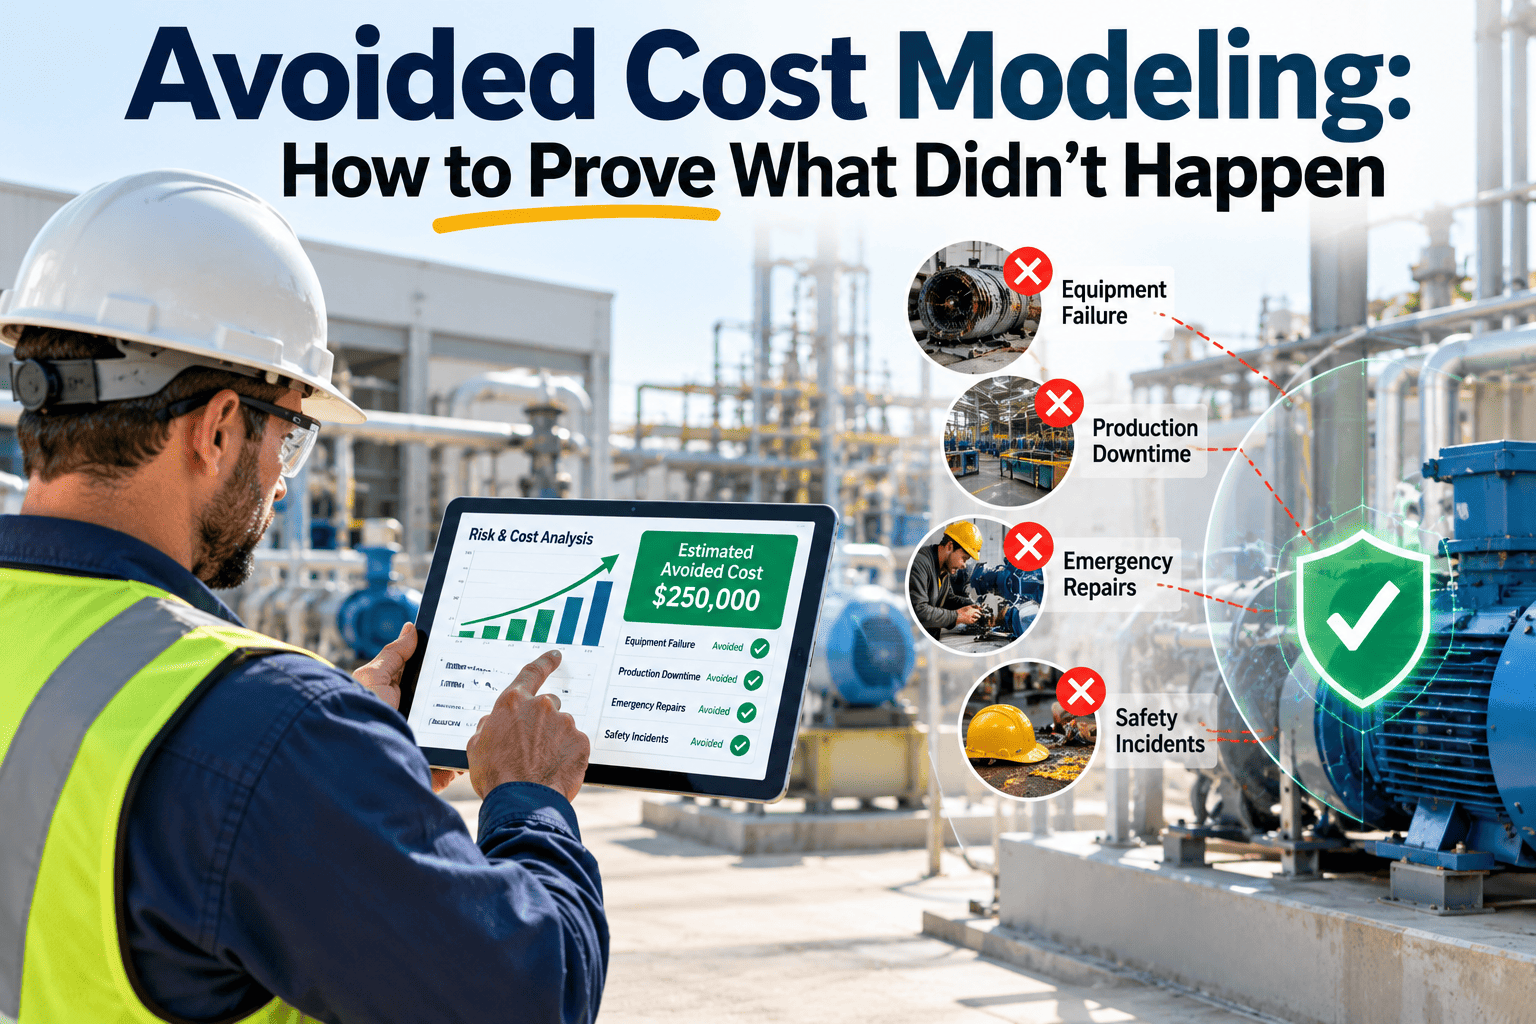
A technician replaces a worn bearing during a scheduled inspection. The pump keeps running, nobody notices, and the work order closes at a few hundred dollars. If the bearing had been left alone, it might have seized, damaged the shaft, and taken a building offline. That second story never happened, so it never shows up in any report. Avoided cost is the value of the failure that did not occur, and it is the hardest number in facility management to defend. This guide sets out a modeling method built on your own failure baseline and clear labels, and shows how Oxmaint maintenance software keeps the records finance will ask to see.
Avoided Cost Modeling: How to Prove What Didn't Happen
Turn prevented failures into numbers a CFO will accept. Build a baseline, state your assumptions, and label every figure honestly.
Why avoided cost is so hard to prove
Savings from reduced spending appear on a bill. Savings from prevented events appear nowhere unless someone records them.
- The event never happened, so there is no invoice, outage report, or incident to point to.
- Maintenance teams describe results in maintenance terms such as MTBF and PM compliance, while finance wants dollars and payback.
- Estimates can be inflated, and finance teams know it, so every figure invites doubt.
- Without a baseline, it is impossible to say how many failures would have occurred anyway.
- When prevention works, the budget looks high compared with the quiet results.
Three evidence tiers: how much weight a number deserves
Not all avoided cost claims are equal. Rank your evidence so finance can see which figures are strongest.
Four ways to build the counterfactual
The counterfactual is your estimate of what would have happened without action. Each method has a strength and a weakness.
| Method | How it works | Strength | Weakness |
|---|---|---|---|
| Own-history baseline | Use failure rates and costs from before the program on the same assets | Uses your own data, which finance trusts | Needs clean history and stable conditions |
| Comparison group | Compare maintained assets with similar assets that did not receive the program | Controls for outside factors | Hard to find truly similar assets |
| Failure probability model | Estimate probability and cost of failure for each flagged condition | Works one catch at a time | Probabilities must be justified |
| Industry benchmark | Apply published failure rates or cost ratios | Available when no history exists | May not fit your assets or operating conditions |
The MTBF baseline method, step by step
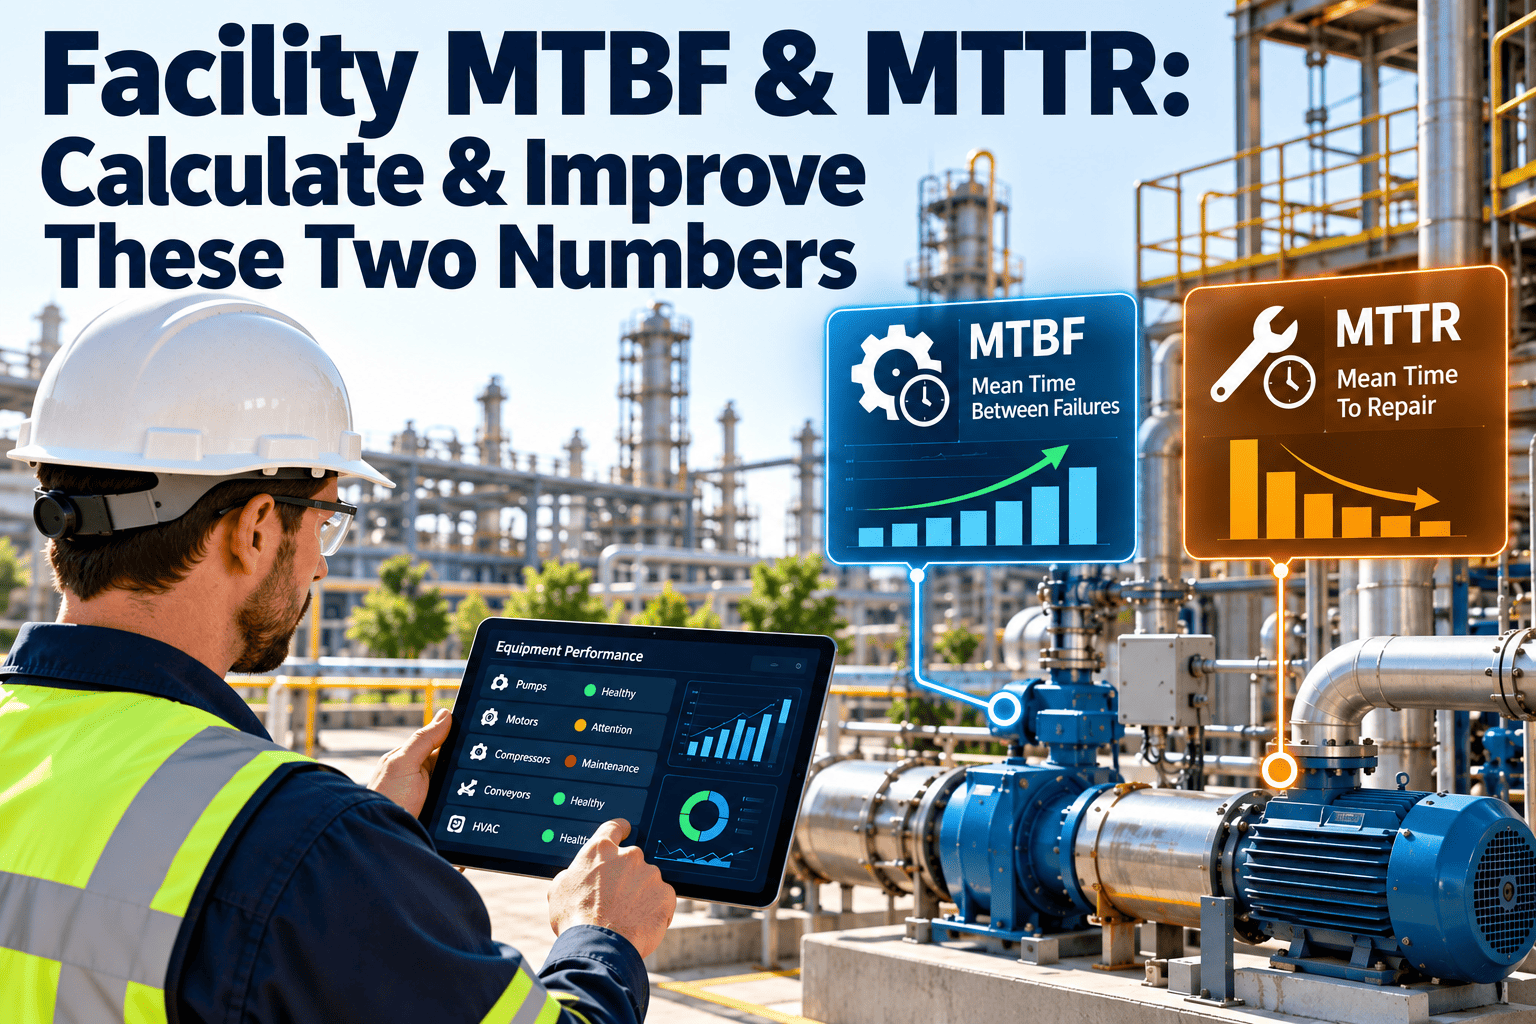
Mean time between failures turns past experience into an expected failure count. The gap between expected and actual failures is your avoided events.
Choose a comparable asset group
Group assets of the same type, duty, and age, such as circulation pumps or supply fan motors.Measure the baseline period
Count functional failures and operating hours before the program. MTBF = operating hours ÷ failures.Project expected failures
Expected failures without the program = operating hours in the new period ÷ baseline MTBF.Count actual failures
Use work orders coded by failure cause, so the count is not a guess.Value the difference
Avoided cost = (expected failures - actual failures) × average cost per failure, minus the cost of the program.Illustrative arithmetic
What a failure really costs
Underestimating failure cost shrinks your result, and overestimating it destroys trust. Build the number from components you can document.
| Component | Where the data comes from | Tip |
|---|---|---|
| Repair labor | Work order hours and labor rates | Include overtime when failures happen out of hours |
| Parts and materials | Work order parts usage and purchase records | Include rush freight when parts are not stocked |
| Emergency premium | Compare emergency and planned repair cost for the same task | Use your own comparison, not a generic markup |
| Secondary damage | Repair history where one failure damaged other components | Only count damage that is documented in your records |
| Downtime and disruption | Outage duration, affected tenants, and service credits or penalties | Use agreed rates, not assumed revenue |
| Energy and comfort impact | Meter data and complaint tickets during the failure | Count only what can be measured |
Honest adjustments that make an estimate credible
A model that applies a few visible haircuts looks more reliable than one that claims every possible benefit.
- Probability discount: not every defect would have become a failure, so weight each Tier 1 catch by a justified probability.
- Attribution share: if several actions contributed, assign only your share of the result to the program.
- Confidence rating: label each estimate high, medium, or low, and agree with finance how each is treated in totals.
- Overlap check: do not count the same failure in both a catch log and a baseline model.
- Time limit: count avoided cost for a defined window, such as one year, rather than the full life of the asset.
- Program cost: always subtract what the program cost to run.
Pitfalls that weaken an MTBF baseline
MTBF looks precise, but it is easy to distort. Check these before presenting a result.
| Pitfall | Why it distorts the result | How to guard against it |
|---|---|---|
| Small sample | A handful of failures can swing MTBF wildly from one period to the next | Pool similar assets and use longer periods, and state the uncertainty |
| Changing failure definitions | Reclassifying what counts as a failure shifts the count without any change in reliability | Fix the definition and code work orders consistently |
| Different duty or age | Assets run harder or older than the baseline group will fail more often | Compare like with like and adjust for operating hours |
| Unrecorded failures | Quick fixes by technicians never reach the system, so the baseline looks better than it was | Require a work order for every corrective action |
| Other changes at the same time | Replacement, controls upgrades, or changed loads affect failures too | Log other changes and attribute only your share |
A sample catch log entry
This shows the level of detail that makes a catch auditable. The values are illustrative.
| Field | Example entry |
|---|---|
| Asset | Condenser water pump, plant room 2, building B |
| Finding | Bearing temperature and vibration trending above normal on two consecutive inspections, with photos and readings attached |
| Method | Scheduled inspection and condition reading |
| Action | Bearing and seal replaced in a planned shutdown window |
| Likely outcome if left | Bearing failure and possible shaft damage within weeks, with an emergency repair and loss of cooling capacity |
| Cost basis | Average of two similar past emergency pump repairs from the asset history, plus recorded downtime |
| Probability weight and confidence | Weight agreed with finance, rated medium confidence |
| Follow-up | Reading checked after one month to confirm the fix held |
Keep the records that make avoided cost defensible
Capture failures, near-misses, costs, and asset history in one system so your estimates have evidence behind them.
Build a catch log from day one
A catch log, sometimes called a near-miss or save log, is the simplest Tier 1 evidence. It costs minutes per entry and pays back at budget time.
Record at the time
- Asset and location
- What was found, with readings and photos
- Who found it and by which method
Estimate with logic
- Likely failure mode if left alone
- Estimated time to failure
- Cost based on a similar past failure
Review monthly
- Confirm the fix was completed
- Check later whether the problem returned
- Total by confidence level
What finance teams reject
Knowing the common objections helps you design the model to survive them.
- Round numbers with no sourceShow the work order history that supports each cost.
- Claiming every defect would have failedApply a justified probability and show it.
- Mixing hard savings with avoided costReport them in separate lines with clear labels.
- Extrapolating one pilot to the whole estateBuild the baseline from data across sites, not one site result.
- Leading with maintenance jargonOpen with the cost of failure and the financial result.
- No change in method between yearsKeep the method stable and disclose any change.
A one-page monthly avoided cost report
Keep the report short and consistent. Executives read what they can scan in two minutes.
Where to start in the first 60 days
You do not need a perfect model to begin. You need consistent records and one agreed method.
- Agree with finance how avoided cost will be defined, labelled, and reported, before any numbers are produced.
- Pick two or three asset groups with enough failure history to build a baseline.
- Add failure cause codes to corrective work orders so counts are reliable.
- Start the catch log for inspections and condition readings, with a standard template.
- Calculate the average cost per failure for each group from your own work orders.
- Produce a first one-page report, then review the method with finance and refine it.
- Share the method with technicians, so they understand why detailed findings and photos matter.
How Oxmaint supports avoided cost modeling
The model depends on records of failures, costs, and catches. These are exactly what maintenance management software holds.
Failure and repair history
Keep a full record of every corrective work order by asset, with causes, labor, and parts.Inspection findings
Capture defects found during inspections with notes and photos so each catch is documented.Asset records
Group assets by type and duty to build comparable baselines.Preventive maintenance
Show the program cost and completion that drive the result.Condition-based workflows
Turn readings and alerts into inspection or corrective work orders, depending on how data sources are connected.Reports and dashboards
Track planned versus reactive work and failure trends to support the monthly report.KPIs for an avoided cost program
Track the quality of the evidence as well as the totals.
Failures versus baseline
Actual failures divided by expected failures from baseline MTBFDocumented catch rate
Catches with photos, readings, and cost logic divided by all catches loggedTier 1 share
Avoided cost from documented catches divided by total avoided costPlanned work share
Planned work orders divided by all work ordersRepeat failure rate
Repeat failures on the same asset and cause divided by all failuresProgram cost ratio
Avoided cost divided by program cost, reported with its evidence tierAvoided cost modeling FAQs
Is avoided cost a real saving?
It is an estimate of a loss that did not occur. Report it separately from hard savings and label its evidence tier so finance can decide how to treat it.
What baseline should we use?
Use your own failure history for comparable assets before the program started, with MTBF as the main measure. Use benchmarks only where history is missing.
How do we avoid overclaiming?
Apply probability weights, subtract program cost, avoid double counting, and show your assumptions. Book a demo to see how records support this.
Can one pilot support a company-wide claim?
Not by itself. Site conditions and failure rates vary, so build the enterprise baseline from data across sites.
How does Oxmaint help?
It keeps failure history, inspection findings, costs, and asset groups together, so each estimate can be traced. Create an account to start recording catches.
Prove the value of failures that never happened
Give your team one record of catches, failures, and costs so avoided cost stands up in the budget room.