Preventive maintenance separates exceptional property portfolios from those that constantly fight fires. Properties implementing systematic preventive maintenance programs see 50-70% reduction in emergency repairs, 20-35% extension in equipment lifespan, and 8-15% reduction in overall maintenance spending. Yet most property managers lack structured preventive maintenance beyond annual HVAC tune-ups and occasional gutter cleaning. Effective PM program design requires understanding equipment manufacturer recommendations, building asset criticality hierarchies, determining optimal maintenance frequency (too often wastes resources, too infrequent allows failures), and executing with discipline across properties and seasons. USA-based property teams managing hundreds of units often discover that their single biggest opportunity for improvement isn't better emergency response — it's investing properly in planned, scheduled preventive work that prevents emergencies entirely. This guide walks through PM program design from asset inventory through execution discipline, including manufacturer research, PM task development, frequency determination, scheduling optimization, and effectiveness measurement frameworks. Start free — design your preventive maintenance program today.
Preventive Maintenance Program Design: Build World-Class PM Systems That Prevent Failures
Complete PM program design framework for property portfolios. Equipment criticality analysis, manufacturer recommendation research, PM frequency optimization, task development, seasonal planning, route optimization, and effectiveness measurement.
PM Program Foundations — Asset Inventory, Criticality Analysis, and Manufacturer Research
Building an effective preventive maintenance program starts with foundational data: complete asset inventory, criticality assessment, and manufacturer maintenance recommendations. First, conduct a comprehensive property asset inventory: photograph every major building system (HVAC, electrical, plumbing, roofing, structural, doors/windows, kitchen appliances, parking surfaces), document installation dates and equipment specs, and research manufacturer maintenance manuals. This inventory becomes your PM framework source — every asset with a manufacturer manual has explicit maintenance recommendations. Second, assess asset criticality: which failures cause the greatest business disruption? Heating systems in northern climates rank critical (failure leaves buildings unlivable in winter); hot water heaters rank highly (daily resident complaints if failed); refrigerators in common kitchens rank lower (inconvenient but not critical). Create a criticality matrix scoring assets 1-5 on: severity of failure impact, frequency of resident complaints, safety implications, and cost of replacement. Critical assets (4-5 score) receive the most attention and highest PM frequency. Non-critical assets (1-2 score) may use less frequent PM. Third, research manufacturer recommendations: most equipment manufacturers publish PM schedules specifying required tasks and intervals. HVAC manufacturers typically recommend annual tune-ups, filter changes every 1-3 months, and seasonal inspections. Boilers require annual certification and regular combustion analysis. Electrical panels benefit from 5-year comprehensive inspections. Roofs need biannual inspections. This manufacturer data provides your PM program's backbone.
PM Task Development & Frequency Optimization — Balancing Cost and Prevention
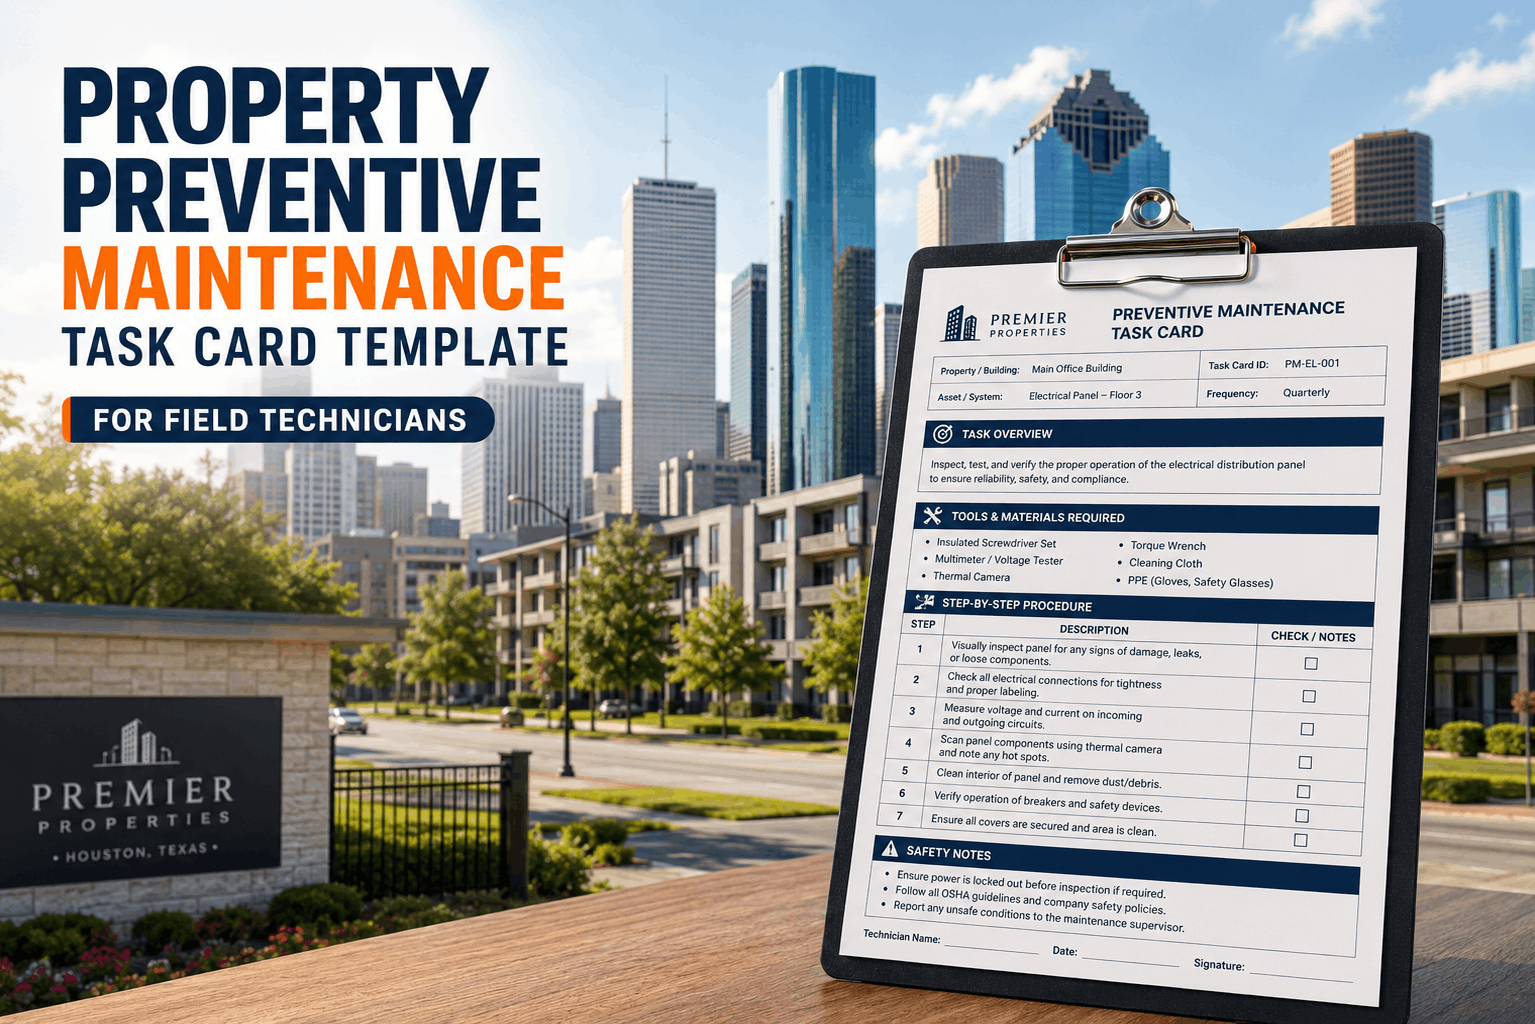
Once you've identified critical assets and researched manufacturer recommendations, develop specific PM tasks and optimize frequency. A PM task should be discrete (completable in defined time), measurable (yes/no pass/fail criteria), and aligned with manufacturer guidance. For HVAC systems, a fall PM task might include: inspect and replace filter (15 min), check thermostat operation (10 min), test heating cycle (15 min), clean exterior coil (20 min), inspect ductwork for leaks (15 min), verify safety controls (10 min) — total 85 minutes labor. Budget accordingly: at $95 contractor rate = ~$135 per fall inspection plus materials ($25-40 for filter/cleaners). Spring PM might include similar tasks plus refrigerant charge verification if applicable. For roofing, a biannual inspection includes: walk roof perimeter documenting condition, inspect flashing, check gutters for debris/damage, test drainage, photograph all areas for comparison. Cost: 4-6 hours labor ($380-570) plus any minor repairs. Frequency optimization requires balancing prevention cost against failure probability. If an HVAC failure occurs once every 4 years on average (25% annual failure rate) at $3,000 emergency cost, but preventive maintenance costs $270 annually (labor + materials), the economics are clear: spend $270 to prevent $3,000 failures. However, if a component rarely fails and preventive maintenance requires significant effort/cost, move to condition-based monitoring (monitor instead of routine maintenance). Optimal PM programs spend 15-25% of total maintenance budgets on scheduled preventive work, with remaining 75-85% allocated to reactive repairs and capital work.
| System/Asset | PM Task | Recommended Frequency | Est. Labor Hours | Est. Annual Cost |
|---|---|---|---|---|
| HVAC Unit | Filter change, coil cleaning, cycle test | Spring & Fall (2x/yr) | 1.5 hrs/visit | $270-380 |
| Boiler/Water Heater | Safety inspection, combustion analysis | Annually | 2 hrs | $190-280 |
| Roof | Condition inspection, flashing check | Biannually | 4-6 hrs | $380-570 |
| Electrical Panel | Comprehensive inspection, testing | Every 5 years | 3-4 hrs | $285-380 |
| Plumbing System | Inspection, testing, drain clearing | Annually | 2-3 hrs | $190-285 |
| Fire Suppression | System test, certification | Annually (req'd) | 4-6 hrs | $380-570 |
| Exterior/Parking | Seal coat, crack fill, cleaning | Every 2-3 years | Variable | $2-4/sq ft applied |
| Common Area Cleaning | Deep cleaning, floor treatment | Quarterly to Annually | 4-8 hrs | $380-760 |
PM Scheduling & Route Optimization — Coordinating Work Across Properties
With PM tasks defined and frequency established, schedule execution becomes critical. Most property managers organize PM by season (spring HVAC prep, fall gutter cleaning, winter heating checks, summer cooling tests) rather than random intervals, improving contractor efficiency and resident accommodation. A seasonal calendar helps residents anticipate maintenance (residents know spring brings HVAC inspections; they can schedule accordingly). Route optimization groups related work to reduce travel time: if you have 10 properties and need spring HVAC inspections, schedule contractor to visit all 10 properties in a single week rather than spreading appointments across the month. This reduces contractor travel costs (1 mobilization vs. 10) and speeds completion. CMMS systems automate PM scheduling: define each asset's PM frequency, the system generates work orders on schedule, assigns to contractors, and tracks completion. When the HVAC contractor completes a spring inspection, the system automatically schedules the fall follow-up. This eliminates manual tracking failures where seasonal PM gets missed because no one updated the spreadsheet. Successful PM programs achieve 90-95% execution compliance through consistent scheduling discipline. Properties that struggle with PM completion typically have ad-hoc scheduling (never quite remember when PM is due) rather than calendar-based automation. Investment in scheduling discipline pays enormous dividends in failure prevention.
| Season | Primary PM Activities | Contractor Type | Typical Duration |
|---|---|---|---|
| Spring (March-May) | HVAC spring tune-up, gutter cleaning, roof inspection, exterior painting prep, plumbing checks | HVAC, Roofer, General Contractor | 4-6 weeks peak season |
| Summer (June-August) | HVAC cooling season checks, exterior maintenance, parking lot seal coating, landscaping | HVAC, Paving, Landscaper | Variable, lower PM demand |
| Fall (Sept-Nov) | HVAC fall tune-up, gutter clearing, winterization, heating system checks, boiler certification | HVAC, Roofer, Heating Specialist | 4-6 weeks peak season |
| Winter (Dec-Feb) | Heating system monitoring, snow/ice management, emergency prep, electrical system checks | Heating, Snow Removal, Electrician | On-demand, reactive focus |
Measuring PM Effectiveness — KPIs That Drive Continuous Improvement
Effective PM programs track success through quantifiable metrics: (1) PM completion rate — percentage of scheduled PM tasks completed on time, target 90-95%; (2) Emergency call reduction — year-over-year decline in emergency maintenance calls, target 50-70% reduction vs. pre-PM baseline; (3) Equipment failure rate — percentage of equipment experiencing unplanned failure despite PM, target under 5% of assets; (4) Mean time between failures (MTBF) — average time from PM completion to next failure, increasing MTBF indicates improving equipment health; (5) Maintenance cost per unit — total maintenance spending per property unit, target stabilization or reduction as emergency costs decline; (6) Equipment lifespan achieved vs. manufacturer expectation — tracking actual replacement dates against design life, target 20-35% life extension. Best practice is to measure these metrics quarterly and trend over time. The first six months of PM program implementation often show increasing emergency calls as deferred maintenance problems surface (the system discovers issues that were being masked). By month 8-12, you should see stabilization. By year 2, successful programs show 40-50% emergency reduction. By year 3, mature programs approach the 60-70% reduction target. This progression helps property managers and ownership understand that PM success takes time and requires patience through the initial turnaround phase.
Frequently Asked Questions — Preventive Maintenance Program Design & Execution
Before implementing a formal PM program, we were drowning in emergency repairs. We had 14 properties with 180 units across the region, and on any given week, we'd get 3-5 emergency calls. A heating system would fail in January, flooding pipes would burst in February, a roof leak would appear in March. We were perpetually reactive, sending contractors out on emergency dispatch (high cost), residents were frustrated with poor service, and we could never plan maintenance spend. Implementing systematic PM with Oxmaint changed everything. We started with a complete asset inventory and criticality assessment — identifying which systems absolutely couldn't fail (heating, cooling, water) vs. which were lower priority. We scheduled spring and fall HVAC tune-ups on all 14 properties in two-week windows rather than scattered appointments. We added quarterly roof inspections and biannual plumbing inspections. First year, we were honestly discouraged — emergency calls actually increased slightly in months 3-5 as we discovered deferred maintenance issues (a water heater that was failing, a roof with hidden damage). But by month 9, emergency calls had dropped 40%. By year two, we hit 58% emergency reduction. We prevented a catastrophic heating system failure by catching degrading pressure through our preventive monitoring. We've deferred the roofing replacement decision by three years through consistent maintenance. Most importantly, we can now predict our maintenance spending. Emergency calls that once consumed 60% of our budget are now 20%. We can actually plan capital work rather than being held hostage by unplanned failures.
Start Your Preventive Maintenance Program — Designed for Your Portfolio Assets
Asset inventory, criticality analysis, manufacturer PM research, task development, frequency optimization, seasonal scheduling, and effectiveness measurement.