A 1.2 million sq ft regional mall was spending $2.8 million annually on HVAC energy — 31% above the ENERGY STAR median for retail facilities — without a single energy anomaly alert in the previous 18 months. The chiller plant was sequencing on schedule instead of by load, six anchor tenant zones were overcooling by 2.4°C against setpoint, and 140 rooftop units had no runtime-linked PM record. When the facilities director finally connected zone-level energy metering to maintenance history in OxMaint, the first monthly report identified $380,000 in recoverable annual waste before a single contractor was called. Sign in to OxMaint to connect your mall's HVAC zones, chiller plant, and tenant comfort system into one energy management platform, or book a demo to see the mall energy dashboard in action.
Energy & ESG Reporting · Retail HVAC · Mall Operations
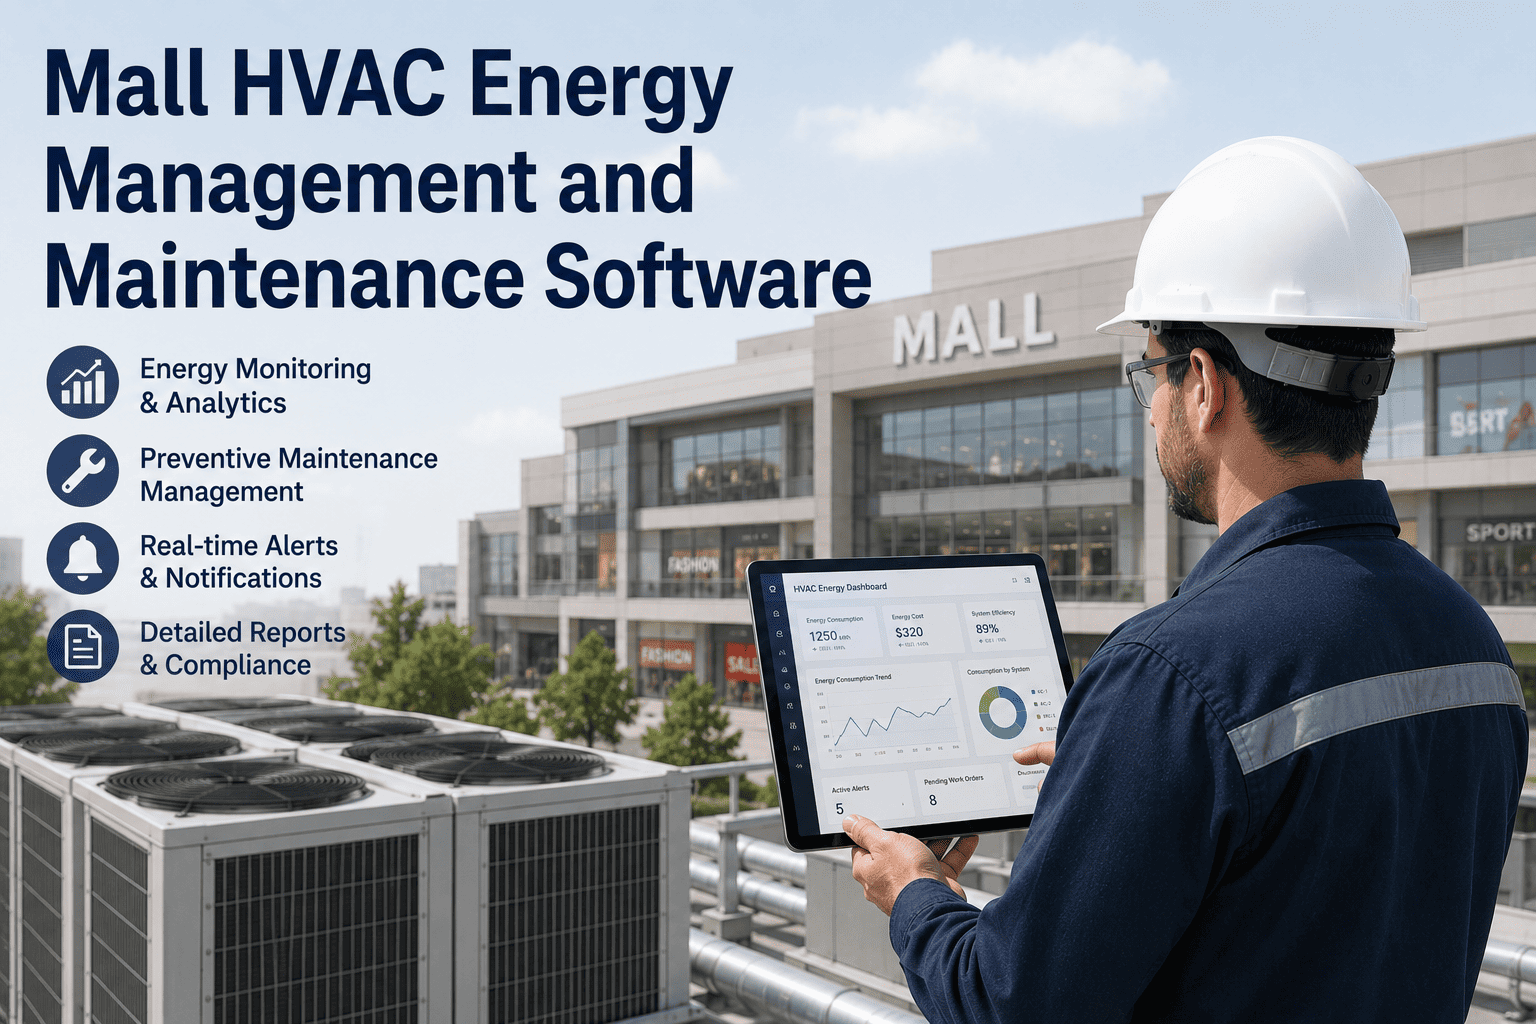
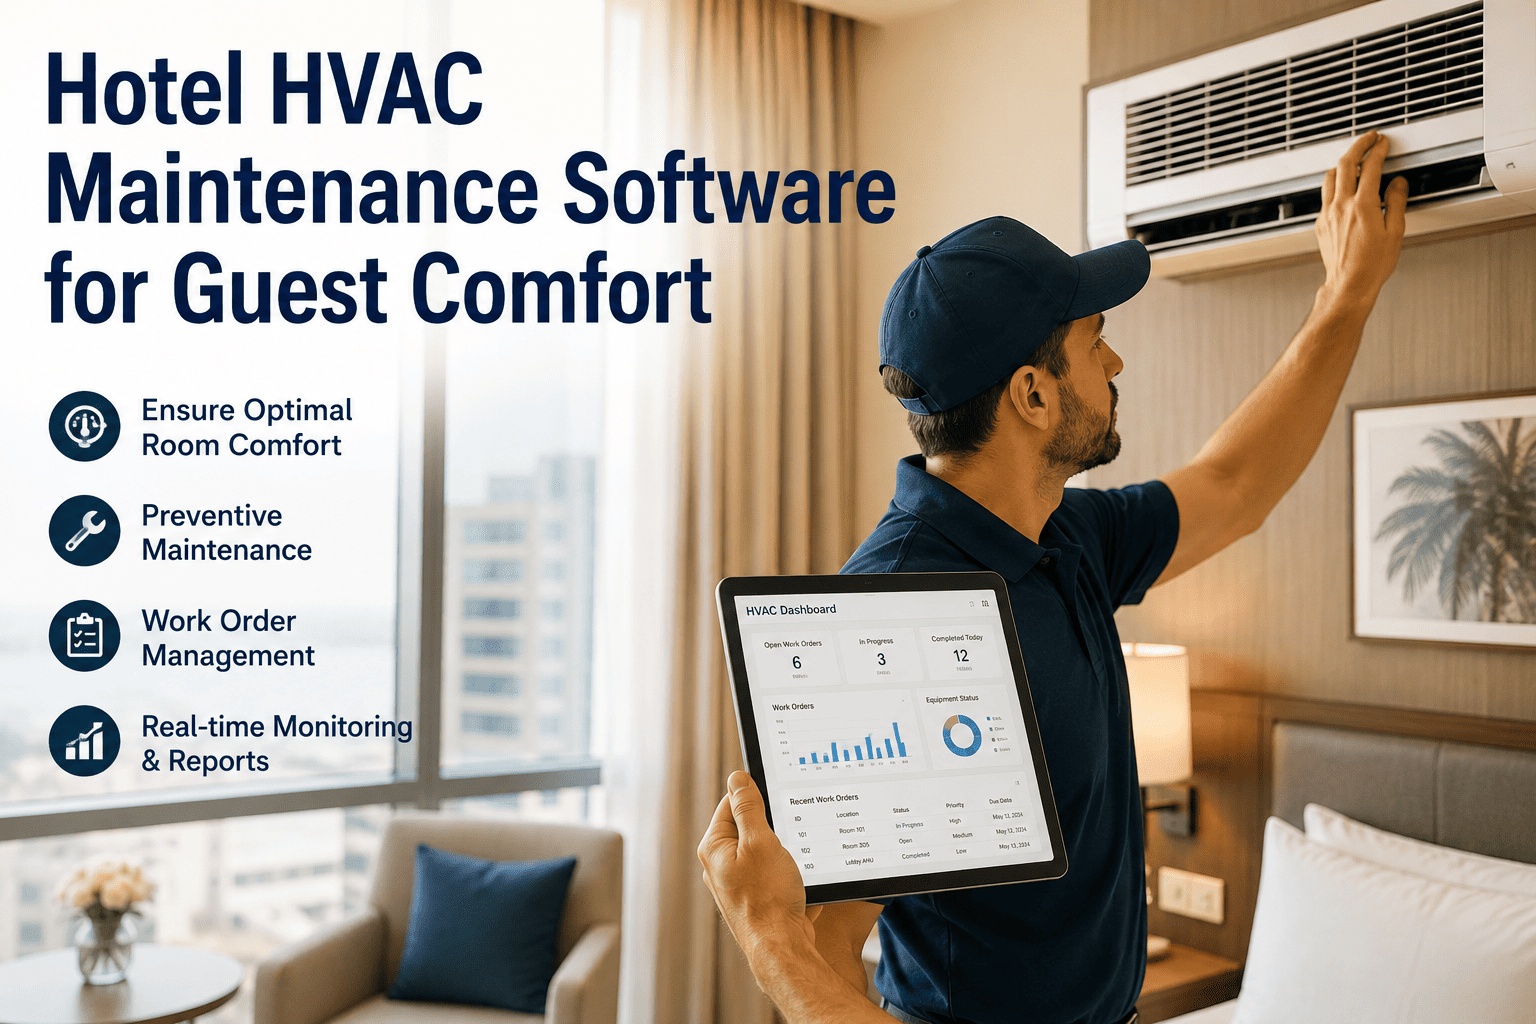
Mall HVAC Energy Management and Maintenance Software
One platform for chiller plant sequencing, anchor zone energy monitoring, tenant comfort requests, 140+ rooftop unit PM schedules, and real-time energy waste alerts — purpose-built for the complexity of managing HVAC across a multi-tenant retail environment.
$380K
Recoverable HVAC energy waste identified in first 30 days of OxMaint deployment
31%
Above ENERGY STAR median — typical unoptimised regional mall energy consumption
140+
Rooftop units per large mall requiring runtime-tracked PM — zero visibility without CMMS
68%
Of tenant comfort complaints trace to HVAC maintenance gaps, not equipment failure
The Mall HVAC Problem
Why Malls Overspend on HVAC — And Why It Is Never One Issue
Mall HVAC is not a single system — it is a collection of interconnected subsystems operating across diverse occupancy zones with conflicting requirements. Anchor tenants, food courts, cinema blocks, enclosed malls, and car park levels all have different load profiles, occupancy schedules, and thermal demands. Managing this complexity without zone-level data produces predictable outcomes: overcooling in low-occupancy zones, undercooling during peak trading hours, and energy spend that nobody can trace to a cause.
01
Chiller Sequencing by Schedule, Not Load
Mall chiller plants sized for peak summer trading run two or three units at 35–50% load on shoulder-season nights when a single unit at 75% load would deliver the same cooling at 18–22% lower energy cost. Without runtime load analytics, operators sequence by calendar — not by real-time load distribution and each machine's current efficiency curve.
Typical waste: $45,000–$90,000 per year on a 3-chiller plant
02
Zone Overcooling in Anchor and Atrium Areas
Anchor tenant spaces with high ceilings and large glazed frontages frequently receive excessive chilled air relative to their occupancy load — particularly during off-peak hours when store occupancy drops to 10–15% of capacity. Each 1°C of setpoint overcooling in a 50,000 sq ft anchor zone adds $8,000–$14,000 to annual cooling energy with zero comfort benefit to the occupants present.
Typical waste: $28,000–$56,000 per year across four anchor zones
03
RTU Degradation Running Undetected Across 140 Units
A mall with 140 rooftop units where 22% have fouled coils, 15% have refrigerant undercharge, and 8% have failed economisers is running those faults silently — each unit consuming 15–25% above its rated energy draw without triggering a complaint, because the zone still reaches setpoint (just more expensively). Without runtime-hour PM tracking, faults accumulate across the fleet invisibly.
Typical waste: $120,000–$200,000 per year across a 140-RTU estate with no PM system
04
Tenant Comfort Requests Without Asset Context
Food court and fashion retail tenants generate different comfort complaint patterns for different reasons — a food court "too hot" call usually traces to exhaust system imbalance while a fashion anchor "too cold" call usually traces to AHU damper drift. Without the asset history and zone context loaded into the work order, every complaint is treated as a new problem — diagnosed from scratch, resolved slowly, and likely to recur.
Typical cost: 3.4 hrs average resolution time vs 48 min with asset-linked work orders
Live Energy Intelligence
What the OxMaint Mall Dashboard Shows in Real Time
Chiller Plant
0.71 kW/t
+16% vs target
Anchor Zone A
Overcooling
−2.4°C vs setpoint
Food Court
On target
Within ±0.5°C
Cinema Block
+8% draw
RTU-14 degraded
Atrium / Common
On target
AHUs nominal
Car Park Level B1
Fault active
Fan motor P2
3 active alerts — Anchor Zone A overcooling, RTU-14 Cinema degraded, Car Park B1 fan fault. 2 WOs auto-generated.
Today's Energy Snapshot
$1,140
Excess vs baseline
Energy Waste by Category — This Month
Chiller sequencing
$7,400
Total excess this month: $23,200 — $278,400 annualised
Predictive Flag
RTU-14 — Cinema Block
Energy deviation+8.4% vs baseline
Fault signatureCoil fouling pattern
Daily waste cost$38/day
Recommended actionCoil clean WO raised
Platform Capabilities
Four Capabilities That Make the Difference in Mall HVAC Operations
01
Zone-Level Energy Monitoring With PM Correlation
OxMaint tracks HVAC energy consumption by zone — anchor tenants, food court, cinema, atrium, car park levels — and correlates consumption trends against maintenance history for every asset in that zone. When a cinema block zone's energy draw rises 8% over 10 days, OxMaint surfaces the RTU with the worst fouling history as the most likely cause and pre-populates a coil cleaning work order before the tenant notices reduced comfort.
02
Chiller Plant Load Analytics and Sequencing Intelligence
Real-time kW/ton per chiller, total plant load, and sequencing efficiency analytics — updated continuously and benchmarked against the plant's own historical best performance. OxMaint surfaces suboptimal sequencing configurations with the energy cost per day of the current arrangement versus the recommended configuration. Operators see the dollar value of every staging decision, not just the technical parameters.
03
140-RTU Asset Registry With Runtime-Triggered PM
Every rooftop unit registered in OxMaint with nameplate data, installation date, zone assignment, and refrigerant type. PM tasks triggered by runtime hours — not calendar dates — so a cinema block RTU running three sessions daily accumulates hours 2.5× faster than a storage area unit and receives its filter change and coil inspection at the right interval. Fleet-level PM compliance visible in one view with overdue units ranked by energy impact.
04
Tenant Comfort Request Management With Asset Context
Tenant comfort requests arrive via OxMaint's tenant portal, are automatically matched to the zone asset register, and arrive in the technician's work order with the full asset history — last service date, recent fault codes, zone setpoint, and current sensor readings. A food court "too warm" complaint becomes a work order pre-loaded with exhaust fan balance history and supply air temperature trend for that zone. Resolution time drops from hours to minutes.
Mall HVAC · Energy & ESG Platform
Connect Every Zone, Every Chiller, Every RTU — In One Energy Management Dashboard
OxMaint connects to your BMS, energy metering infrastructure, and existing HVAC data to deliver zone-level energy intelligence, chiller sequencing analytics, and runtime-triggered PM for every rooftop unit in your mall — without a new hardware installation.
Before vs After
Energy and Operational Results — 1.2M sq ft Regional Mall, Year 1
Baseline collected over 12 months pre-deployment. Post-deployment outcomes measured across Year 1 following OxMaint go-live.
Annual HVAC Energy Cost
$880K saving — 31% reduction
Tenant Comfort Request Resolution (avg hrs)
76% faster resolution with asset-linked work orders
RTU Fleet PM Compliance Rate
37 pt improvement — runtime-triggered PM scheduling
Emergency HVAC Callouts per Month
73% callout reduction — predictive PM catching degradation early
| Savings Category |
Root Cause |
OxMaint Action |
Annual Saving |
| Chiller sequencing optimisation |
3 chillers at 38–44% load vs 1 at 78% optimal |
Load analytics identified staging config — $6,200/month excess displayed to operator |
$214,000 |
| Anchor zone overcooling correction |
6 anchor zones averaging −2.1°C below setpoint |
Zone energy monitoring flagged overcooling — setpoints corrected per zone |
$168,000 |
| RTU fleet PM compliance improvement |
57% PM compliance — fouled coils on 31 units undetected |
Runtime-triggered PM raised 94% compliance — coil cleaning on 31 units |
$186,000 |
| Emergency callout reduction |
22 emergency calls/month — avg $2,800 per call |
Predictive PM reduced calls to 6/month — 16 fewer emergency events monthly |
$181,000 |
| After-hours HVAC run elimination |
14 zones running full HVAC 2–3 hrs after close daily |
Occupancy-linked scheduling cut after-hours run by 88% |
$131,000 |
| Total documented Year 1 saving |
|
|
$880,000 |
"
Mall HVAC management is underestimated as an operational discipline because it looks simpler than it is. From the outside, a shopping centre is one building. From inside the facilities team, it is 30 to 200 separately tenanted zones, each with different occupancy profiles, different lease obligations, different comfort sensitivity, and different heat loads from retail fit-outs that change every three to five years. The facilities teams that manage this well are invariably the ones who have connected zone-level energy data to maintenance history — not because energy monitoring is their primary goal, but because the correlation between a rising energy draw in a zone and a maintenance gap in that zone is the most reliable early-warning signal available. OxMaint is the only platform I have reviewed that makes that correlation automatic for mall operators at the RTU fleet scale — turning what used to be a monthly spreadsheet exercise into a daily operational signal that drives the right work order to the right technician before the tenant notices the problem.
Preethi Subramaniam, CEM, LEED AP BD+C
Certified Energy Manager · LEED AP Building Design + Construction · 21 years retail and mixed-use facility energy management · Former Head of Sustainability, 18-asset regional mall portfolio · Specialist in retail HVAC energy optimisation, tenant comfort SLA management, and ESG reporting for GRESB-rated retail REITs
Every Zone. Every Chiller. Every RTU. One Energy Dashboard.
OxMaint gives mall facilities teams zone-level energy intelligence, chiller plant sequencing analytics, runtime-triggered PM for every rooftop unit, and tenant comfort request management — all connected in one platform. Know where your HVAC money is going, and which maintenance action recovers the most of it.
Frequently Asked Questions
Mall HVAC Energy Management — Common Questions
How does OxMaint handle HVAC energy monitoring across a mall with 200+ individual tenant zones?
OxMaint organises mall HVAC assets in a hierarchical structure — building level, zone group (anchor, food court, cinema, common areas, car park levels), individual zone, and individual asset (AHU, RTU, FCU). Energy metering data from your BMS or sub-metering system maps to this hierarchy automatically, so zone-level consumption is visible at every level of aggregation. Tenant zones can be assigned to specific tenants in the platform, enabling per-tenant energy consumption reporting for lease compliance, energy recharge agreements, and sustainability reporting. The hierarchy is fully configurable — malls with three levels and atrium HVAC have different structures from single-level retail parks, and OxMaint's zone architecture accommodates both.
Sign in to OxMaint to configure your mall's zone hierarchy from day one.
Can OxMaint manage PM schedules for a fleet of 140+ rooftop units with different runtime profiles?
Yes — this is one of OxMaint's core capabilities for retail HVAC estates. Each RTU in the fleet is registered as an individual asset with its zone assignment, nameplate data, and operational schedule. PM intervals are set in runtime hours — not calendar days — so a cinema block RTU running three sessions daily receives its 500-hour filter change and coil inspection at the appropriate interval based on actual operating hours, not a fixed calendar date that was calibrated for an average-use unit. The fleet PM dashboard shows compliance status for every unit, overdue tasks ranked by energy impact, and upcoming PM windows for each unit. For malls operating with external HVAC contractors, OxMaint's contractor management module assigns each PM task to the responsible vendor and tracks completion against the agreed scope.
Book a demo to see the 140-RTU fleet PM dashboard.
How does OxMaint generate ENERGY STAR and ESG reports for mall sustainability compliance?
OxMaint's Energy and ESG Reporting module converts HVAC energy consumption data into portfolio-level sustainability metrics continuously — kWh per sq ft, kgCO₂e per sq ft, energy use intensity (EUI), and year-on-year improvement trajectories. For ENERGY STAR Portfolio Manager submission, OxMaint exports consumption data in the ENERGY STAR format covering the required 12-month period without manual compilation. For GRESB (Global Real Estate Sustainability Benchmark) reporting, the platform generates the HVAC energy breakdown required for the GRESB Asset Assessment at both asset and portfolio level. The reports generate automatically on a defined schedule — monthly for internal review, annually for external submission — and are available on-demand for ad hoc sustainability queries from investors, auditors, or tenants.
Sign in to OxMaint to access the ESG reporting module.
What is the typical payback period for OxMaint deployment in a regional mall?
For a 1M+ sq ft regional mall with an unoptimised HVAC estate, the documented payback period for OxMaint deployment is 4–8 months — driven primarily by energy waste reduction from chiller sequencing optimisation and RTU fleet PM compliance improvement. The fastest-recovering savings category is typically chiller staging analytics, where load data immediately identifies suboptimal sequencing configurations whose energy cost can be quantified to the dollar before any contractor is engaged. Energy savings from RTU fleet PM improvement compound over 12–18 months as PM compliance rates climb and progressive efficiency degradation between service events is reduced. Malls with over 100 RTUs and a prior PM compliance rate below 70% consistently achieve Year 1 savings of $600K–$1.2M across all optimisation categories.
Book a demo to model your mall's estimated Year 1 savings.