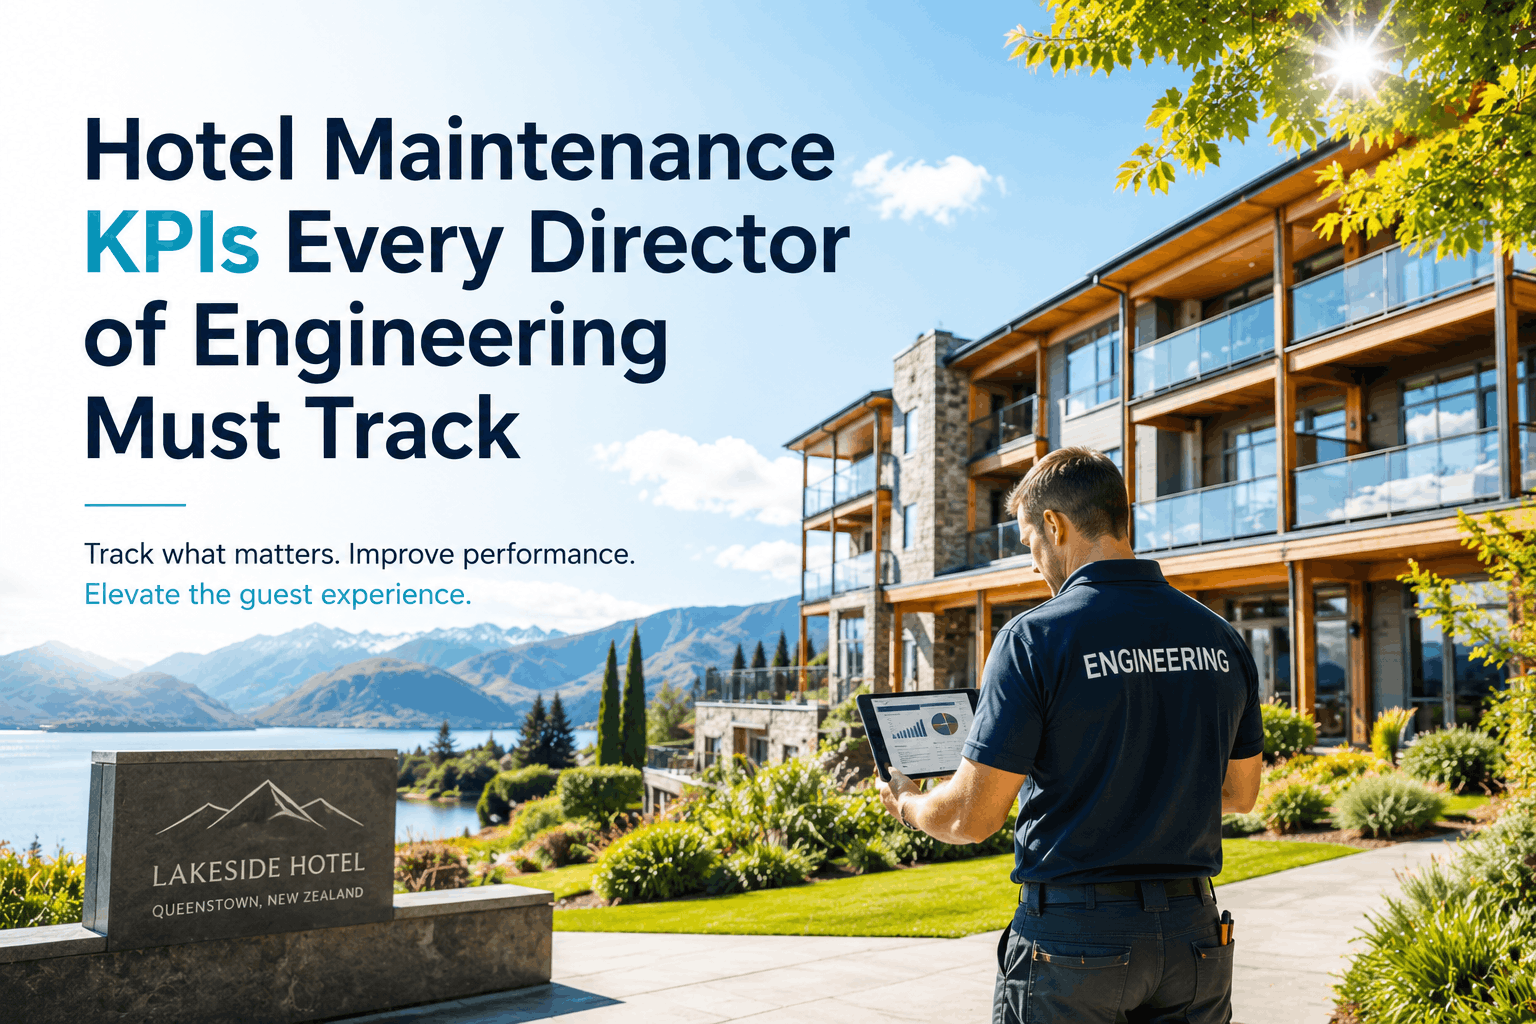
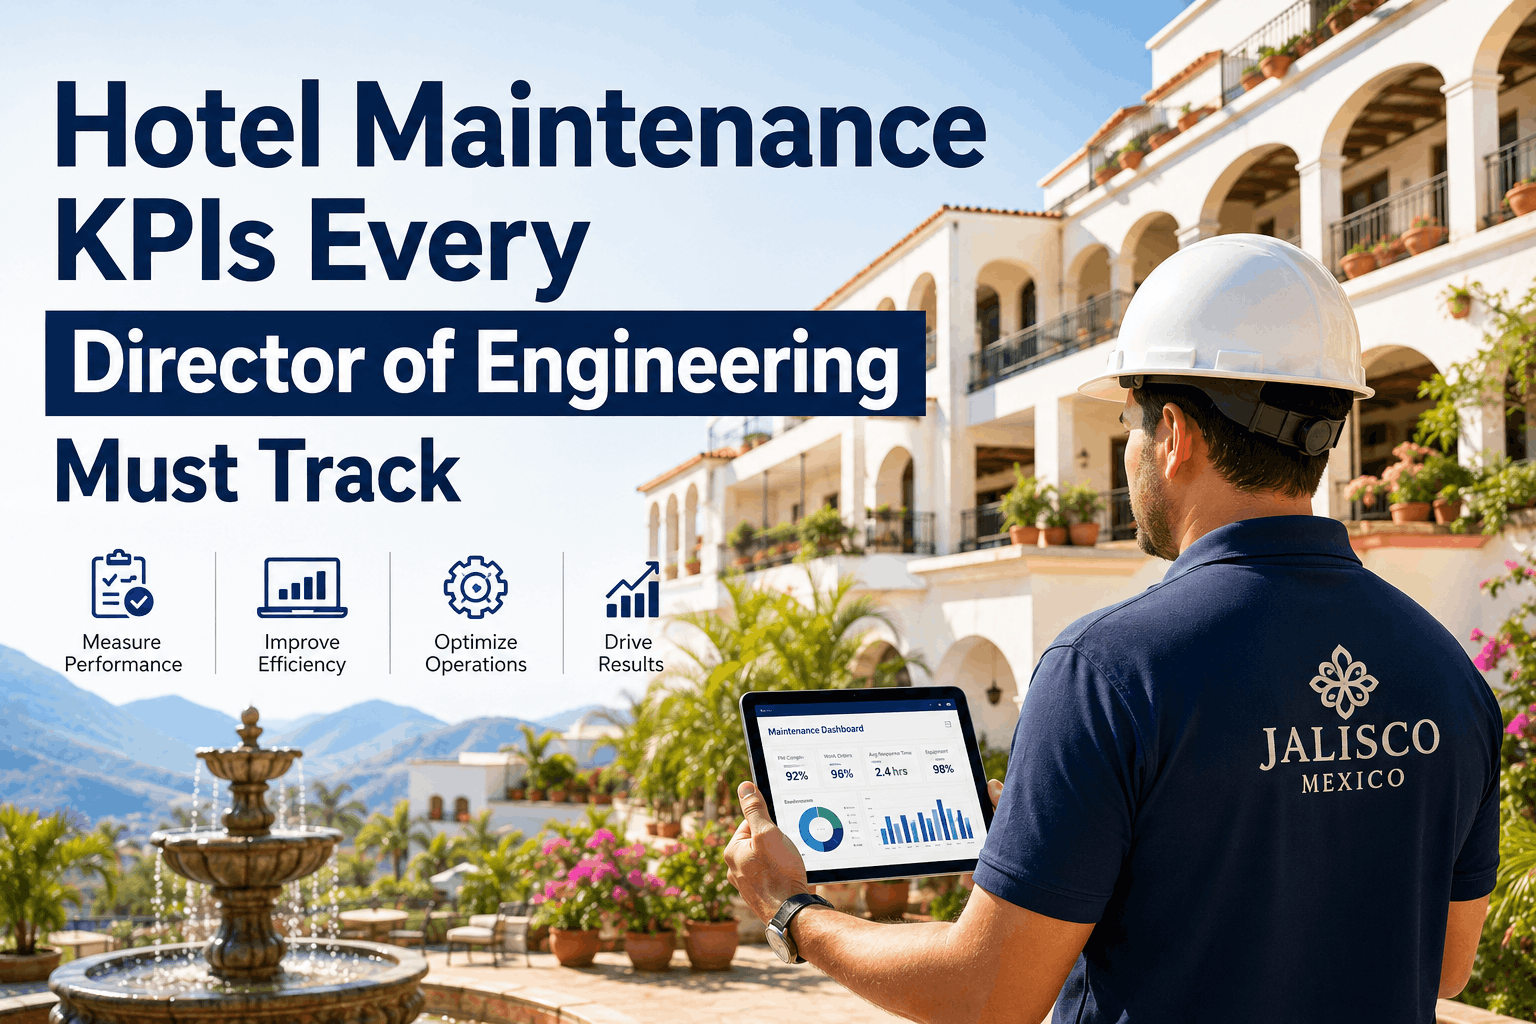
Hotel Maintenance KPIs Every Director of Engineering Must Track
By Alex Jordan on June 16, 2026
A major hotel chain in Florida with 45 properties was losing $340,000 annually to untracked maintenance costs and reactive repairs. Guest satisfaction scores were declining because engineering teams couldn't prioritize work — they were constantly responding to emergency calls instead of preventing equipment failure. After implementing a structured KPI dashboard focused on PM compliance, equipment uptime, and cost-per-occupied-room, guest satisfaction increased 18%, labour costs dropped 22%, and emergency repair incidents fell 57% in year one. The difference wasn't a new tool — it was measuring what actually drives hotel maintenance performance. OxMaint's hotel maintenance KPI platform surfaces cost-per-occupied-room, PM compliance percentage, and equipment uptime alerts so you know which systems are failing before guests report them. Book a demo to see your property's maintenance health score.
Track Every Maintenance Dollar — From PM Scheduling to Guest Impact
Hotel maintenance KPIs that connect engineering performance to revenue. PM compliance, uptime, cost-per-occupied-room, guest complaint reduction — all in one dashboard.
Average cost-per-occupied-room for hotel maintenance across 150+ US properties (2024 baseline)
3.2×
Cost multiplier for emergency repairs vs planned maintenance in hospitality (average guest room HVAC failure = $4,800 unplanned vs $520 planned)
34%
Average reduction in guest complaints related to room amenities and climate control after implementing PM compliance tracking
The 5 Hotel Maintenance KPIs That Drive Revenue — Beyond MTTR
Most hotel engineering departments track work order volume and average repair time. These metrics don't connect to what actually matters: guest satisfaction, equipment reliability, and cost control. The highest-performing hospitality groups track five interconnected KPIs that create a complete maintenance health picture. Each drives a different business outcome. OxMaint calculates all five KPIs automatically from your CMMS data and alerts you when a property drifts below target.
1
PM Compliance Percentage (%)
Target: 92–98%
The percentage of scheduled preventive maintenance tasks completed on time. Hotels tracking this metric at 95%+ reduce emergency repairs by 61%. A single overdue HVAC inspection can cascade into a $12,000 guest room failure. OxMaint tracks PM due dates across all asset classes and flags properties slipping below 90% compliance instantly.
2
Cost Per Occupied Room (CPOR)
Target: $5.20–$7.80 (varies by class)
Total monthly maintenance cost ÷ occupied room nights. This metric ties engineering performance directly to revenue. A 400-room hotel with 85% occupancy spending $8.40 CPOR is wasting $18,200 annually against a 92% PM-compliant property at $6.10 CPOR. This includes labour, parts, contractor spend, and equipment replacement amortization. OxMaint breaks it down by building system so you see exactly which assets are dragging the number.
3
Equipment Uptime (%)
Target: 98.2%–99.6%
The percentage of critical building systems (HVAC, hot water, electrical, plumbing, elevators) that are operational and performing at spec. A single guest room without hot water or AC not only loses that night's revenue—it tanks property review scores for months. Equipment uptime of 98% means 4.8 hours of unplanned downtime per month across your entire building. Most hotels don't measure this; the ones that do save $140,000+ annually in lost revenue and reputation recovery.
4
Mean Time To Repair (MTTR)
Target: 4.2–6.8 hours
Average time from work order creation to job completion. Most hotels benchmark at 8–14 hours, but top-performing properties cut this to under 5 hours through staffing optimization and parts pre-positioning. Every additional hour a room is out of service costs $180–$320 in lost revenue (class-dependent). For a 500-room hotel with 100 monthly work orders, cutting MTTR from 10 hours to 5 hours saves $90,000 annually in room availability recovery alone.
5
Guest Complaint Rate (per 1,000 room nights)
Target: 2.8–4.2 per 1,000
Engineering-related complaints (room temperature, water, plumbing, amenities) directly correlate with repeat bookings and online ratings. A property with 8.1 complaints per 1,000 nights is losing ~$280,000 annually in lost revenue compared to one at 3.2. These complaints are entirely preventive—they signal that PM schedules are being deferred. Tracking this KPI keeps engineering accountability tied to guest outcomes, not just ticket closure rates.
Hotel Maintenance KPI Platform — OxMaint
Know Your Maintenance Health Score. Measure What Actually Drives Revenue.
OxMaint tracks PM compliance, equipment uptime, cost-per-occupied-room, and guest complaint rates across all your properties — and shows you which KPI moved the needle this month.
KPI Benchmarks by Hotel Class — Where Does Your Property Stand?
Hotel maintenance KPI performance varies dramatically by property class and age. The table below shows median performance across 200+ US hotels alongside top-quartile targets and the specific maintenance driver behind the gap. Use this as your baseline.
Hotel Class
Avg PM Compliance
Avg CPOR
Top-Quartile CPOR
Primary KPI Lever
Luxury / 5-Star
81%
$11.40
$7.20
PM interval optimization + parts inventory management
The Cost of Skipped Maintenance — What Deferred PM Really Costs Hotels
Every deferred hotel maintenance task has a downstream guest impact and cost multiplier that far exceeds the PM itself. The comparison below shows five common hotel failures and their true cost when PM is deferred, based on hospitality industry repair benchmarks and occupancy loss data.
Guest Room AC/Heating System
Deferred maintenance cycle (3+ months)
PM cost if done on schedule
$180
Emergency repair + service call
$2,400–$4,800
Lost room revenue (out of service)
$600–$1,200
Cost multiplier
16–33×
Hot Water System / Boiler
Missed flush / inspection
PM cost if done on schedule
$240
Heat exchanger failure / replacement
$8,000–$16,000
Guest outages + complaints
3–8 days
Cost multiplier
33–66×
Elevator Maintenance
Skipped quarterly inspection
PM cost (quarterly service)
$520
Emergency repair + parts
$5,200–$12,000
Property access downtime + guest safety liability
Severe
Cost multiplier
10–23×
We were operating 28 properties with no standardized KPI tracking — just reaction to guest complaints. After implementing OxMaint's KPI dashboard focusing on PM compliance and CPOR, we got all 28 properties to 94% compliance within 6 months. Combined cost-per-occupied-room dropped from $9.20 to $6.40 across the portfolio. That's $2.8 million in annual savings. The real win was eliminating emergency repair calls — our staff went from firefighting 20 times a month to 3.
— Director of Engineering, 28-property Upscale Hotel Chain, Southeastern US, OxMaint Customer
How to Set KPI Targets for Your Property
KPI targets should never be industry averages—they should be built from your specific property class, age, occupancy rate, and operational complexity. Here's how top-performing hotel groups set targets that stick. Start with your current baseline across the five KPIs, then set monthly improvement targets that are ambitious but achievable with the right systems and staffing.
Step 1
Measure Current Performance
Extract your last 6 months of data: PM completion dates, emergency repair costs, guest complaints by category, equipment downtime incidents. OxMaint does this automatically from your CMMS work orders.
Step 2
Benchmark Against Your Class
Find where your hotel sits relative to top-quartile properties in your category. If you're 10% below average on PM compliance, that's your highest-leverage opportunity first.
Step 3
Set 90-Day KPI Targets
Realistic targets improve 2–4% per KPI per quarter if you have systems and accountability. Don't jump from 79% to 95% PM compliance in 30 days—it creates staff burnout and missed targets.
Step 4
Track Weekly, Report Monthly
Weekly KPI reviews catch drift before it compounds. Monthly reporting to ownership ties engineering performance to business outcomes and keeps executive attention on maintenance investment ROI.
Guest Satisfaction Protection
Properties tracking PM compliance at 94%+ maintain 4.6+ star ratings and see 23% higher repeat booking rates. One deferred HVAC inspection can tank a property's online reviews for 6+ months.
Revenue Alignment
Measuring cost-per-occupied-room ties engineering directly to revenue. Hotels that do this see 12–18% improvement in property-level profitability within 18 months through optimized labour and parts procurement.
Predictable Budgeting
KPI tracking eliminates surprise emergency repair costs. Properties with 92%+ PM compliance have 34% more predictable monthly maintenance budgets and can allocate capital more strategically.
Competitive Advantage
Top-performing hotels measure KPIs that others ignore. Equipment uptime tracking, guest complaint correlation to maintenance, and CPOR optimization create competitive moats that directly impact occupancy and ADR.
Frequently Asked Questions
What is a good PM compliance percentage target for hotels?
Top-performing properties target 94–98% PM compliance. Anything below 85% creates guest-facing failures. Most hotels benchmark at 81–88% — if you're there, your highest leverage is bringing PM tasks back on schedule within 60 days.
How is cost-per-occupied-room different from total maintenance cost?
CPOR divides total maintenance by actual occupied room nights, not total capacity. A 400-room hotel at 70% occupancy has fewer occupied rooms than one at 90%, so CPOR normalizes the metric across different occupancy levels and property sizes.
How quickly does PM compliance improvement impact guest complaints?
Most hotels see measurable guest complaint reduction within 30–45 days of hitting 92% PM compliance. The lag exists because you're clearing a backlog of deferred work. Full impact compounds over 90 days as you prevent new failures.
Which KPI should we focus on first — CPOR or PM compliance?
Start with PM compliance. It drives down CPOR by preventing expensive emergency repairs. Once compliance hits 92%+, you'll naturally see CPOR drop within 60 days, and guest complaints decline within 45 days.
How do we measure equipment uptime if we don't have a CMMS?
Start tracking unplanned downtime incidents for critical systems (HVAC, hot water, elevators) by date and duration. Log guest complaints tied to equipment. OxMaint can calculate uptime once you migrate to a structured CMMS system.
Can we achieve 98%+ equipment uptime in older properties?
Yes, but it requires planned replacement investment. Hotels that hit 98%+ uptime typically have a 7–10 year asset replacement cycle and 93%+ PM compliance. Older equipment needs more frequent PM to maintain uptime targets.
What's the typical payback on KPI dashboard implementation?
Hotels implementing KPI tracking typically see $120,000–$280,000 annual savings within 12 months on a 300–400 room property through PM optimization, labour scheduling, and emergency repair reduction. Payback is usually under 6 months.
How does OxMaint calculate these KPIs from our existing CMMS data?
OxMaint connects to your CMMS via API and aggregates work order completion dates, cost data, labour hours, and guest complaint tickets. It then calculates PM compliance %, CPOR, equipment downtime, MTTR, and complaint rates automatically, updating daily.
Hotel Maintenance KPI Platform — OxMaint
Measure What Drives Revenue. Track PM Compliance, Equipment Uptime, Cost-Per-Occupied-Room.