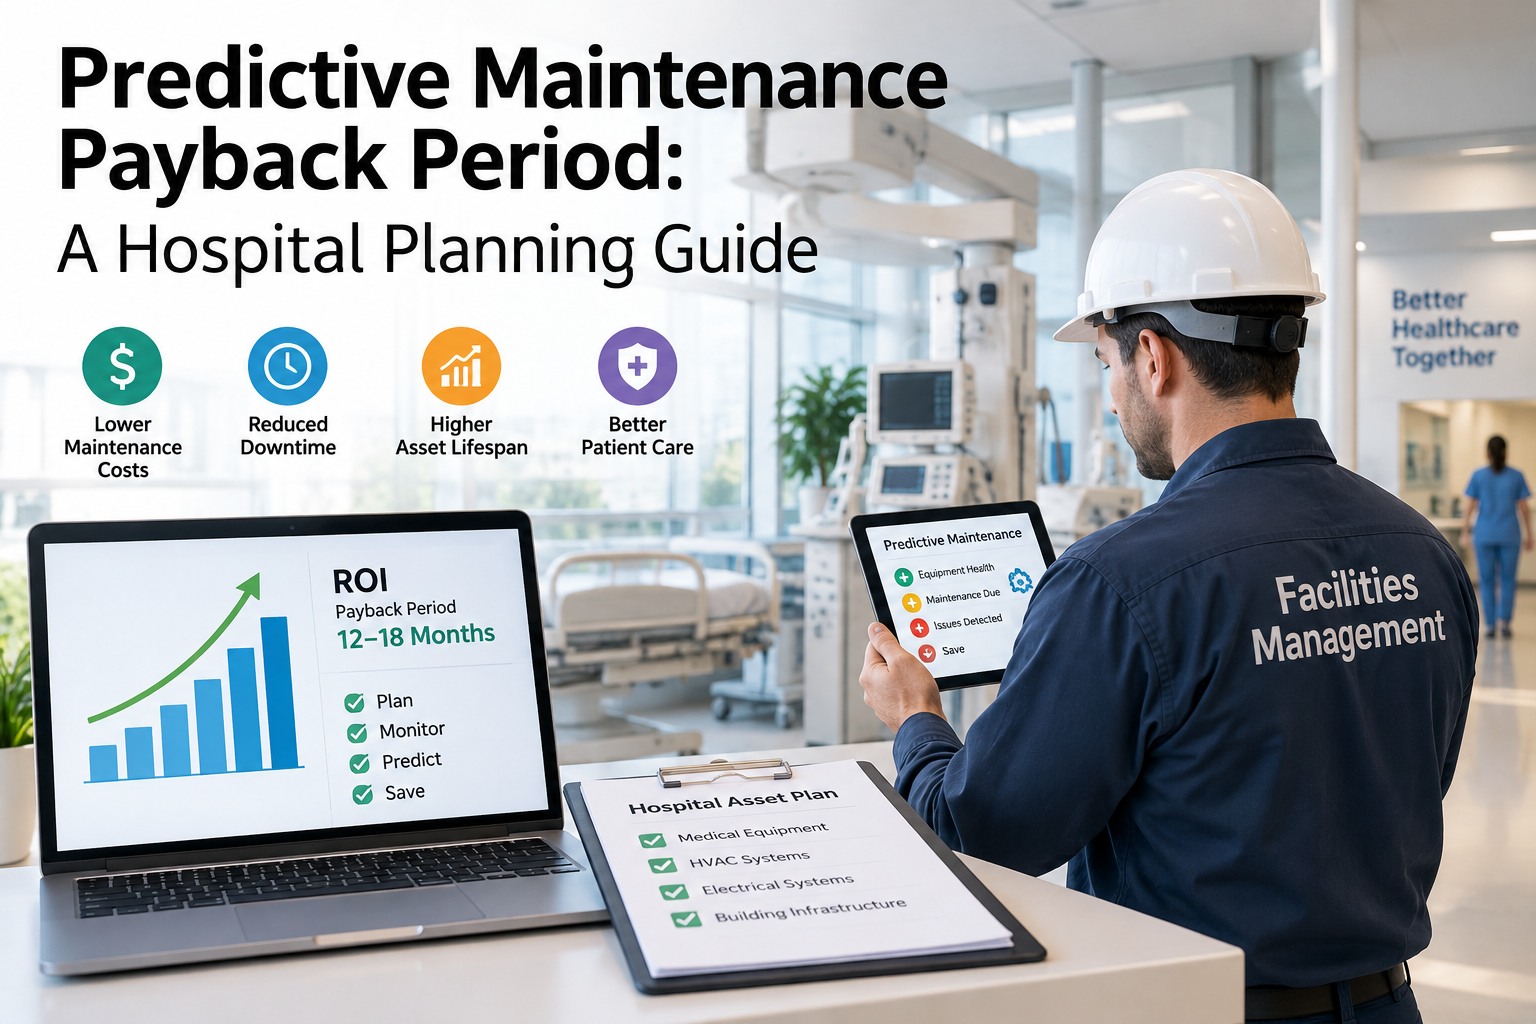
Every hospital CFO asking about predictive maintenance eventually asks the same question: "When do we break even?" It's the right question — and the honest answer is that most hospitals hit payback between month 7 and month 14, depending on asset mix, baseline downtime cost and how quickly the first predictive alerts get closed. This planning guide walks through the actual math — cost stack, formula, timeline, scenario range and the accelerators that pull the break-even point earlier — using OXMAINT AI, the AI-powered CMMS built for hospital biomed & facilities teams. No hand-waving, no vendor gloss — just the numbers a planning committee needs to sign off.
Predictive Maintenance Payback Period: A Hospital Planning Guide
Reactive fixes eat the maintenance budget — and finance keeps asking when a predictive program actually pays for itself. The honest answer depends on the workflow behind it. OXMAINT AI is the AI-powered CMMS/maintenance management software that connects that workflow on one platform: maintenance requests and inspection findings turn into logged defects, defects become prioritized work orders, and every asset gets its preventive or predictive PM cadence scheduled automatically. Each step captures the timestamped, evidence-backed data your payback model needs — so the number you take to the planning committee is grounded in your own operations, not a vendor slide.
The Cost Stack — Where Your Baseline Actually Lives
Before any payback math, you need a truthful picture of what today's reactive maintenance really costs. Most hospitals track only the top of the iceberg — labor and parts. The real baseline includes the six categories below, and OXMAINT AI's cost module captures each one as work orders close, so the "before" number in your ROI model isn't a guess. Start free and pull your own baseline cost stack in OXMAINT AI.
The Payback Formula — In One Line
Every hospital's payback comes down to the same equation. What differs across hospitals is the input values — not the math. OXMAINT AI populates the numerator from your live work-order data and the denominator from your subscription and one-time setup costs, so the payback figure updates monthly as evidence accumulates. Book a demo to see the live calculator applied to your fleet.
5 Levers That Move Your Payback Window
Two hospitals with identical bed counts can land months apart on payback — because five variables swing the equation more than any other. Understanding them lets a planning committee model both a conservative and an aggressive scenario before signing off. Sign up free and set your five levers in OXMAINT AI.
Month-by-Month Cumulative Payback Curve
The break-even line isn't a single event — it's the moment your cumulative savings curve crosses your cumulative investment curve. Below is the shape of that curve for a representative 400-bed hospital running OXMAINT AI. The steep drop at month 4 is when the first batch of predictive alerts convert to avoided failures, and the crossover at month 9 is the payback point. Book a demo to see your own curve modeled in OXMAINT AI.
A Payback Model Is Only Useful If You Can Prove It Every Month.
OXMAINT AI ties every predicted failure, avoided callout and deferred capex back to a line in the work-order record — so the ROI you promised finance is the same ROI you can defend in the next budget cycle.
Sample Hospital Payback Calculation — Line by Line
Here's the full worked example behind the curve above — a mid-size 400-bed acute-care hospital with 3,800 regulated assets across biomed, facilities and utility systems. Every input is a value you can pull from OXMAINT AI's own reports 90 days after go-live. Sign up free and generate this exact table for your hospital.
| Line Item | Category | Annual Value | Notes |
|---|---|---|---|
| Software subscription | Investment | $180,000 | Per-asset licensing, all modules |
| Integration & setup | Investment (one-time) | $95,000 | BMS/imaging feeds, historical import |
| Training & change mgmt | Investment (one-time) | $45,000 | Biomed + facilities teams |
| Year-1 Investment | $320,000 | Includes one-time costs | |
| Reduced unplanned downtime | Savings | $310,000 | 78 hrs avoided × loaded rate |
| Overtime & emergency callouts | Savings | $112,000 | 62% drop in emergency vendor spend |
| Deferred capex | Savings | $85,000 | 3 assets extended 18+ months |
| Compliance rework avoided | Savings | $48,000 | Zero survey findings on maintenance |
| Parts inventory reduction | Savings | $35,000 | Cross-site pooling & forecasting |
| Year-1 Savings | $590,000 | Net gain: $270,000 | |
3 Payback Scenarios — Range Your Committee Can Sign Off On
Boards approve ranges, not point estimates. Below are the three scenarios OXMAINT AI generates for every business case — conservative, expected and aggressive — anchored on the five levers earlier in this guide. Present all three; the committee picks the one that matches the sponsor's risk appetite. Book a demo to build these three scenarios for your hospital.
3-Year Cash Impact — What the Board Sees
Payback tells the year-1 story. The three-year cash chart is what actually gets a program renewed. OXMAINT AI tracks cumulative savings against a rolling investment baseline so the third-year renewal conversation is a data pull, not a debate. Sign up free and see your year-3 projection in OXMAINT AI.
Accelerators — How to Pull Break-Even Earlier
Every accelerator below has been observed to compress payback by 4–10 weeks. Stack two or three and a conservative model can move into the expected column; stack four and you land in aggressive territory. OXMAINT AI's onboarding playbook is built around getting as many of these live in the first 60 days as possible. Book a demo to see which accelerators fit your hospital first.
What OXMAINT AI Contributes to the Payback Math
OXMAINT AI isn't a spreadsheet exercise — it's the software that generates each of the numbers your business case depends on. Below is how the platform maps directly to every line in the ROI model. Sign up free and start your own payback timer in OXMAINT AI.
Finance signed off on a 12-month payback assumption. Because every predictive alert closed inside the platform tagged to a dollar value, we could show them month-by-month that we were tracking 2.5 months ahead of plan. The renewal conversation in year two took eleven minutes.
Frequently Asked Questions
Model the Payback. Prove It Monthly. Renew It Automatically.
OXMAINT AI gives hospital finance & facilities leaders a payback business case with numbers that hold up in budget review — and a live scorecard that keeps proving them long after the model is signed off. Start free, or book a walkthrough with a hospital-focused engineer.