Last-mile delivery fleets face some of the harshest duty cycles in commercial transportation — stop-and-go urban traffic, 150+ daily door operations, and high mileage accumulation that accelerates wear on brakes, suspensions, liftgates, and powertrains. Effective last-mile delivery maintenance demands a shift from reactive repairs to predictive, data-driven preventive scheduling that keeps every vehicle revenue-ready. This guide breaks down the maintenance strategies high-frequency delivery operators are using in 2026 to cut downtime, control costs, and extend fleet life — and shows how OxMaint makes the transition from spreadsheets to a fully automated CMMS seamless. Ready to modernize your maintenance operation? Start Free Trial or read on for the full framework.
Is your last-mile fleet bleeding revenue from preventable breakdowns?
High-frequency delivery vehicles rack up wear 3–4x faster than standard highway trucks. Every unplanned roadside failure costs an average of $760 in towing, lost revenue, and customer credits — before the repair bill. The right maintenance strategy turns that loss line into a competitive advantage.
Why last-mile delivery vehicles wear differently — and faster
A standard Class 3–6 delivery van operating in dense urban routes experiences duty-cycle stress that standard PM schedules simply weren't designed for. Understanding these failure accelerators is the first step in building a last-mile maintenance guide that actually protects your assets.
Stop-and-Go Duty Cycles
Urban routes average 8–15 stops per hour. Brake pad life drops to 25,000–35,000 miles (vs. 70,000+ on highway routes), and transmission fluid degrades 40% faster due to thermal cycling.
High-Frequency Door Operation
Rear and side doors cycle 100–200 times daily per vehicle. Hinge pins, rollers, and liftgate components wear out 5x faster than manufacturer baselines, creating cascading mechanical failures.
High Daily Mileage Accumulation
Last-mile vans covering 120–200 miles daily hit critical PM thresholds (oil, tires, driveline) in weeks, not months. Calendar-based PM schedules miss fast-accumulating wear, leaving gaps.
Idling & DPF Stress
Extended curb-time idling in diesel vans accelerates DPF clogging and oil contamination. Without mileage-plus-engine-hour tracking, soot-loading failures strike between scheduled services.
The 2026 last-mile delivery fleet maintenance checklist
Shift from calendar-based oil changes to a mileage- and condition-triggered PM framework. This tiered checklist reflects the actual failure patterns of high-frequency delivery fleets operating in urban environments.
-
Tire pressure & tread depth — urban curbing destroys sidewalls; maintain 5/32" minimum.
-
Door hardware & liftgate function — inspect rollers, cables, and hydraulic fluid levels.
-
Fluid levels & leaks — coolant, oil, transmission, brake fluid under hood.
-
Lighting & backup camera — DOT compliance critical in urban environments.
-
Brake inspection (pads, rotors, calipers) — expect 30–50% shorter life on stop-and-go routes.
-
Oil & filter change — switch to synthetic blends for thermal stability in city traffic.
-
Suspension & steering components — pothole damage accelerates bushing and tie-rod wear.
-
DPF regeneration status (diesel) — log soot load; schedule forced regen before 80% capacity.
-
Transmission fluid analysis — send samples for spectroscopy; flag metal content early.
-
Liftgate structural & hydraulic service — pressure-test cylinders, replace seals, inspect mounts.
-
Alignment & tire rotation — correct camber from curb impacts; extend tire life 15–20%.
-
Battery & alternator load test — frequent door/drawer cycling drains auxiliary batteries faster.
What poor last-mile maintenance costs a delivery fleet
Reactive maintenance isn't just inconvenient — it's a measurable drain on margin. Here's what the math looks like for a typical 50-van last-mile operation running 6 days a week.
A 50-vehicle last-mile fleet averaging 3.2 breakdowns per vehicle per year, with each event costing $760 in direct expense plus $1,200 in lost delivery revenue and customer credits, loses $313,600 annually to unplanned failures. Implementing condition-based preventive maintenance typically cuts that breakdown rate by 40–60%, recovering $125,000–$188,000 per year — easily justifying a CMMS investment that costs a fraction of that figure.
| Cost Category | Reactive Fleet (Annual) | With CMMS + Predictive PM | Savings |
|---|---|---|---|
| Unplanned roadside breakdowns (50 vans) | $121,600 | $48,640 | 60% reduction |
| Towing & emergency repair premiums | $38,400 | $11,200 | 71% reduction |
| Lost revenue & customer credits | $153,600 | $61,440 | 60% reduction |
| Premature tire & brake replacement | $54,000 | $37,800 | 30% reduction |
| Total Annual Maintenance-Driven Cost | $367,600 | $159,080 | $208,520 saved |
How OxMaint transforms last-mile fleet maintenance from reactive to predictive
OxMaint's AI-powered CMMS and EAM platform is built to handle the exact challenges high-frequency delivery fleets face — rapid asset wear, tight route schedules, and zero tolerance for downtime. Here's how four core capabilities map directly to your last-mile maintenance outcomes.
Predict failures before they sideline a route
OxMaint's predictive engine analyzes mileage, engine hours, vibration data, and historical work orders to flag components approaching failure — triggering work orders automatically before a breakdown occurs. Outcome: Cut unplanned downtime 30–50% and eliminate the $760-per-event breakdown cost.
Replace paper work orders with mobile-first digital flow
Drivers and technicians capture defects via the OxMaint mobile app at the route level — photos, fault codes, and mileage auto-populate work orders. Shop supervisors triage in real time. Outcome: Eliminate paper work orders, cut admin time by 70%, and close the communication gap between drivers and the shop floor.
Track every van, liftgate, and spare part in one system
Maintain a complete asset hierarchy — vehicle, engine, transmission, liftgate, and door assemblies — with full service history. Real-time spare-parts inventory ensures high-wear items (brake pads, DPF filters, hydraulic seals) are always in stock. Outcome: Reduce parts stockouts by 80% and extend asset life by 15–25% through complete service visibility.
Prove compliance and benchmark fleet health with live KPIs
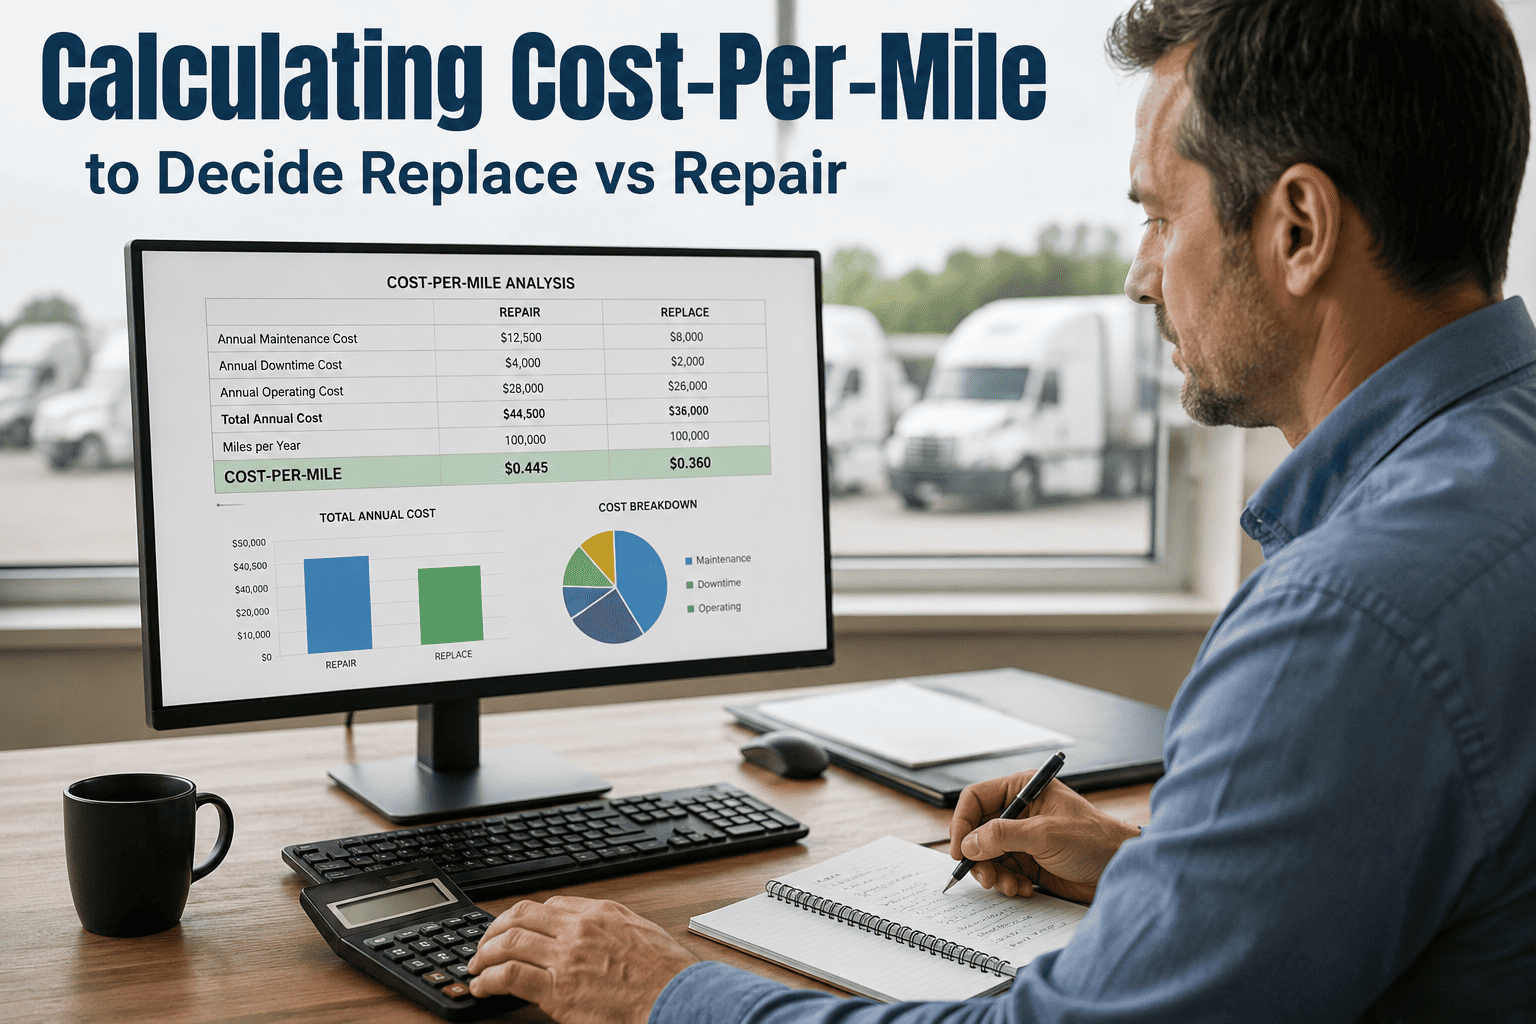
Dashboards track MTBF, MTTR, PM compliance rate, and cost-per-mile in real time. FMCSA and DOT audit records are auto-generated from completed work orders. Outcome: Pass audits without manual paperwork, benchmark best/worst-performing routes, and make data-backed replacement decisions.
See OxMaint on your delivery fleet — book a 30-minute demo
Watch how AI-driven preventive maintenance, mobile work orders, and real-time analytics keep your last-mile vehicles on the road and your delivery margins intact.
Last-mile delivery fleet maintenance — frequently asked questions
How often should last-mile delivery vehicles be serviced?
Most last-mile delivery vans operating in stop-and-go urban traffic should follow a mileage-based PM schedule of every 5,000–7,500 miles for oil and inspections, rather than time-based intervals. High-frequency door operation and curb impacts mean brake, tire, and suspension checks should happen at every PM interval, with full quarterly deep inspections covering transmission analysis and liftgate hydraulics.
What is the biggest maintenance challenge for last-mile delivery fleets?
The biggest challenge is accelerated wear from stop-and-go duty cycles combined with high daily mileage. Brake pads last only 25,000–35,000 miles, liftgate components cycle 100–200 times daily, and engine hours accumulate faster than mileage alone reflects. A modern CMMS like OxMaint solves this by tracking both mileage and engine hours to trigger PM automatically — see how it works when you Book a Demo.
How much does fleet maintenance software cost for a delivery fleet?
CMMS pricing for last-mile fleets typically ranges from $30–$80 per vehicle per month, depending on features and fleet size. A 50-van fleet investing $18,000–$48,000 annually in a platform like OxMaint can recover $125,000–$200,000+ in avoided breakdowns, towing, and lost revenue — delivering payback in under 3 months.
Can I switch from spreadsheets to a CMMS without disrupting operations?
Yes. OxMaint is designed for rapid onboarding — import existing asset lists, PM schedules, and parts data, then deploy the mobile app to drivers and technicians in days, not months. Most last-mile fleets are fully operational within 2–4 weeks, with the platform running alongside existing processes during transition. You can Start Free Trial to test the workflow on a small group first.
What KPIs should a last-mile fleet track for maintenance performance?
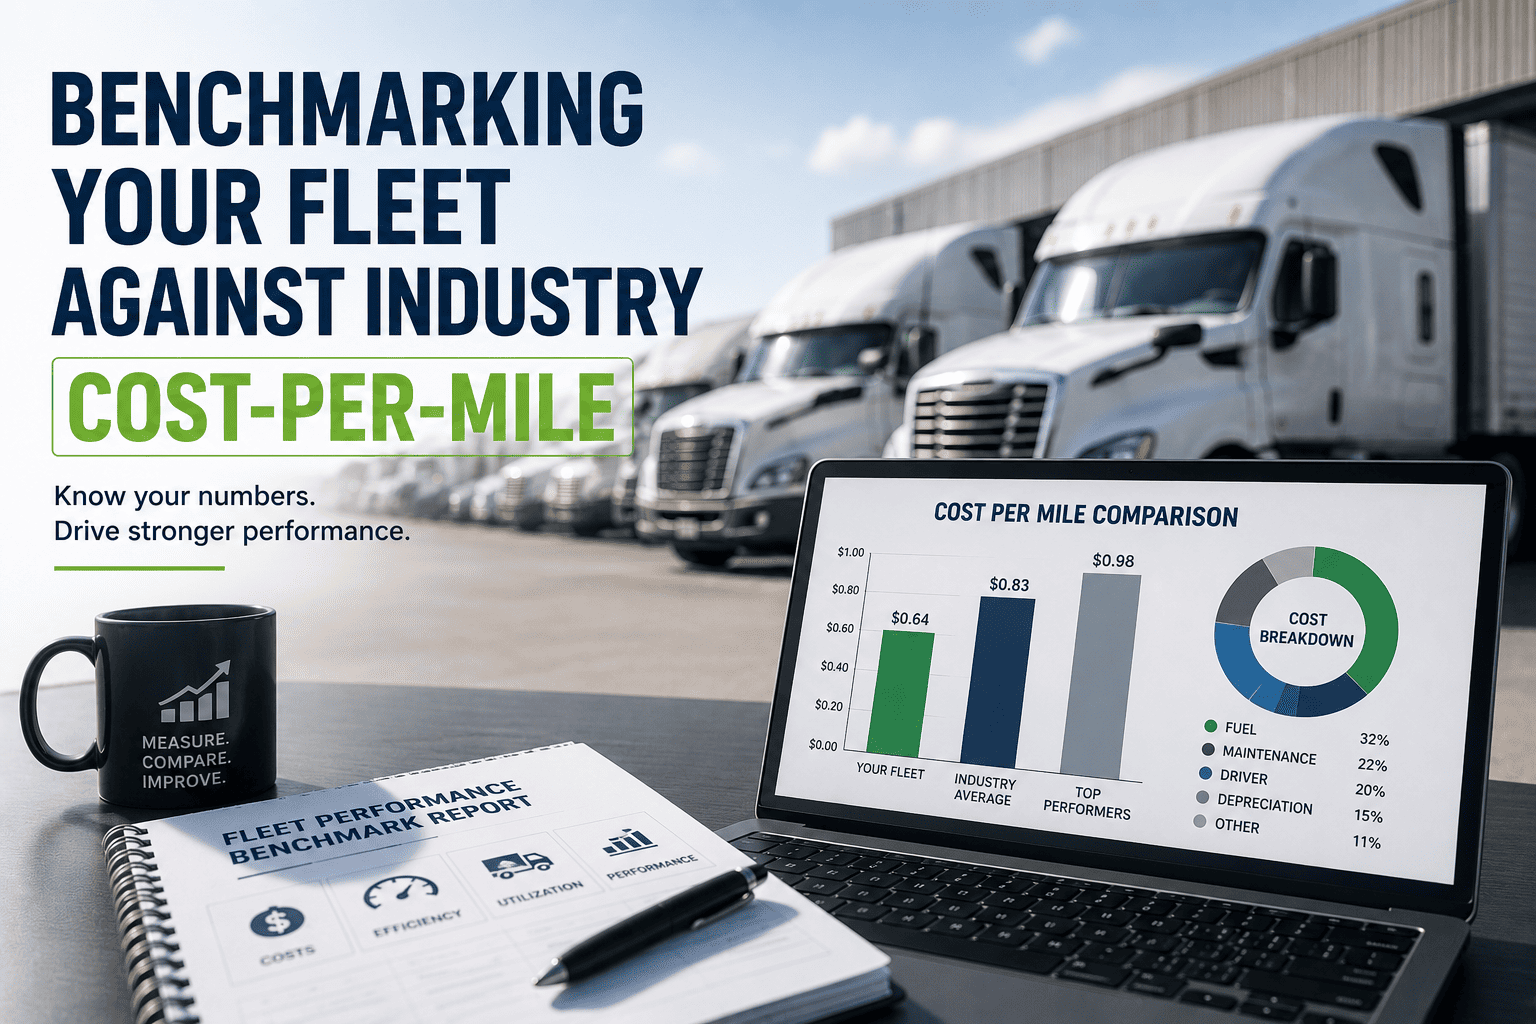
The five most critical KPIs are PM Compliance Rate (target 95%+), Mean Time Between Failures (MTBF), Mean Time to Repair (MTTR), Cost per Mile, and Vehicle Downtime as a percentage of available hours. Tracking these in real time through OxMaint's analytics dashboard lets fleet managers spot failing routes, compare vehicle performance, and prove FMCSA/DOT compliance without manual reporting.
Stop losing routes to preventable breakdowns
Join the last-mile fleets using OxMaint to predict failures, automate PM scheduling, and keep every van delivery-ready. Book a demo or start your free trial today.
Free 14-day trial · No credit card