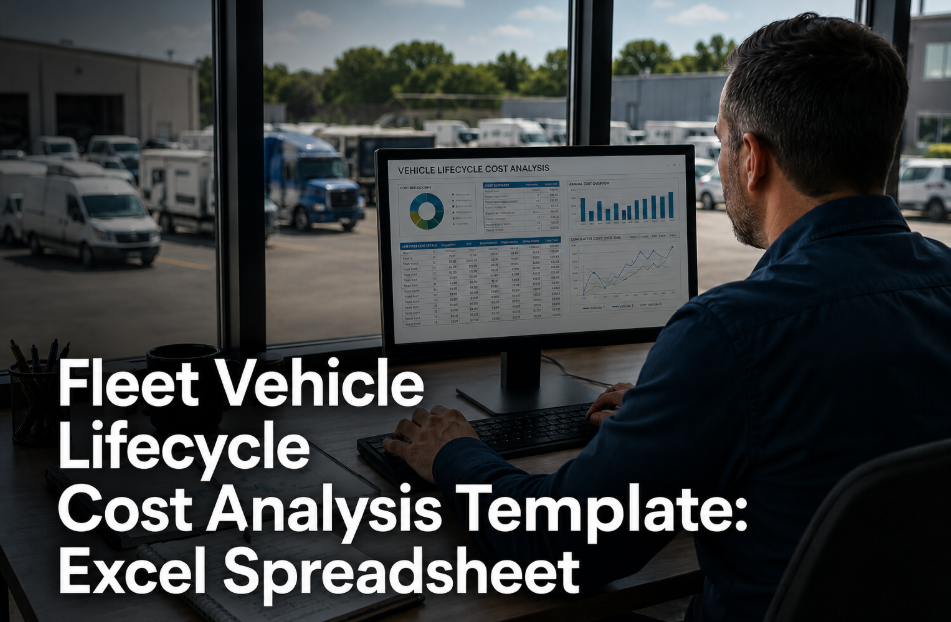
A regional utility contractor kept a bucket truck running for nine years because replacing it always felt like the more expensive choice. Each repair was small enough to approve without a second thought — a starter here, a hydraulic line there — until the shop invoice crossed $14,000 for the year on a truck worth barely $9,500 at trade-in. Nobody was tracking cost per mile, so nobody saw the crossover point coming until the truck failed on a job site and cost three days of missed service calls. A single cost-per-mile dashboard would have flagged that truck eighteen months earlier, and fleets that track this number properly save six figures across a dozen similar units — see how at Oxmaint.
Vehicle Preventive Maintenance / Lifecycle Cost Per Mile
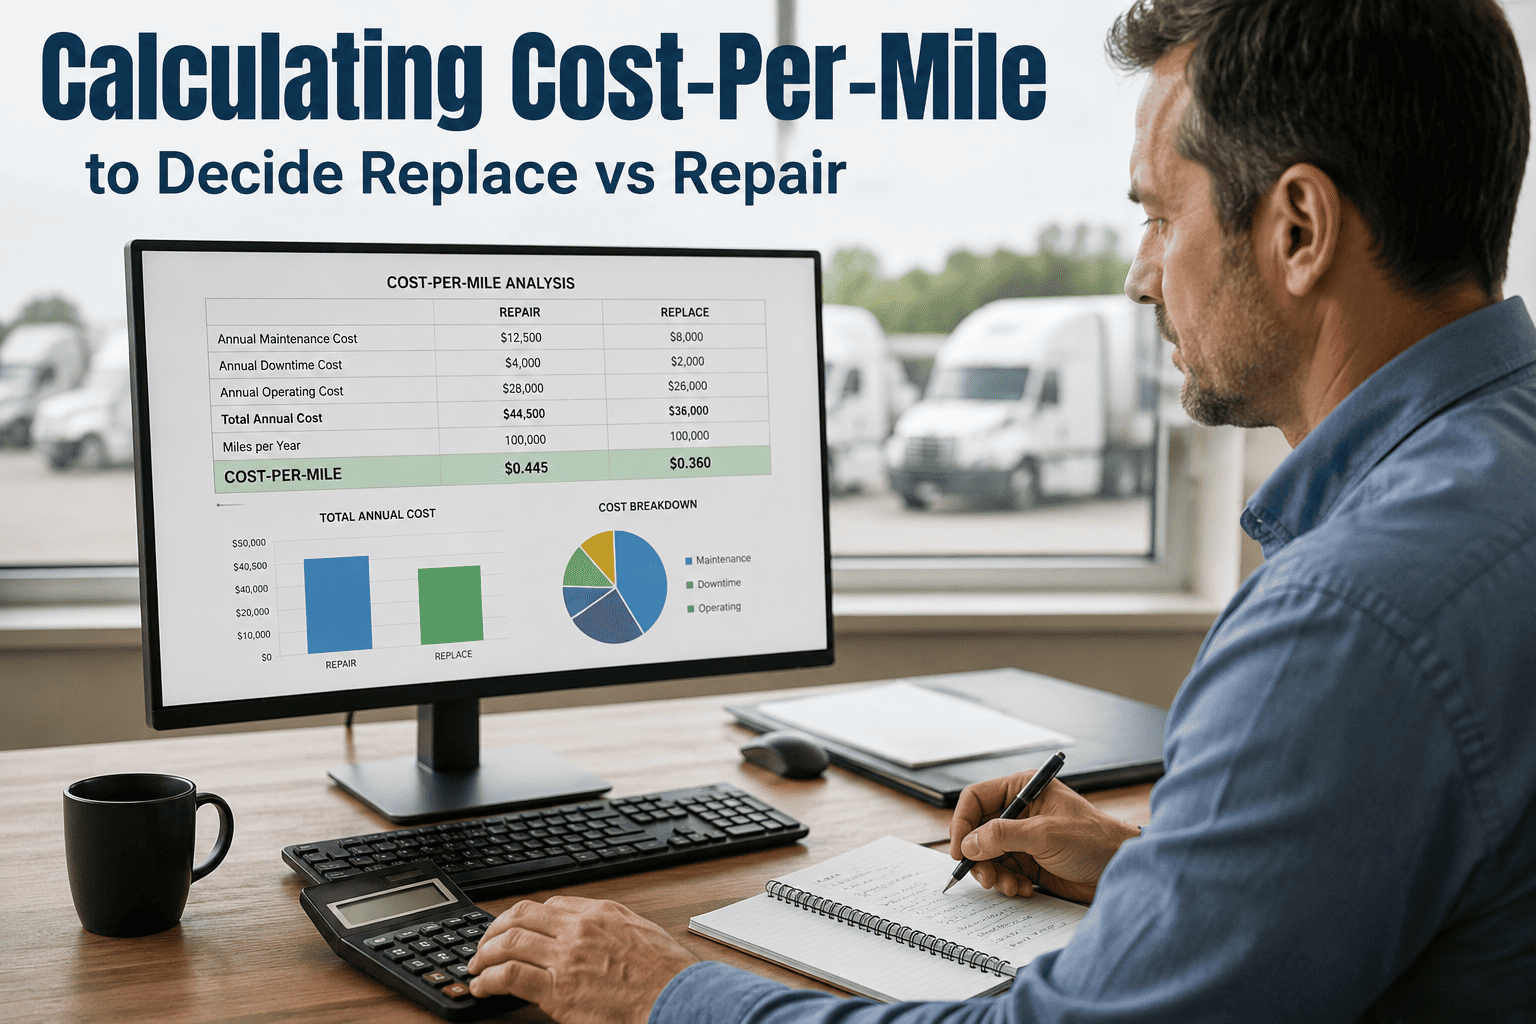
Calculating Cost Per Mile to Decide Replace vs Repair
Cost per mile is the one number that combines fuel, repairs, depreciation, insurance, and downtime into a single figure — and the point where that figure exceeds the replacement threshold is the point where every extra month of ownership actively costs money.
$0.202
ATRI industry average maintenance cost per mile, 2026
35%
Higher cost per mile for vehicles over 10 years old — Fleetio Benchmark Report
80%
Of fleet managers replace vehicles 8+ months after the crossover point
50/30/20
The industry-standard rule for setting a repair vs replace threshold
Fleet Cost Intelligence
Know the Exact Mile Your Truck Starts Costing You Money
Oxmaint calculates cost per mile automatically from every work order — no spreadsheets, no manual entry — and flags vehicles approaching their class threshold before a routine repair turns into a capital emergency.
What Cost Per Mile Actually Measures
Cost per mile, or CPM, is total operating cost divided by miles driven — but the number is only useful when every cost is included, not just the repair invoice. Fuel, scheduled maintenance, unscheduled repairs, depreciation, insurance, and the dollar value of downtime all belong in the calculation. Fleets that track only invoice totals are working with an incomplete picture and end up making a six-figure capital decision on partial data. Watch the trend, not the single number — CPM typically falls as a vehicle spreads its acquisition cost over more miles, then climbs again once repairs, inefficiency, and downtime start compounding.
Six Cost Components That Build an Accurate Cost-Per-Mile Figure
01
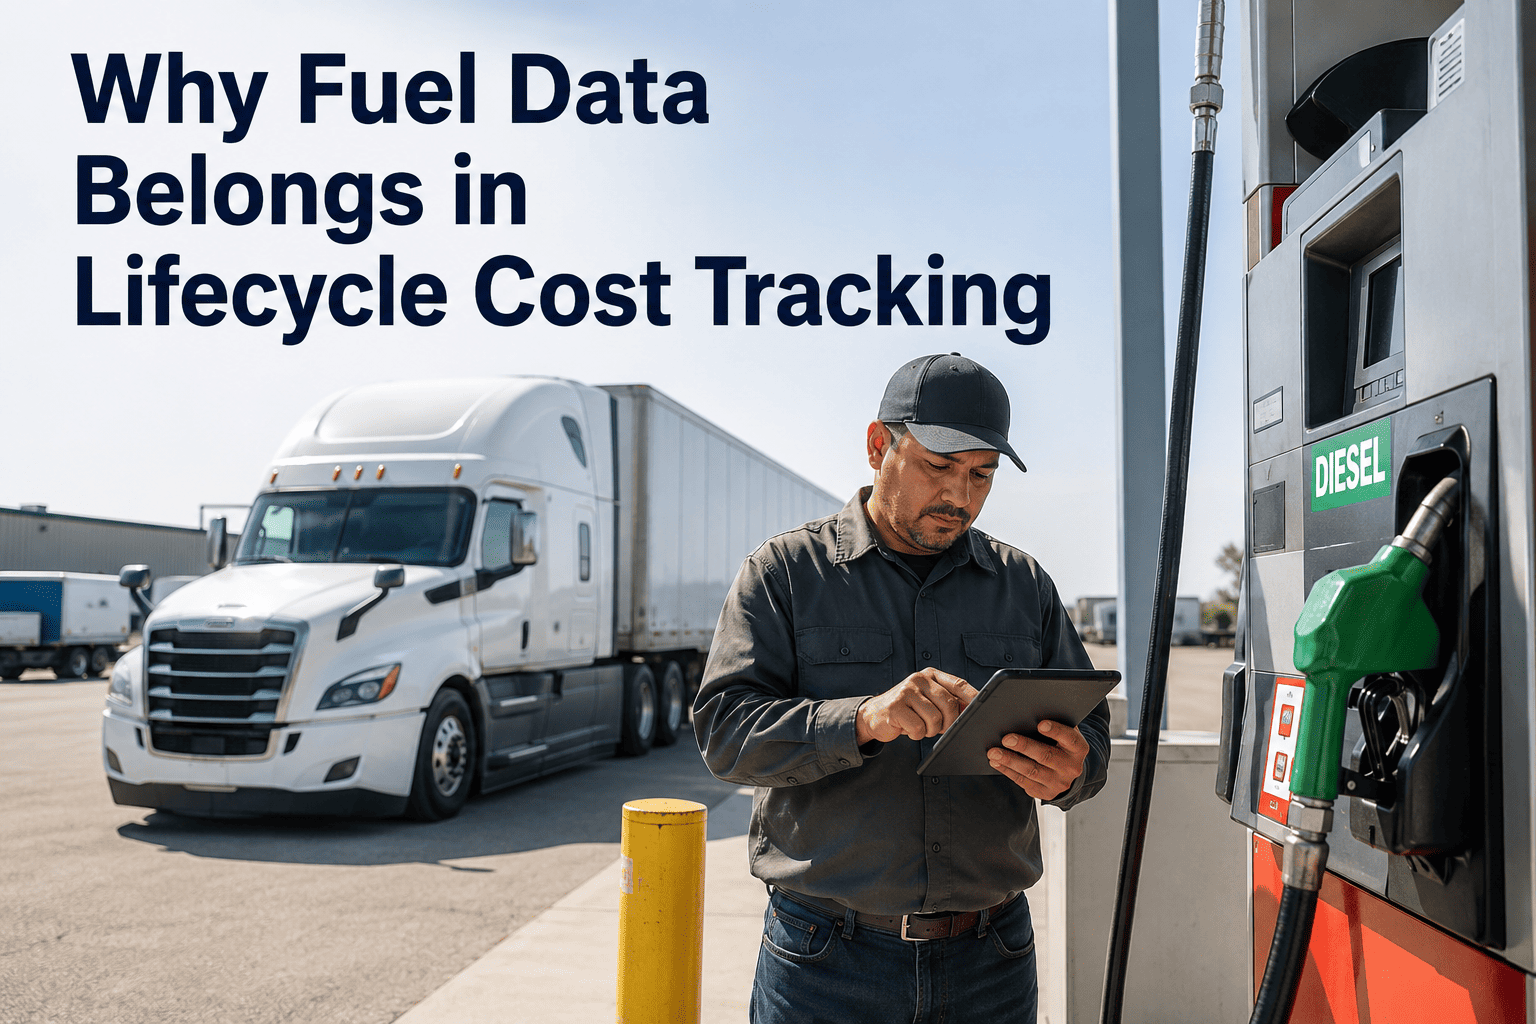
Fuel Cost Per Mile
Pulled from fuel cards or receipts and divided by monthly miles. A dropping mpg trend on a specific vehicle is often the earliest sign of an aging engine, well before a repair ticket is opened.
02
Maintenance and Repair Cost
Parts, labor, and vendor invoices from every work order — planned and reactive. Reactive repairs should always cost more than planned ones; if they do not, the preventive program is not doing its job.
03
Depreciation Per Mile
A vehicle can lose 20 to 25 percent of its value in the first year alone. Depreciation is steep early and flattens after four to five years, which is exactly when rising repair cost starts eating the savings.
04
Downtime Cost Per Mile
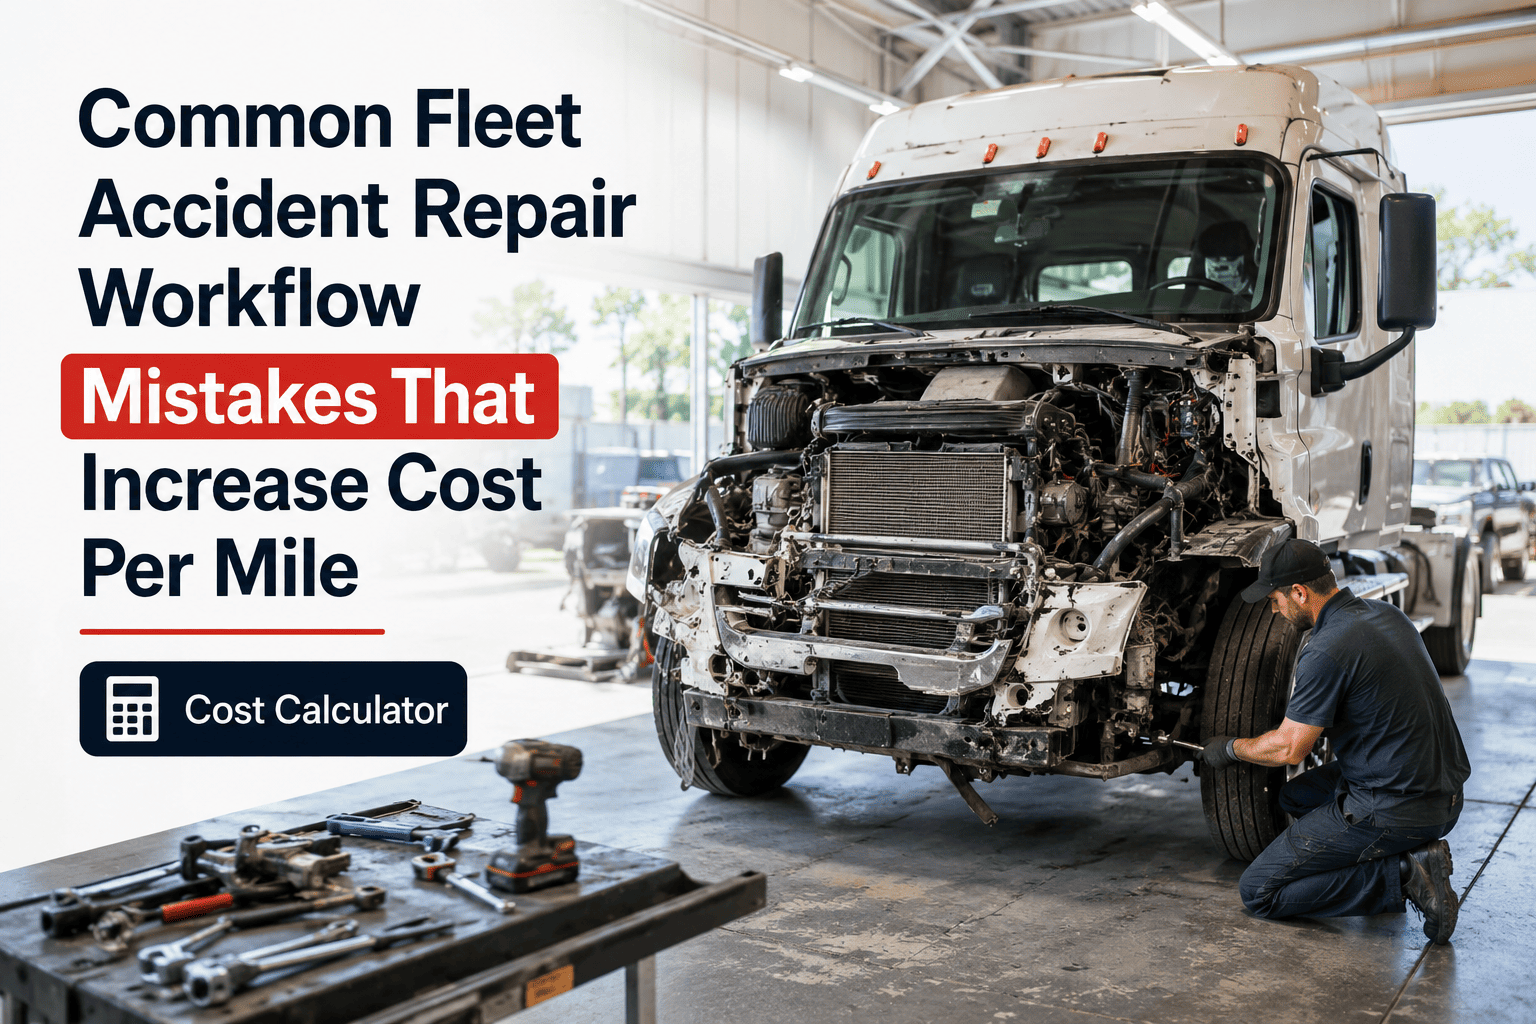
Every day a vehicle sits in the shop costs an estimated $448 to $760 in lost productivity. Most fleets never convert this to a dollar figure, which quietly understates the true cost of holding onto an aging unit.
05
Insurance and Admin Overhead
Premiums, licensing, and administrative processing add a steady baseline cost per mile that rarely changes with age — but becomes a larger share of total cost as a vehicle's other expenses climb.
06
Indirect and Hidden Costs
Towing, rental coverage, missed delivery penalties, and rushed overtime labor add 35 to 45 percent on top of direct parts and labor cost — and most fleets do not track this category at all.
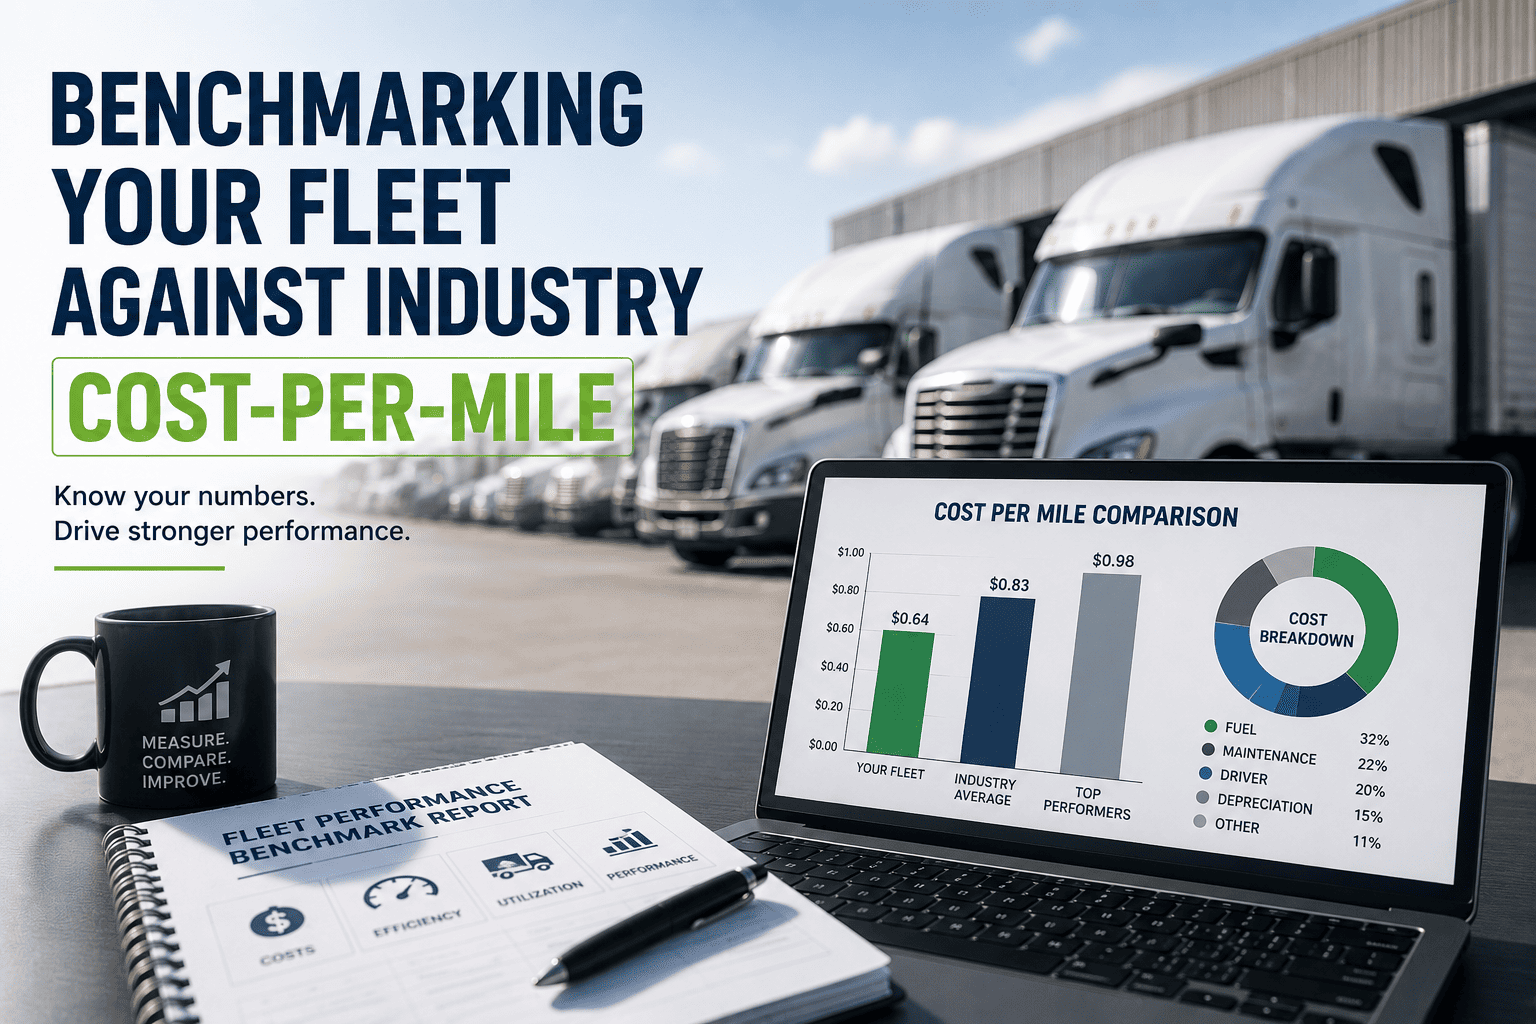
Cost-Per-Mile Benchmarks by Fleet Type and Vehicle Age
These industry figures give a starting reference point — but class-specific thresholds refined against your own work order data will always be more accurate than a national average.
| Fleet Type or Age Band |
Cost Per Mile |
Source / Context |
| Well-maintained Class 8 fleet |
$0.12 – $0.18 |
Best-in-class maintenance discipline |
| Industry average, all commercial vehicles |
$0.202 |
ATRI 2026 — 8.9% of total operating cost |
| Construction fleets |
$0.23 |
Heavier duty cycles, off-road wear |
| Trucking and logistics fleets |
$0.31 |
Total CPM including all operating costs |
| Vehicles under 5 years old |
$0.20 |
Low maintenance burden, within warranty |
| Vehicles over 10 years old |
$1.10 |
5.5x higher than newer vehicles — component failure zone |
Four Signals That the Replacement Crossover Has Arrived
01
A Single Repair Exceeds 50% of Vehicle Value
The core of the 50/30/20 rule, recognized as a practical standard by the U.S. Department of Defense for government fleet operations. Past this line, repair math no longer favors keeping the asset.
02
Annual Maintenance Reaches 30% of Vehicle Value
The early-warning mark. Fleet studies show that once annual maintenance hits this level, expenses typically double within twelve months and can triple within three years.
03
Three or More Major Repairs in 12 Months
The clearest operational signal that reliability, not just cost, has crossed the threshold. Repeat failures on the same system point to a component nearing end of life.
04
Cost Per Mile Rises 10% or More Year-Over-Year
A rising CPM trend line is the earliest indicator available — it shows up in the data months before a catastrophic failure forces the decision to be made in an emergency.
Automated Threshold Alerts
Stop Waiting for the Breakdown to Tell You What the Data Already Knows
Every work order in Oxmaint feeds a live cost-per-mile calculation at the vehicle, class, and fleet level — with automatic alerts the moment a unit crosses its replacement threshold.
How Oxmaint Turns Work Orders Into a Replacement Decision
Most fleets know they should track cost per mile — few actually do it consistently, because pulling fuel, labor, parts, and downtime into one figure by hand does not scale past a handful of vehicles. Oxmaint builds the calculation automatically from data your team is already entering.
01
Automatic CPM at Every Level
Fuel cards, parts invoices, and labor hours roll into cost-per-mile figures per vehicle, per class, and fleet-wide the moment a work order closes — no spreadsheet maintenance required.
02
Threshold Alerts Before Crisis
Vehicles approaching the 30% or 50% value threshold are flagged in real time, giving fleet managers months of runway to plan capital instead of reacting to a breakdown.
03
Downtime Converted to Dollars
Every shop day is tied to an estimated productivity loss and added to the repair invoice, so the replacement decision reflects total impact, not just the parts and labor line.
04
Finance-Ready Justification Reports
Cost trend history, threshold breach dates, and projected savings export into a report built for capital budget approval — the case is made with data, not a gut feeling.
Spreadsheet Tracking vs No Tracking vs Oxmaint
| Outcome |
No CPM Tracking |
Manual Spreadsheet |
Oxmaint Automated CPM |
| Replacement timing accuracy |
Age or gut feel — 8+ months late on average |
Depends on who remembers to update it |
Real-time alert at threshold breach |
| Downtime included in cost |
Rarely quantified |
Manual estimate, often skipped |
Auto-converted to dollar impact |
| Data source |
Memory and paper invoices |
Manually re-typed from invoices |
Pulled automatically from work orders |
| Capital budget justification |
Difficult to defend to finance |
Time-consuming to assemble |
Exportable report, ready in minutes |
| Typical cost outcome |
$4,000+ excess cost per late replacement |
Inconsistent across fleet |
25–35% lower cost per vehicle |
The Return on Tracking Cost Per Mile
$340K
Saved in one CapEx cycle
An 86-vehicle fleet stopped replacing on a flat 7-year rule and let CPM data decide instead
$4,000+
Excess cost per late replacement
The average overspend when TCO already exceeds resale value before action is taken
25–35%
Lower cost per vehicle
Achieved through preventive optimization and real-time cost tracking
5.5x
Cost multiplier past year 10
What tracking CPM early is designed to help you avoid paying
Frequently Asked Questions
How do I calculate cost per mile for a single vehicle?+
Add fuel, maintenance, insurance, and an estimated downtime value for a given period, then divide by miles driven in that period. Track it monthly per vehicle rather than as a one-time snapshot.
Oxmaint calculates this automatically from existing work order data.
Is the 50/30/20 rule accurate for every vehicle class?+
It is a reliable starting framework, not an absolute rule. A truck on predictable routes with an in-house parts supply may justify operating past the threshold, while a unit serving tight delivery windows may warrant earlier replacement.
Does age or mileage matter more for replacement timing?+
Research increasingly points to age as the stronger driver of maintenance cost per mile, since the oldest and most expensive vehicles are often retired earliest, skewing mileage-based comparisons. Use both alongside actual cost trend data.
What is the difference between replacement and refurbishment?+
Refurbishment rebuilds a structurally sound chassis with a worn powertrain or body for a fraction of replacement cost — a useful middle option for custom-upfitted units that still have usable life left.
How does Oxmaint help defend a replacement decision to finance?+
Oxmaint exports a report showing cost trend history, the date the threshold was breached, and projected savings — turning a capital request into a data-backed case.
Book a demo to see a sample report.
Lifecycle Cost Intelligence — Oxmaint
Let the Mile, Not the Calendar, Decide When to Replace
Automatic cost-per-mile tracking, threshold alerts, downtime-to-dollar conversion, and finance-ready reports — everything a fleet manager needs to catch the crossover point before it becomes a budget crisis.