
Fleet utilization optimization is the practice of measuring how hard every vehicle and asset actually works — then redeploying the underused ones to where they earn their keep instead of sitting idle while another site rents capacity. Most fleets discover that 15–30% of their assets run below 40% utilization, quietly burning capital, insurance, registration and maintenance budget. This guide breaks down how to measure fleet utilization rate, spot underused fleet assets, redeploy them across locations, and build a fleet utilization strategy that turns idle iron into productive capacity. If you want to see your own utilization data in a live dashboard, Start Free Trial with OxMaint and track every asset in minutes.
============ HERO: HOOK QUESTION VARIANT ============How much of your fleet is actually earning its keep?
Industry benchmarks show the average fleet runs at only 55–65% true utilization — meaning a third of your capital sits parked while other locations rent trucks, pay overtime, or delay jobs. OxMaint gives you the utilization tracking, cross-location visibility and redeployment workflow to fix it.
What underused fleet assets really cost you
A single underutilized vehicle doesn't just sit — it depreciates, draws insurance, registration, parking and preventive maintenance budget. Multiply that across a 100-asset fleet and the numbers get uncomfortable fast.
Worked example: a regional services fleet with 120 vehicles finds 22 units running under 35% utilization. Carrying cost alone = 22 × $9,600 ≈ $211K/year. Redeploying 12 of them to a high-demand site that was renting at $180/day saves another $56K/year — and defers two planned purchases worth $140K. Total swing: $400K+ from data they already had but weren't acting on.
How to calculate fleet utilization rate (and what "good" looks like)
You can't optimize fleet utilization you don't measure. The core formula is simple — the discipline is tracking it per asset, per site, per month so redeployment decisions rest on data, not gut feel.
| Utilization Band | Rate | What It Means | Action |
|---|---|---|---|
| Optimal | 70–85% | Asset is earning its keep with healthy buffer for PM | Keep; monitor PM compliance |
| Watch | 50–69% | Usable but slack — candidate for shared use | Pool across crews or shifts |
| Underutilized | 30–49% | Carrying cost likely exceeds value delivered | Redeploy to a high-demand site |
| Idle / Surplus | <30% | Actively draining capital | Redeploy, sell, or return from lease |
Benchmarks vary by asset class — a standby generator may legitimately run at 5%, while a delivery van should exceed 70%. OxMaint lets you set utilization targets per asset class so the right alerts fire for the right equipment.
A 5-step fleet asset redeployment workflow that actually sticks
Most fleets know they have underused assets — what they lack is a repeatable process to move them. This is the fleet utilization redeployment workflow high-performing operations follow, and it's built directly into OxMaint.
Flag underutilized assets automatically
Set utilization thresholds per asset class (e.g. alert when a vehicle runs under 40% for 60 days). OxMaint's analytics engine surfaces the list — no spreadsheet hunting.
Verify condition & maintenance status
Before moving an asset, confirm it's PM-compliant and roadworthy. Pull its full service history, open work orders and upcoming PM from the CMMS in one click.
Match to demand across locations
Cross-location visibility shows which site is renting, running overtime, or queuing jobs. Match the surplus asset to the real demand — not the loudest request.
Execute the transfer with a digital paper trail
Reassign the asset's location, custodian, PM schedule and warranty in OxMaint. The transfer is logged, auditable and updates every downstream report automatically.
Re-measure after 30–60 days
Confirm the redeployed asset now runs above target utilization. If it doesn't, the data tells you whether the demand was real or the asset is truly surplus and should be sold.
Turn fleet utilization data into capital efficiency with OxMaint
OxMaint is an AI-powered CMMS + EAM platform that connects utilization tracking, maintenance history and cross-location asset visibility in one system — so redeployment decisions happen in days, not quarters.
Real-time utilization tracking
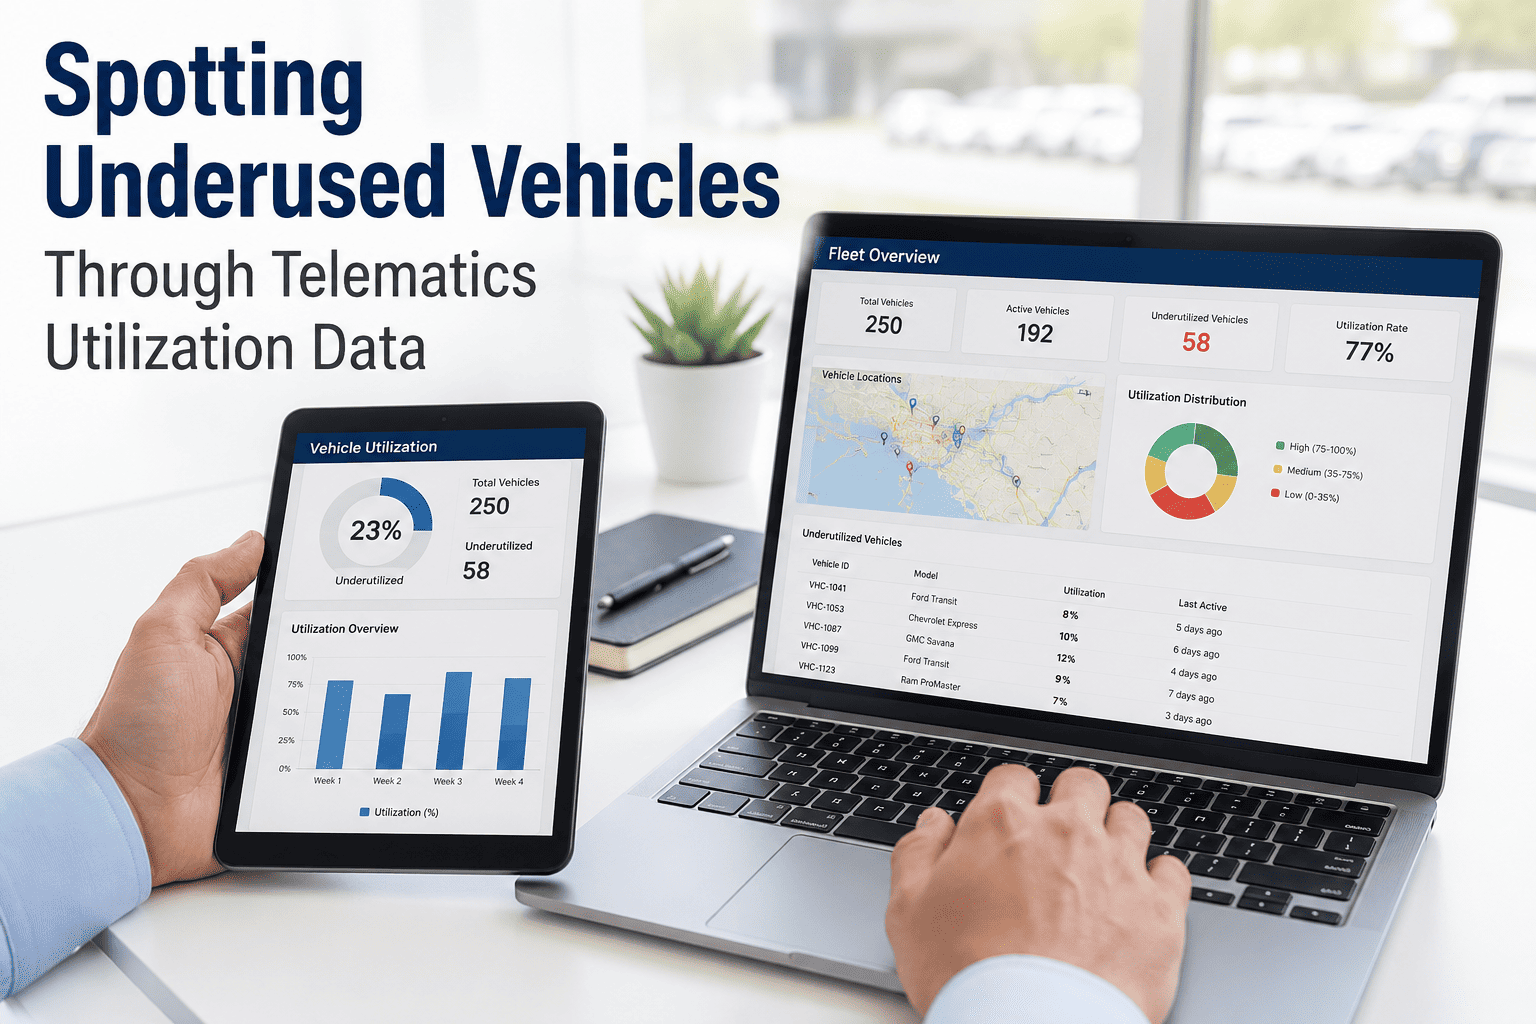
Automatic utilization rate per asset from work orders, meter readings and telematics. Spot underused fleet assets the moment they drift below target — not at year-end.
Outcome: identify the bottom 15–30% of your fleet in one dashboardCross-location asset visibility
See every vehicle and asset across all sites in a single view — location, custodian, condition, PM status and utilization — so surplus in one place fills demand in another.
Outcome: cut rental spend 20–40% by redeploying instead of rentingRedeployment workflow & audit trail
Transfer assets between locations with full digital history — service records, warranties, PM schedules and custodians move with the asset and stay audit-ready.
Outcome: 100% auditable transfers, zero lost maintenance recordsUtilization & capital analytics
Dashboards tie utilization to maintenance cost, downtime and carrying cost per asset — so you know which units to redeploy, which to sell, and which to keep.
Outcome: defer 10–20% of planned capital purchases with confidenceFleet utilization strategy: 4 myths that keep capital parked
"We need one of everything at every site, just in case."
Shared-pool assets redeployed on demand cover 90%+ of "just in case" needs at a fraction of the carrying cost.
"Low utilization means the asset is well-maintained and ready."
Idle assets still degrade — seals dry, batteries die, tires flat-spot. Underused units often cost more per hour when finally used.
"Redeployment is a logistics headache not worth the effort."
With a CMMS handling the transfer, PM schedule and records, redeploying a vehicle takes hours — and saves $8K–$15K a year per unit.
"Utilization tracking needs expensive telematics on every asset."
OxMaint derives utilization from work orders, meter readings and check-ins you already record — telematics optional, not required.
See which of your assets are underused — in your first 30 minutes
Book a 30-minute demo and we'll show you OxMaint's utilization dashboard, redeployment workflow and cross-location visibility on a fleet like yours.
Fleet utilization optimization — answered
What is fleet utilization optimization?
Fleet utilization optimization is the process of measuring how intensively each vehicle and asset is used, then redeploying, pooling, or disposing of underused units so capital matches real demand. The goal is to raise fleet utilization rate into the 70–85% optimal band while cutting carrying cost and rental spend.
What is a good fleet utilization rate?
For most mobile fleets, 70–85% is the optimal utilization band — high enough to justify the capital, low enough to allow preventive maintenance. Anything below 40% for 60+ days is a redeployment candidate. OxMaint calculates utilization rate per asset automatically; Start Free Trial to see yours.
How do I identify underused fleet assets?
Track actual hours or miles against available hours per asset, per month, and flag any unit running below 40% for two consecutive months. A CMMS like OxMaint automates this from work orders and meter readings, so underused fleet assets surface on a dashboard instead of hiding in spreadsheets.
When should I redeploy vs. sell an underutilized asset?
Redeploy when another location has proven demand (rentals, overtime, job queues) and the asset is PM-compliant; sell or return from lease when no site can lift it above ~30% utilization within 60 days. OxMaint's cross-location analytics show real demand so the redeploy-vs-sell call is data-driven. Book a Demo to see it on your fleet.
How does a CMMS improve fleet asset utilization?
A CMMS improves fleet asset utilization by centralizing utilization tracking, maintenance history and cross-location visibility in one system. OxMaint goes further with automated underutilization alerts, a digital redeployment workflow with full audit trail, and analytics that tie utilization to carrying cost — typically freeing 20–25% of fleet capital.
Stop paying for assets that sit parked
OxMaint shows you exactly which vehicles are underused, where to redeploy them, and how much capital you'll free up — all in one AI-powered CMMS.
Free 14-day trial · No credit card · Set up in under an hour



-(1).png)