A regional fleet running 140 trucks operated at 87% uptime for three straight years, writing off every breakdown as bad luck instead of a warning the data had already flagged. A blown turbocharger on I-35 turned into a missed delivery window, a $4,200 emergency repair, and a customer who moved half their freight to a competitor. Once the fleet connected its existing telematics to an AI-based condition monitoring platform, the same failure signature showed up nineteen days early on three other trucks, and those repairs happened on a quiet Tuesday instead of the shoulder of a highway. Within five months, fleet-wide uptime climbed from 87% to 96% without adding a single truck. See what the same shift looks like for your fleet — start a free trial with Oxmaint or book a demo.
Predictive Maintenance / Fleet Uptime / 2026 ROI Guide
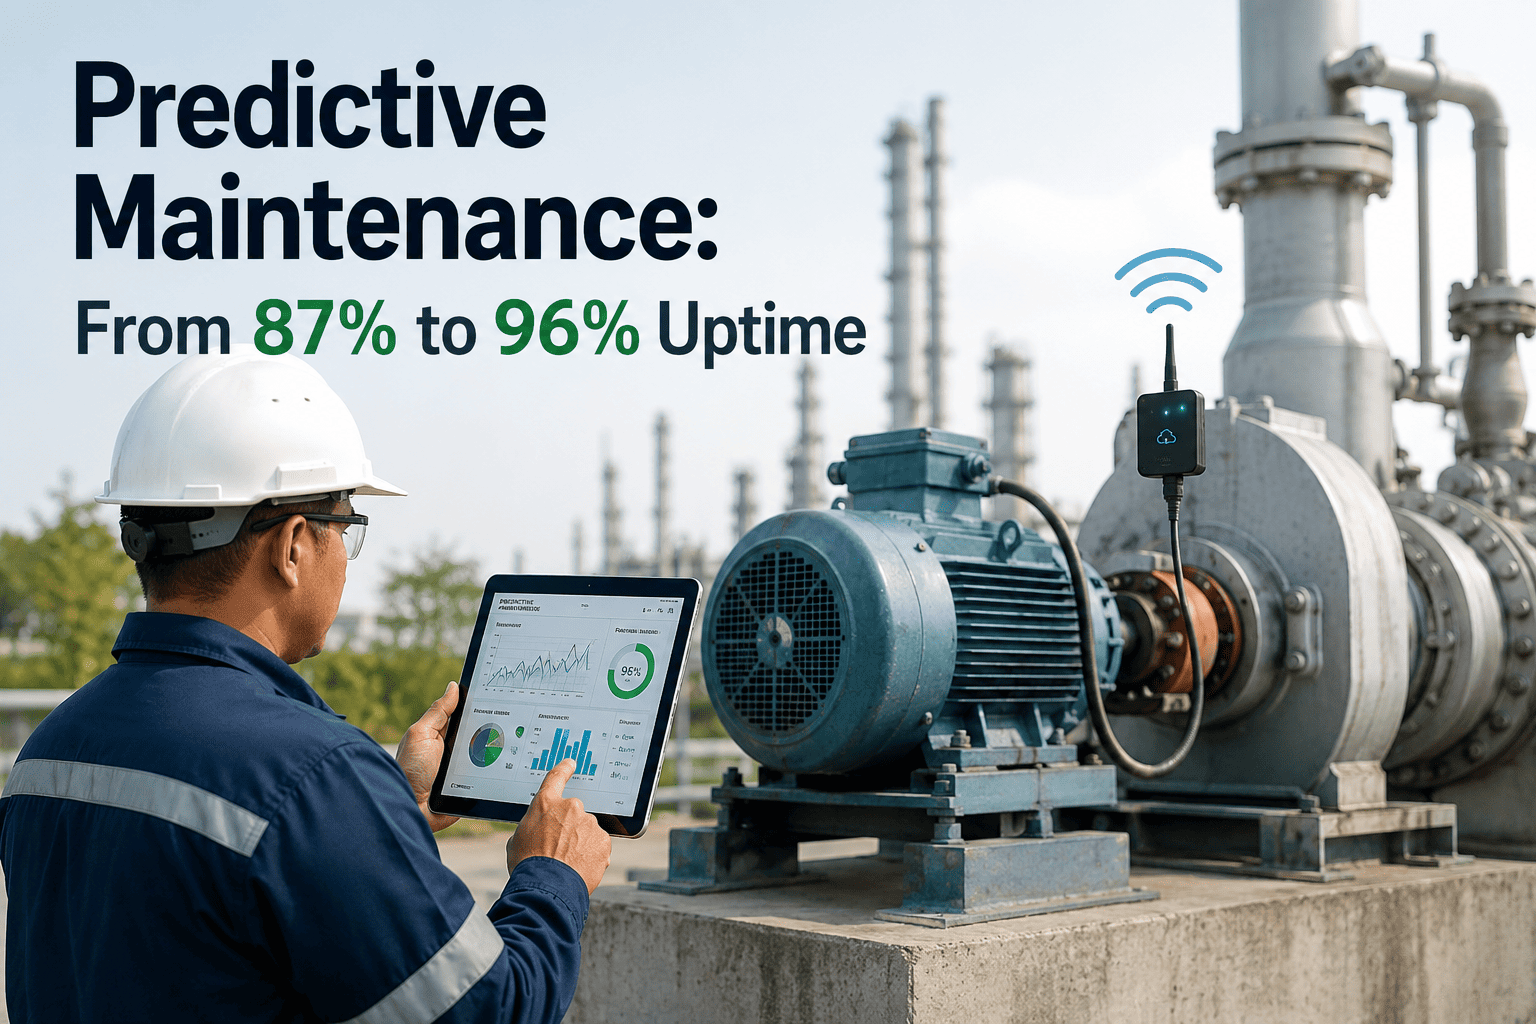
From 87% to 96% Uptime: What Genuine Predictive Maintenance Actually Delivers
Most fleets already have the data to predict failures weeks in advance — they just aren't reading it yet. This guide breaks down the real uptime and cost numbers behind predictive maintenance, and how they compare to the reactive and preventive routines most fleets still run on.
87% → 96%
Typical fleet availability lift once predictive monitoring replaces guesswork
45–62%
Fewer unplanned breakdowns reported across documented AI deployments
$1,900
Average total cost of one unplanned breakdown, direct plus indirect
44 days
Fastest documented payback window for a predictive maintenance program
Fleet Health Intelligence
Stop Scheduling Repairs by the Calendar — Start Scheduling Them by the Truck
Oxmaint turns the telematics data your fleet already generates into a live health score for every vehicle, flags failures weeks before they happen, and opens a work order automatically — before a driver ever calls in a breakdown.
The Three Stages Every Fleet Passes Through
Uptime is not a setting you switch on — it is the outcome of which maintenance stage a fleet actually operates in. Most operations sit somewhere between stage one and stage two without realizing a third stage exists, and it is the gap between stage two and stage three where the 87%-to-96% jump happens.
01
Reactive — Fix It When It Breaks
No scheduled monitoring, no early warning. Every failure is 100% unplanned, repairs cost 3–5x more than a planned equivalent, and components run 20–30% shorter lives from stress nobody caught in time.
Roughly 14% of annual operating hours lost to breakdowns
02
Preventive — Fix It on a Schedule
Service at fixed mileage or time intervals regardless of actual condition. Better than reactive, but still leaves 8–15% unplanned downtime between scheduled visits, and often replaces parts with 40% of useful life left on them.
A solid foundation — but still guessing at real condition
03
Predictive — Fix It Before It Breaks
Sensor data and AI models flag developing faults weeks ahead of failure. Repairs move into planned downtime windows, unplanned downtime drops 30–50%, and components run to their actual end-of-life instead of a guess.
Where fleet availability moves from 87% toward 96%+
What 87% Uptime Is Quietly Costing Your Fleet
Reactive maintenance rarely shows up as one dramatic loss — it shows up as a steady drain that most fleets never fully total up. These are the four numbers worth putting in front of finance.
11%
Operating hours lost to unplanned maintenance
On a 50-vehicle fleet, that is six figures of avoidable downtime cost every single year, before a single part is even ordered.
3–5x
Higher cost for the same repair, done as an emergency
Premium labor, expedited parts, towing, and secondary damage turn a $400 scheduled fix into a $1,900+ roadside event.
4.3 days
Average repair duration once a fault becomes a breakdown
Technician and parts delays stretch what could have been a same-day scheduled repair into most of a week off the road.
73%
Of fleets are still running fully reactive programs
The 27% already running predictive maintenance are the ones absorbing the fewest surprise costs heading into 2026.
Reactive vs. Preventive vs. Predictive, Side by Side
The comparison below is the one number most maintenance budgets are built without: what each strategy actually costs once unplanned downtime and component life are factored in.
| Metric |
Reactive |
Preventive |
Predictive |
| Unplanned downtime |
100% of all failures |
8–15% between intervals |
Reduced 30–50% |
| Repair cost vs. planned |
3–5x higher |
Moderate — some over-servicing |
25–35% lower overall spend |
| Component lifespan |
20–30% shorter |
Improved, still calendar-based |
Extended 20–40% |
| Typical fleet uptime |
82–87% |
88–91% |
94–96%+ |
| Data generated |
None — no pattern to learn from |
Foundation — service history only |
Continuous — feeds smarter predictions |
How Oxmaint Turns Telematics Into Uptime
Predictive maintenance is only as good as what happens after a risk is flagged. Oxmaint connects the prediction directly to the work order, the technician, and the compliance record — so nothing sits in a dashboard unread.
01
Live Health Score Per Vehicle
Every truck gets a continuously updated health score built from engine parameters, fault codes, and inspection history. When a score drops below threshold, a work order opens automatically — no one has to notice first.
02
Failure Windows, Not Just Alerts
Rather than a generic warning light, Oxmaint estimates a realistic failure window — often weeks out — so the repair can be scheduled into a slow day instead of forcing a truck off a route mid-load.
03
Planned-vs-Emergency Cost Tracking
Every prevented failure is logged against what the emergency version would have cost, turning predictive maintenance from a theoretical benefit into a running dollar total finance can review.
04
Audit-Ready Maintenance Records
Inspection results, repair history, and work orders generate the documentation trail carriers need for DOT and insurance review automatically, as a byproduct of daily operations rather than a separate task.
Built for Fleet Maintenance Teams
See Your Fleet's Health Scores Before Your Drivers See a Warning Light
Connect your existing telematics and Oxmaint starts building vehicle baselines immediately, surfacing the first actionable predictions within days — not months of setup.
The 96% Uptime Math
200–500%
Documented annual return
Combining avoided emergency repairs, recovered downtime, and leaner parts inventory
10:1–30:1
ROI ratio within 12–18 months
Benchmark range reported across mature predictive maintenance programs
$340,000
Recovered in year one on an 80-truck fleet
Primarily from three avoided engine failures and fewer roadside breakdowns
Under 8 weeks
Payback period on that same deployment
The first few prevented failures typically cover the entire program cost
A 50-truck fleet spending $400,000 a year on maintenance can typically free $120,000–$200,000 annually once unplanned repairs, idle trucks, and rush parts orders are brought under control. The first prevented engine failure alone often covers most of a year of platform cost — everything after that is compounding savings.
Frequently Asked Questions
How is predictive maintenance actually different from preventive?+
Preventive services trucks on a fixed calendar regardless of real condition. Predictive reads live sensor and inspection data to service only what actually needs it — which is why it consistently produces fewer surprise failures.
Book a demo to see the difference on your own fleet data.
How long before we see measurable ROI?+
Most fleets see measurable savings within 30–90 days through fewer emergency repairs and less towing. Full payback windows range from 44 days to roughly six months depending on fleet size and current breakdown rate.
Do we need new hardware to get started?+
Most vehicles built after 2015 already broadcast the diagnostic data needed. Oxmaint connects to existing telematics providers directly, so predictions can start within days rather than requiring a hardware rollout.
Start a free trial to test it against your current setup.
Does this replace our maintenance team?+
No — it removes the guesswork from their workload. Technicians spend less time chasing roadside emergencies and more time on scheduled repairs, which is where skilled labor delivers the most value.
What uptime target is realistic for our fleet size?+
Fleets moving from reactive to predictive maintenance typically climb from the low-to-mid 80s into the 94–96% range within five to six months, though exact timing depends on fleet age and current data quality.
Fleet Predictive Maintenance — Oxmaint
Your Trucks Are Already Telling You What Will Break Next
Live health scores, weeks-early failure predictions, automatic work orders, and audit-ready records — all built from the telematics data your fleet is already generating every mile.
96%+
Typical uptime once predictive maintenance is running
45–62%
Fewer unplanned breakdowns
10:1–30:1
ROI ratio within 12–18 months
44 days
Fastest documented payback






.png)