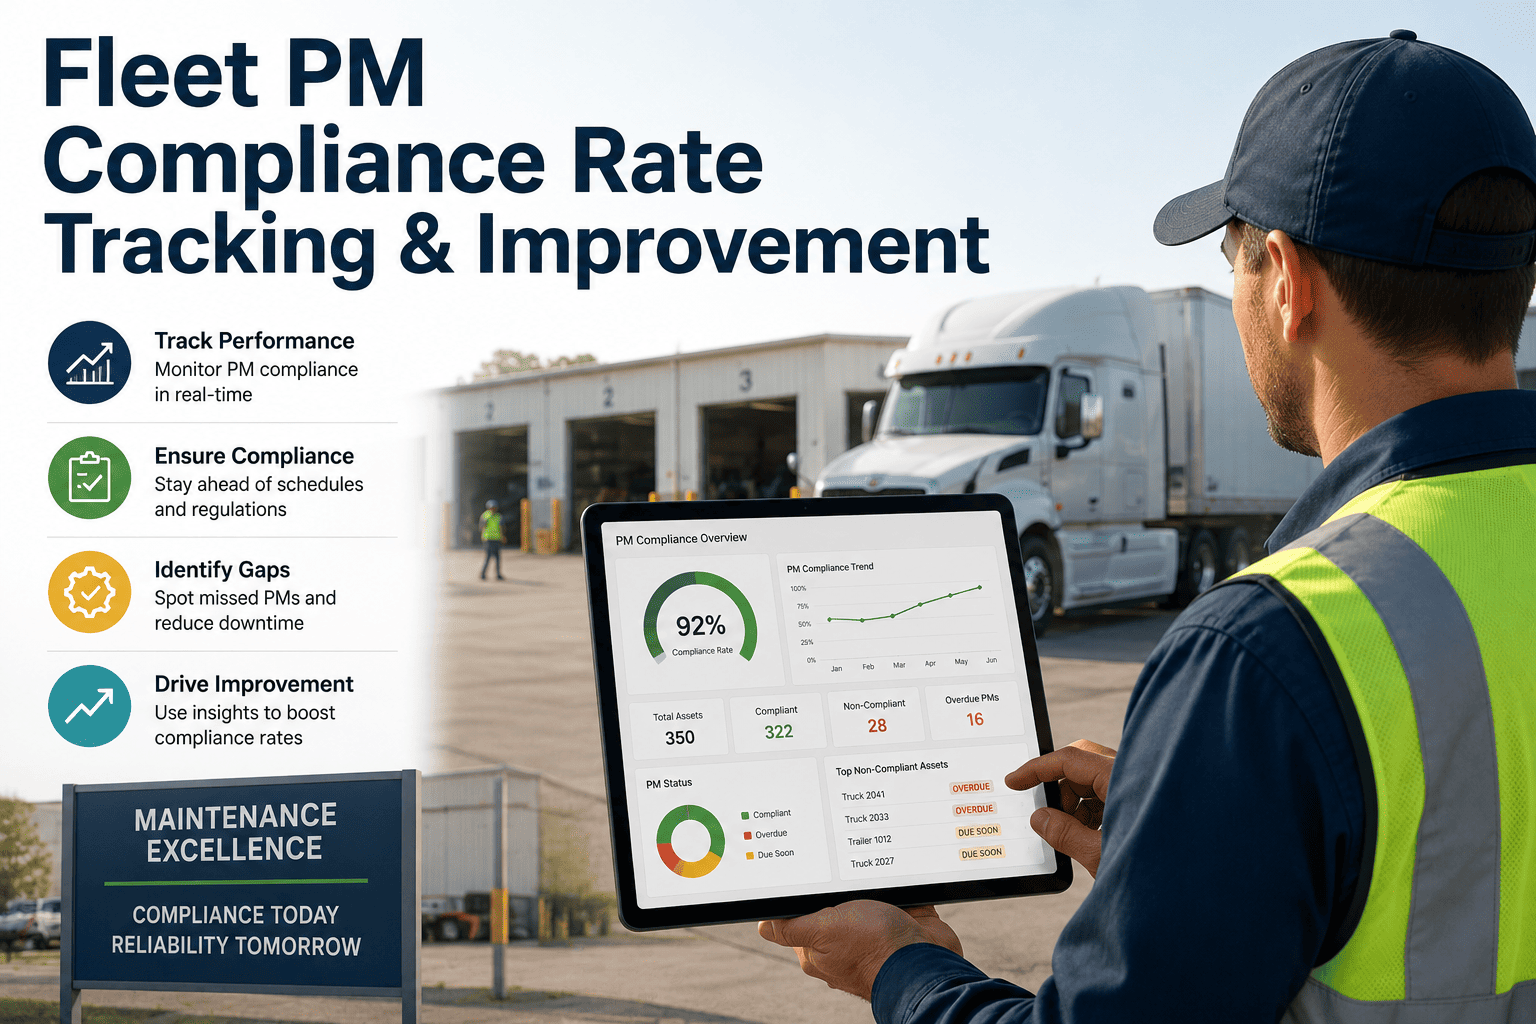
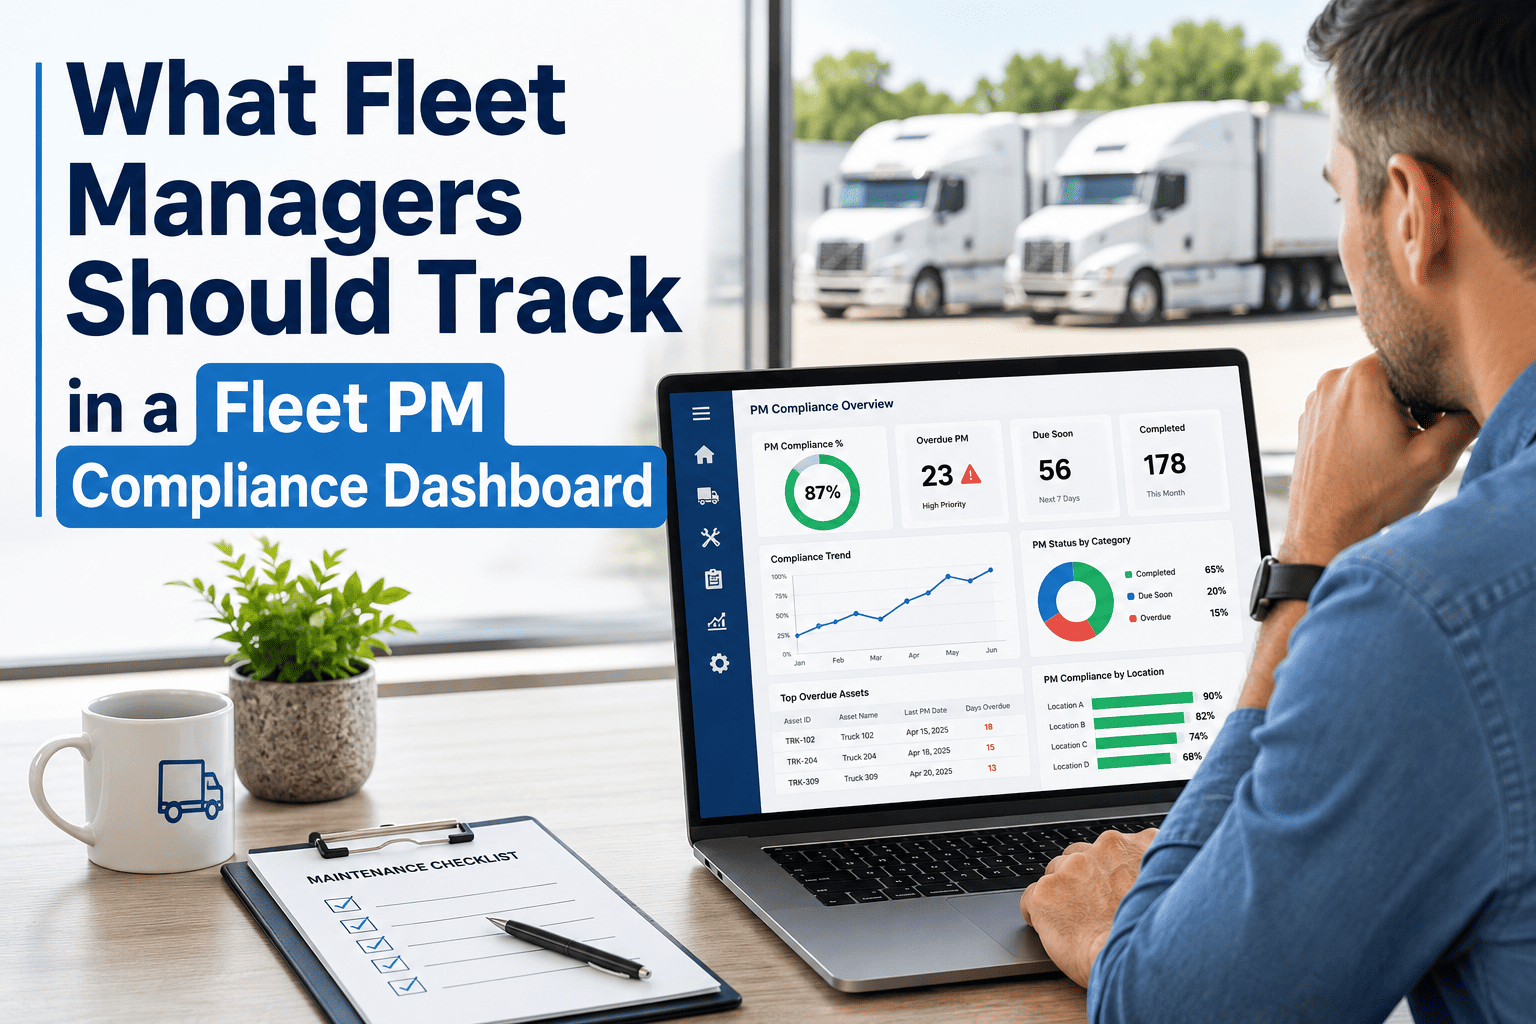
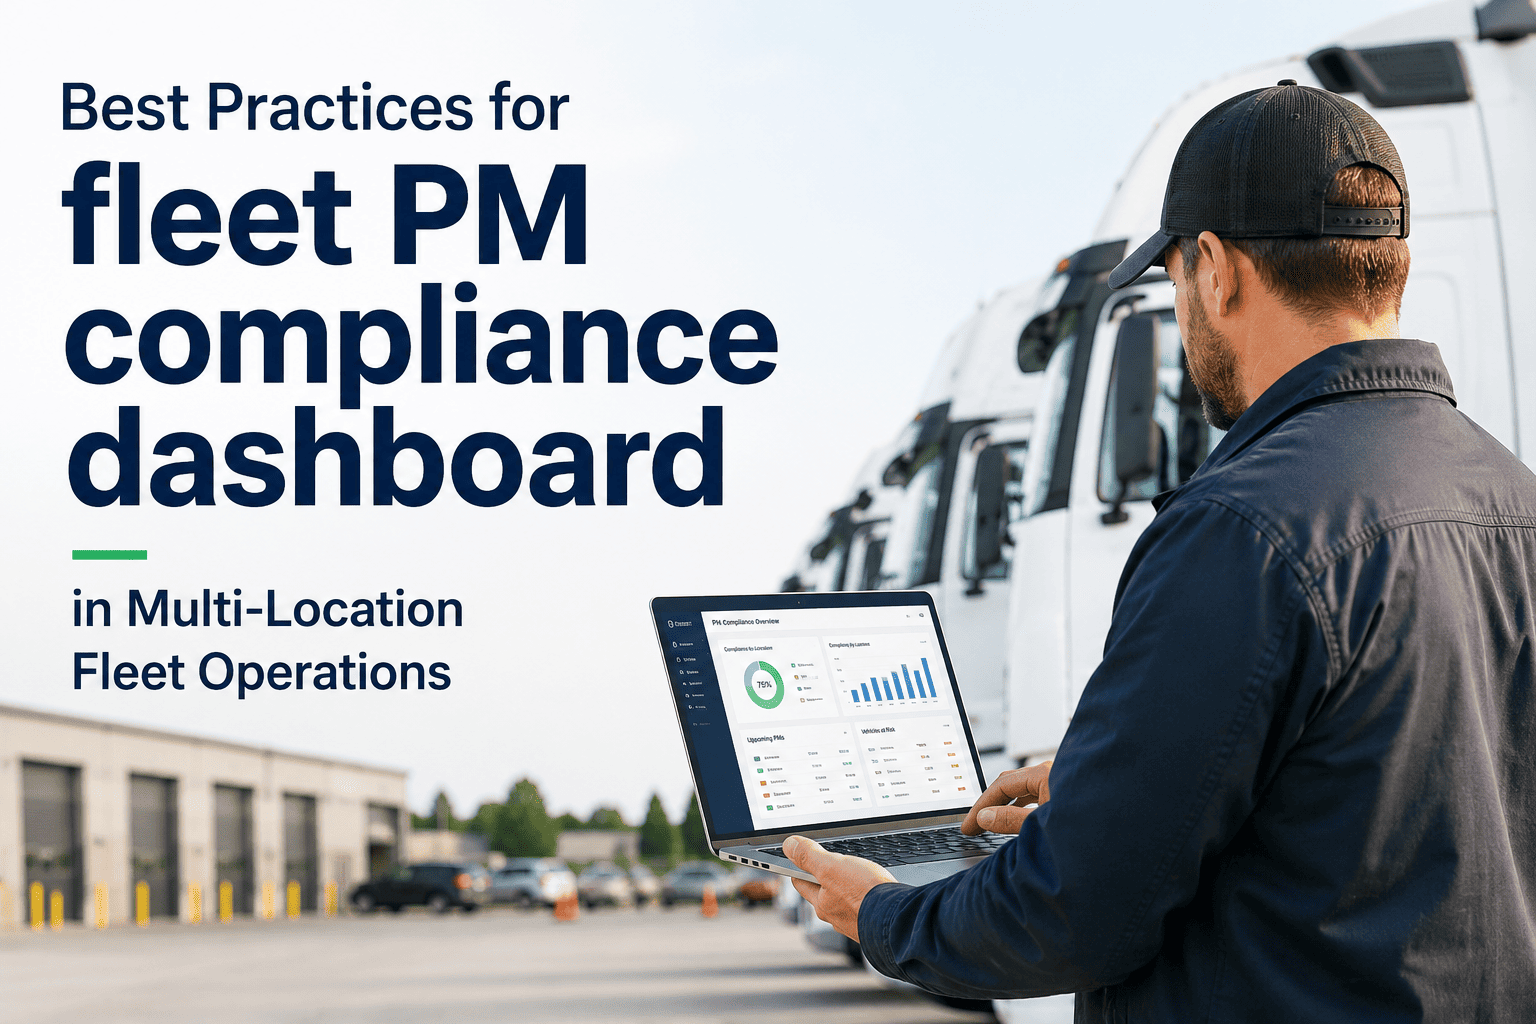
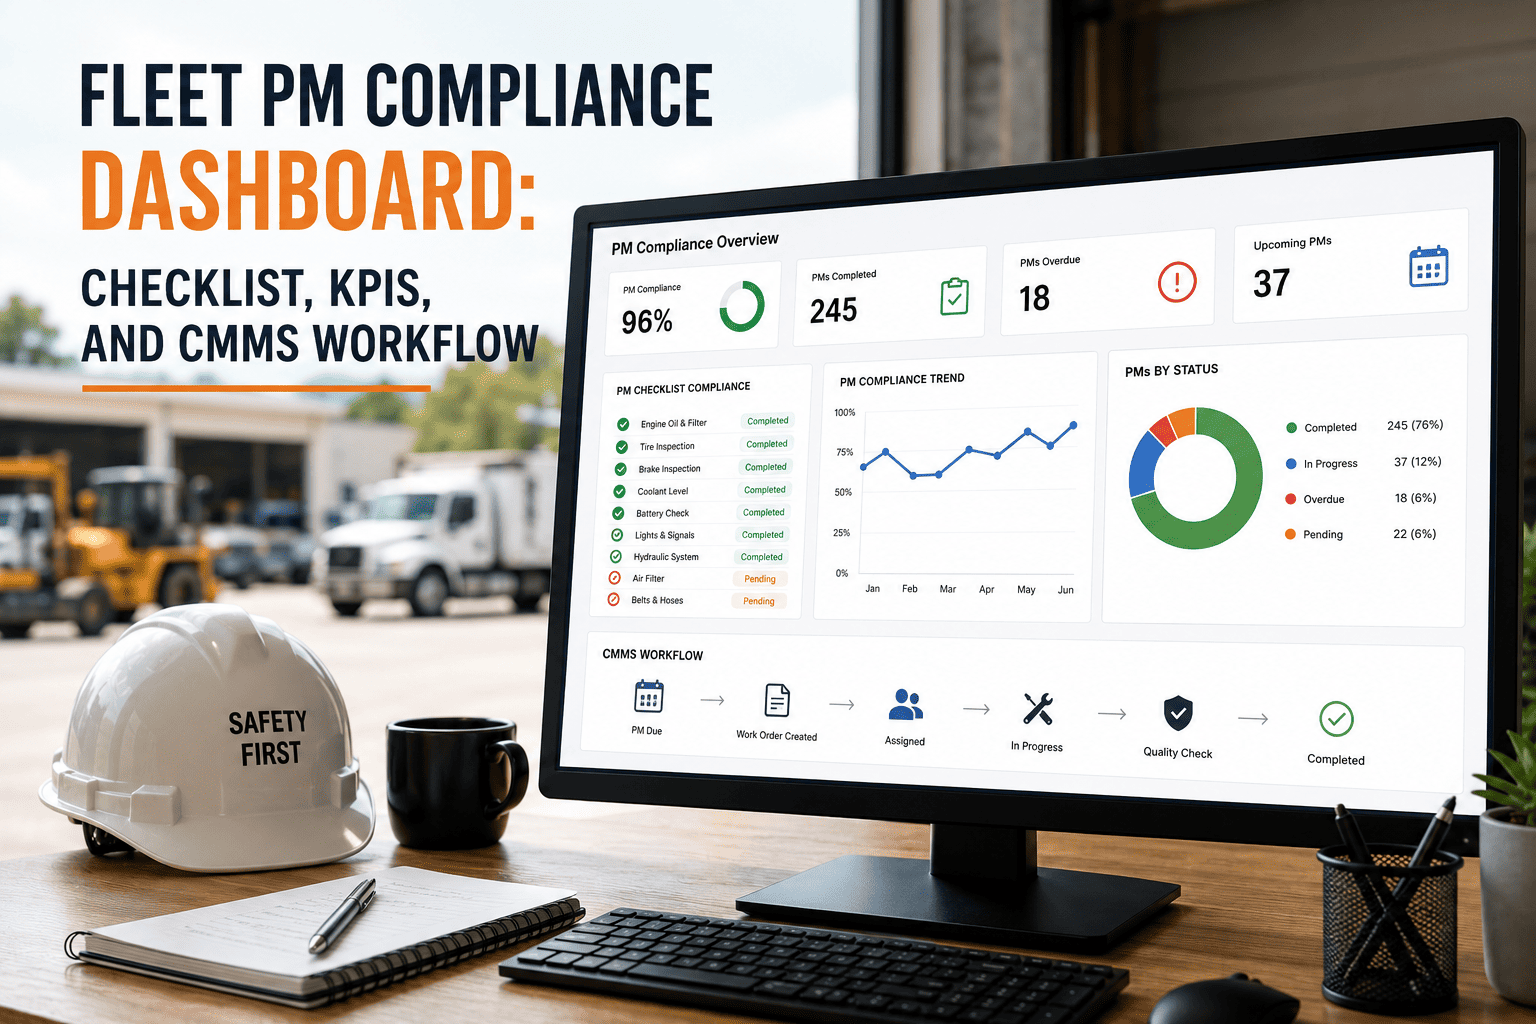
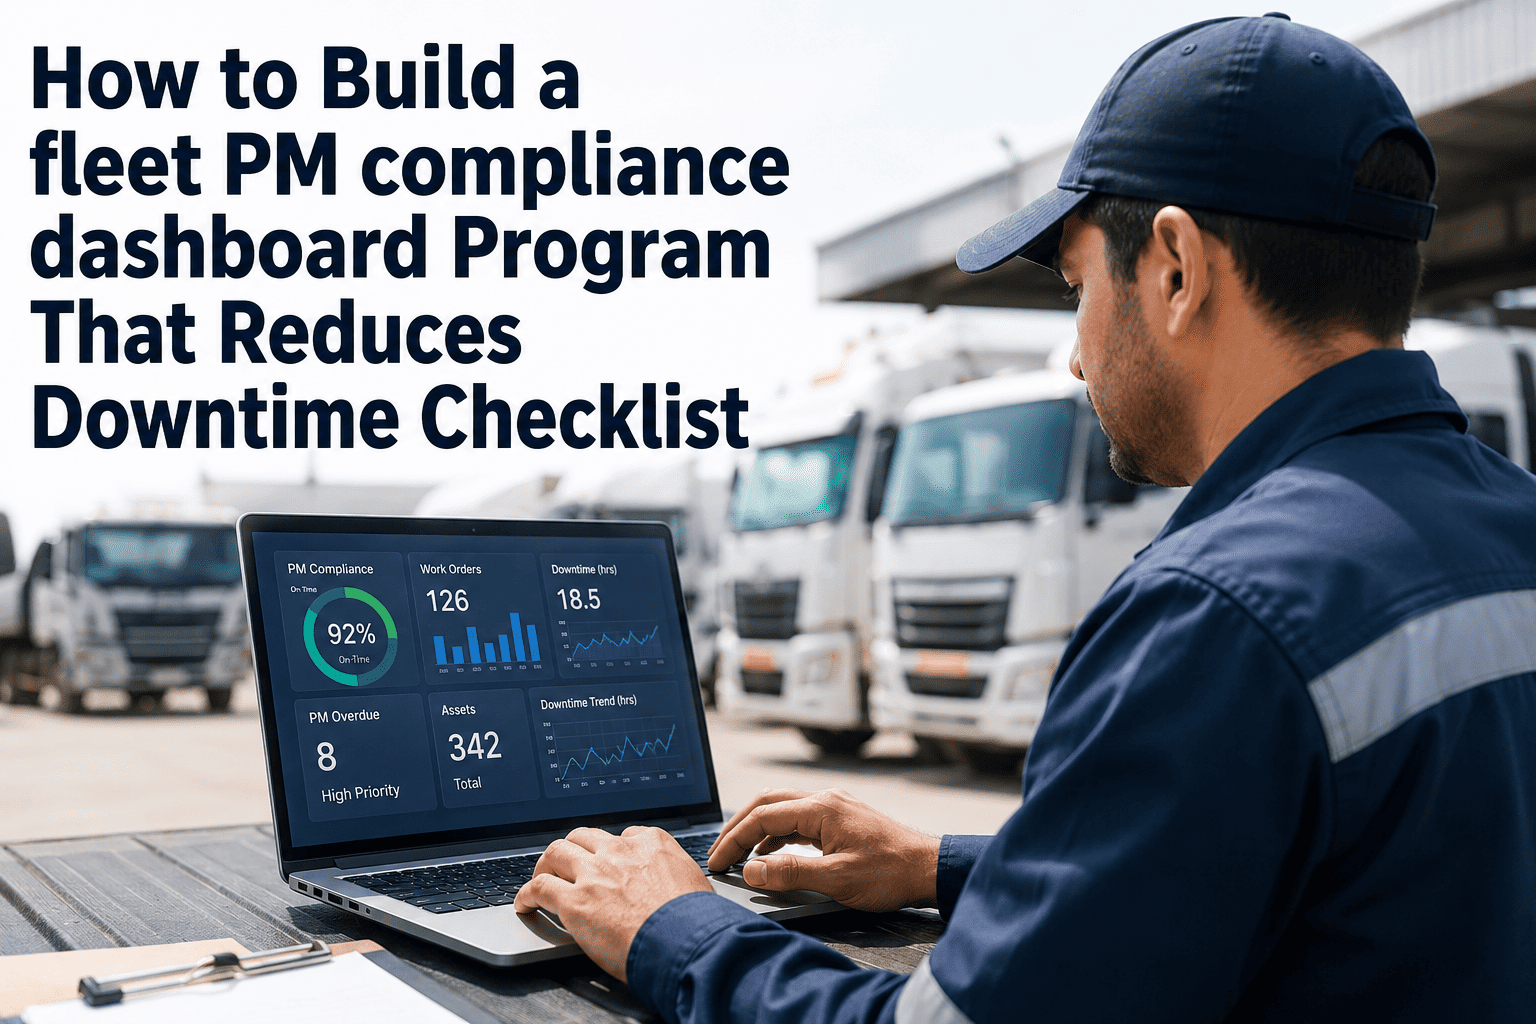
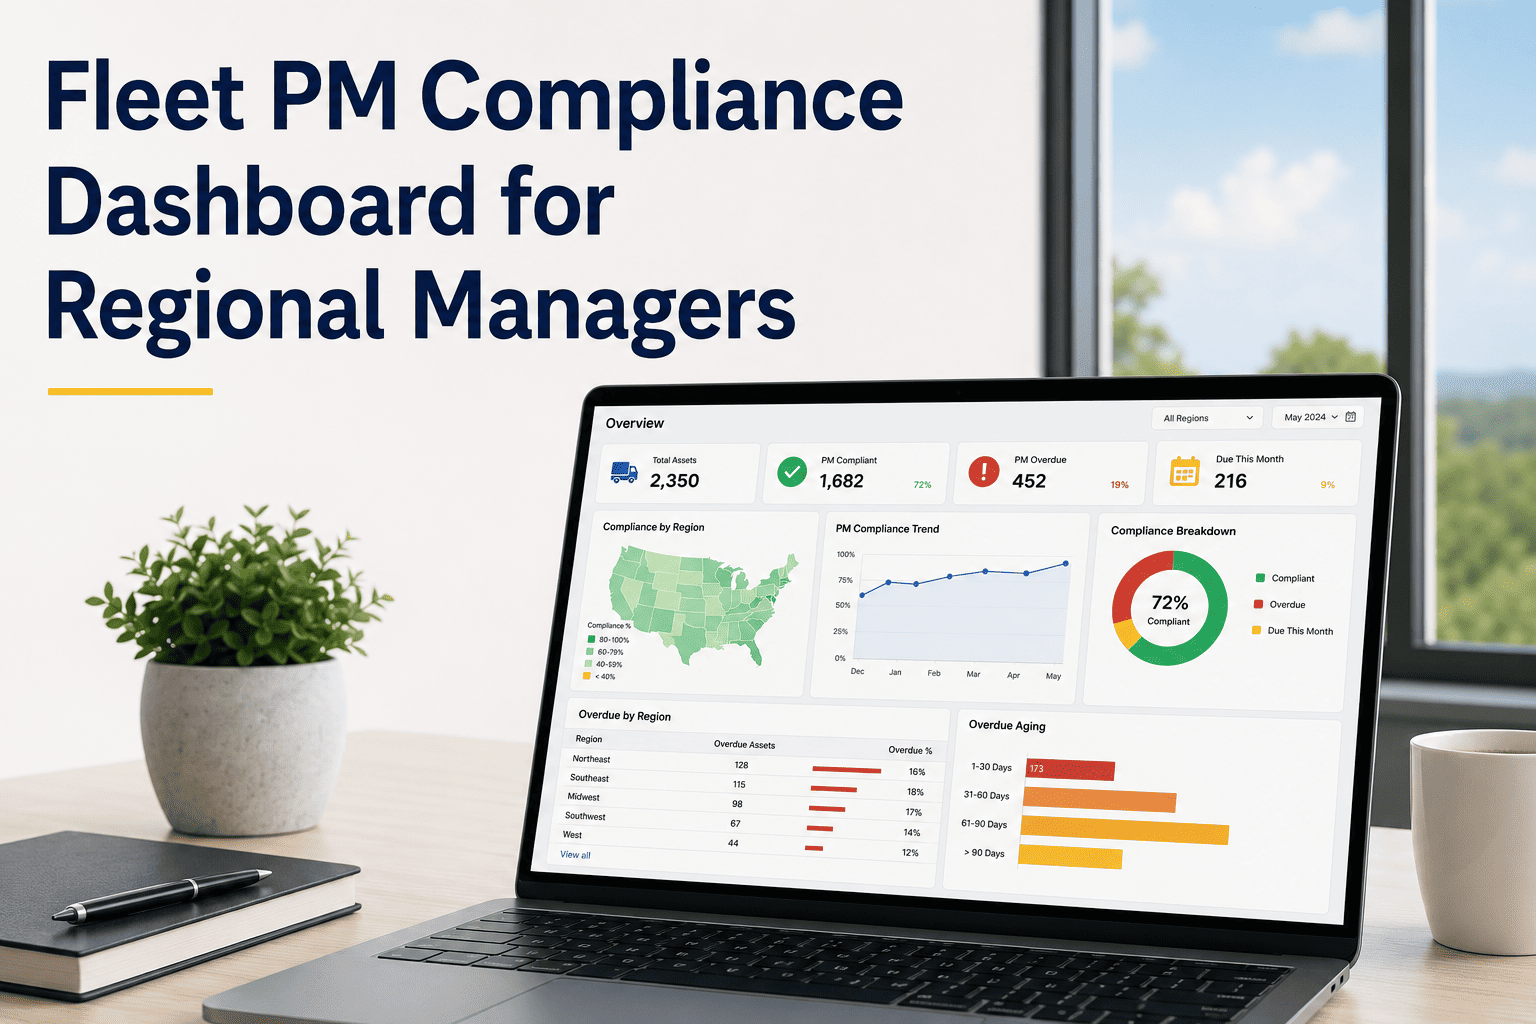
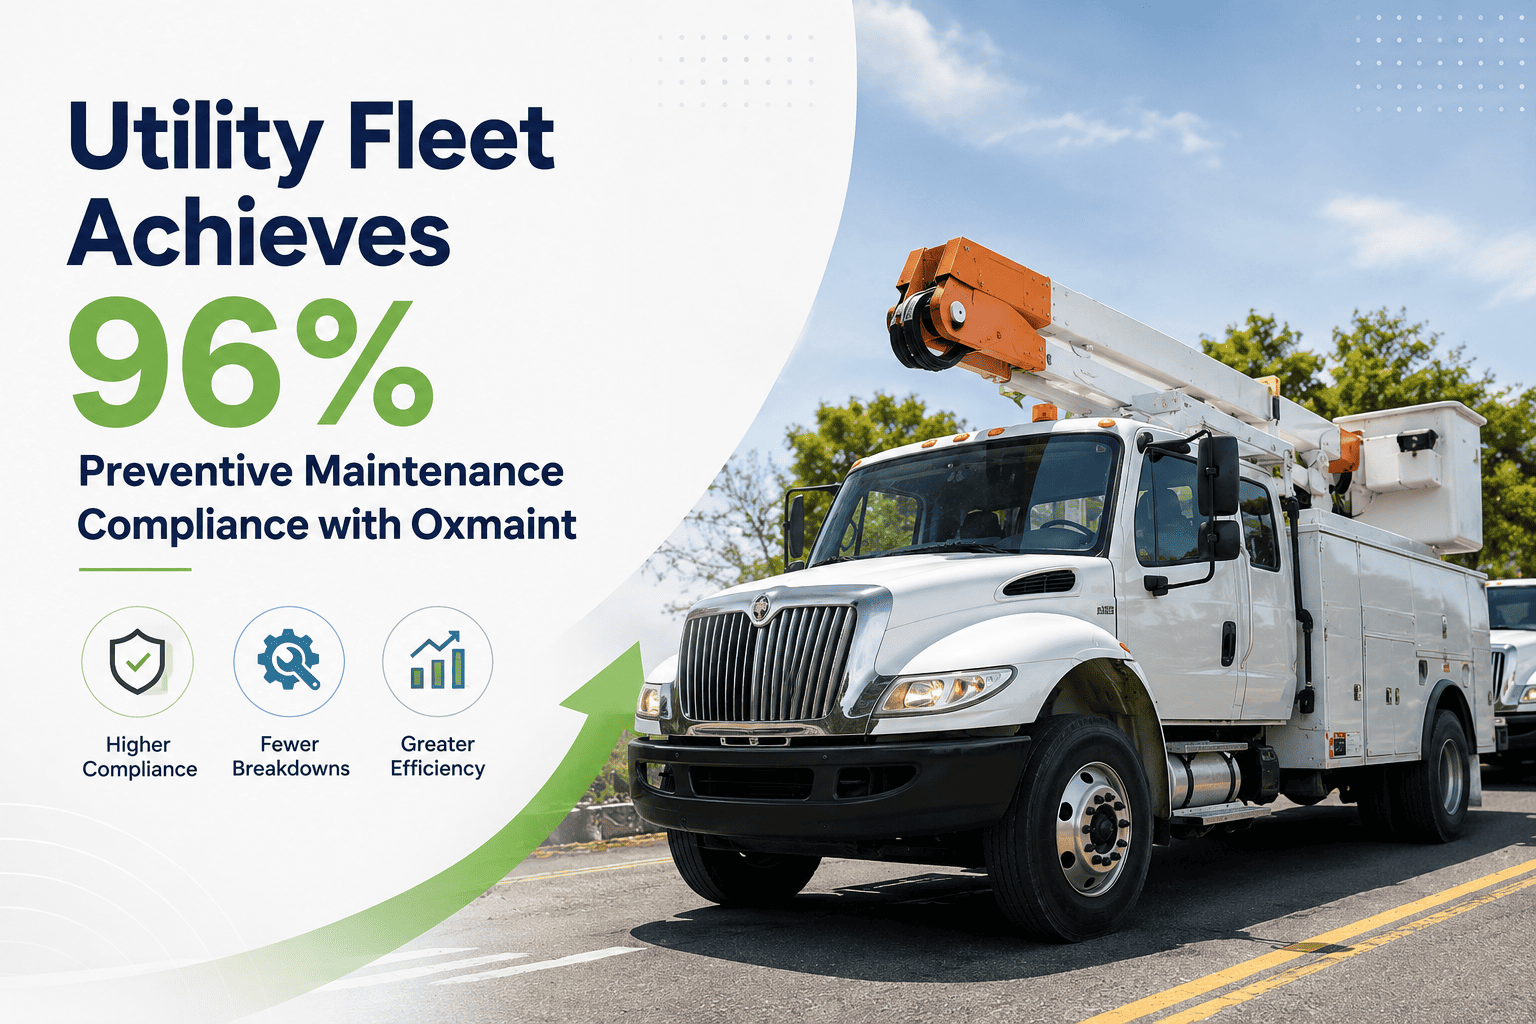
Every fleet runs a preventive maintenance schedule on paper. Far fewer fleets actually complete it. PM compliance rate is the number that tells you the truth — what percentage of scheduled services were actually finished on time, not just planned or logged as intended. Fleets that let this number drift below the mid-80s do not find out gradually, through a slow and gentle warning. They find out with a roadside breakdown, a blown transmission, or a missed delivery window that traces back to a service that was scheduled and quietly never done. Tracking and improving PM compliance rate is one of the highest-leverage habits a fleet maintenance manager can build, and OxMaint gives fleets a live compliance dashboard to see exactly where that number stands today.
84%
Average industry-wide PM compliance rate across tracked fleets
3.5x
More unplanned breakdowns for fleets under 80% compliance versus fleets above 90%
28%
Share of fleets that actually reach the 95–100% excellence tier
23%
Share of fleets stuck below 75% compliance without realizing it
The Metric That Predicts Everything Else
Why PM Compliance Rate Is the Number Fleet Managers Should Watch First
PM compliance rate is calculated as completed preventive maintenance tasks divided by scheduled preventive maintenance tasks, expressed as a percentage. It sounds like a simple administrative ratio. In practice it is the earliest warning signal a fleet has, because it measures whether planned work is actually happening before problems become visible in any other metric — downtime, breakdown frequency, or repair cost. By the time those numbers move, the compliance gap that caused them has usually existed for months. Most fleet managers only discover the true scale of the gap when a breakdown forces a records review, at which point the fix is reactive instead of preventive — the exact outcome a PM program was built to avoid in the first place.
It Moves First
Compliance rate declines weeks or months before breakdown frequency rises, giving fleet managers a lead indicator instead of a lagging one. A fleet that watches this number weekly can intervene long before a slipping vehicle turns into a roadside call.
It Is Fully Controllable
Unlike fuel prices or driver turnover, PM compliance is almost entirely within the maintenance team's control — it depends on scheduling, capacity, and follow-through, all of which can be redesigned without new hardware or budget approval.
It Drives Every Downstream Cost
Emergency repair spend, parts premiums, technician overtime, and vehicle resale value all trace back to whether scheduled services were completed on time. Improving one metric quietly improves all four at once.
Where Does Your Fleet Rank
The Four Tiers of PM Compliance — And What Each One Actually Costs You
Not all compliance gaps are equal. A fleet running at 88% behaves very differently from a fleet running at 65%, even though both would describe themselves as "mostly on schedule." Use this scale to place your fleet honestly, not optimistically.
Below 75%
Reactive Zone
Services are being scheduled but routinely slip past their window. Breakdowns feel random from the outside, but they are almost always traceable to a specific missed or delayed PM once the records are reviewed.
75% – 84%
Industry Average
Where most fleets sit today. Functional on a day-to-day basis, but still absorbing avoidable emergency repairs, rush parts orders, and unplanned downtime every single quarter without anyone flagging the pattern.
85% – 94%
Well-Managed Fleet
Breakdown frequency drops sharply once a fleet crosses into this band. Fleets operating here typically run close to 0.4 unplanned breakdowns per vehicle per year, a fraction of the fleets sitting below them.
95% – 100%
Reliability Leaders
Fleets here report 60–70% fewer breakdowns, 15–30% lower maintenance spend, and meaningfully longer asset life than fleets below 85% — the compounding reward for years of consistent scheduling discipline.
Benchmark By Fleet Type
How PM Compliance Rate Benchmarks Vary Across Fleet Types
A single industry average hides real differences between fleet types, and comparing your fleet against the wrong baseline can lead to the wrong conclusions. A local delivery fleet, a long-haul trucking operation, and a mixed construction fleet all carry different scheduling pressures, duty cycles, and technician access — which shows up directly in typical compliance ranges and breakdown outcomes.
Method Matters
Manual Tracking Versus Automated Compliance Tracking
The tracking method a fleet uses changes the accuracy of the compliance number itself, not just how convenient it is to view on a given afternoon. Spreadsheets and whiteboards report what someone remembered to update. Automated systems report what actually happened, captured at the exact moment the work order closes.
Manual Tracking
Compliance percentage is recalculated periodically, so it is already outdated by the time anyone reviews it.
Field completions reported by phone, text, or radio frequently never reach the master schedule.
No visibility into which vehicle, technician, or cause is driving the gap down.
Missed services are discovered after a breakdown, not before one.
Automated Tracking
Compliance percentage updates the moment a work order is completed and signed off.
Every field completion is captured digitally, so the number reflects real work performed.
Compliance breaks down instantly by vehicle, route, technician, and cause code.
Advance alerts flag vehicles approaching their service window before it closes.
See Your Real Number
Most Fleets Overestimate Their Own PM Compliance Rate
Spreadsheets and verbal check-ins hide missed services until a breakdown forces the conversation. A live compliance dashboard shows the true completed-versus-scheduled percentage for every vehicle, every technician, and every service type — updated automatically as work orders close.
Root Causes
Five Reasons PM Compliance Rate Quietly Collapses
Compliance rarely drops because a fleet stops caring about maintenance. It drops because small, unmonitored gaps compound over months until the schedule and reality no longer match. These are the five causes that show up most often.
01
Technician Capacity Mismatch
Scheduling software assumes unlimited shop capacity. When technician availability cannot absorb the scheduled volume, PMs get quietly pushed — and pushed again — until the backlog becomes the new normal.
02
Communication Gaps
A PM completed and reported over a phone call or a paper form often never reaches the tracking system, so a finished service still counts as missed and skews the whole fleet number.
03
Limited Fleet Status Visibility
Without a real-time view of which vehicles are due, overdue, or in progress, dispatch keeps routing vehicles that should be in the shop, extending the delay another day at a time.
04
Manual Scheduling Drift
Mileage- or hour-based intervals tracked by hand fall out of sync with actual vehicle usage, so due dates silently become inaccurate over time and the schedule stops reflecting real wear.
05
No Root-Cause Review
Fleets that never analyze why a PM was missed keep repeating the same operational mistake instead of fixing the process behind it, month after month, quarter after quarter.
06
Reactive Culture Reinforcement
Once emergency repairs become routine, the shop's calendar fills with unplanned work first, pushing preventive tasks further down the queue and reinforcing the exact cycle a PM program exists to break.
Getting It Right
How to Track PM Compliance Rate Correctly, Step by Step
Improvement starts with a measurement method that reflects reality, not one that flatters the maintenance team on a monthly report. Follow this sequence to build a compliance number you can actually trust, defend to leadership, and act on with confidence.
1
Define the Service Window, Not Just the Due Date
A PM completed ten days late should not count the same as one completed on the exact due date. Set a compliance window — typically five to seven days or 500 miles — and measure against it strictly, without exceptions for "close enough."
2
Capture Every Completion Digitally
Every PM signed off in the field — not just the ones logged at the shop — needs to hit the tracking system immediately, or the compliance number will always undercount real completed work and mislead the whole team.
3
Calculate at the Fleet and Vehicle Level
A healthy fleet-wide average can still hide a small group of chronically overdue vehicles pulling the whole operation down. Break the number down by vehicle, route, and technician to find where it actually breaks first.
4
Review It Weekly, Not Quarterly
Compliance gaps compound fast when nobody is watching. A weekly review catches a slipping vehicle before it becomes an overdue vehicle, and catches an overdue vehicle well before it becomes a roadside breakdown.
5
Log the Reason Behind Every Miss
Tag every missed PM with a cause — capacity, parts, scheduling, or communication. Patterns in that log tell you exactly what to fix next instead of guessing at a solution that may not address the real problem.
The Payoff
What Actually Improves When PM Compliance Rate Goes Up
Improving compliance is not a maintenance-department vanity metric that only matters on a monthly report. Every point gained shows up in cost, uptime, and asset value across the entire operation, from dispatch to finance. Here is the shift fleets typically see moving from the low 80s toward the 95%+ tier.
Unplanned Breakdowns
Down 60–70%
Total Maintenance Cost
Down 15–30%
Emergency Repair Frequency
Down 30–40%
Typical Breakdowns Per Vehicle Per Year
0.4 at 94%+ compliance
Versus well over 1.0 for fleets sitting below 80% compliance — the gap between the two tiers is rarely administrative. It is the difference between a fleet that runs and a fleet that reacts.
The OxMaint Approach
How OxMaint Keeps PM Compliance Visible, Accurate, and Improving
A compliance number is only useful if it is trustworthy and current the moment someone looks at it. OxMaint builds that number automatically from real operational data instead of relying on manual spreadsheet updates that are already stale by the time anyone actually reads them.
Live Compliance Dashboard
Fleet-wide and per-vehicle compliance percentage updates in real time as work orders are opened, completed, and signed off — no manual recalculation, no waiting for a monthly export.
Automated PM Scheduling
Service intervals trigger automatically from mileage, engine hours, or calendar time, removing the manual scheduling drift that causes most silent misses across a growing fleet.
Root-Cause Tagging
Every missed PM is logged with a reason code — capacity, parts, or scheduling — so recurring patterns surface instead of disappearing into a spreadsheet nobody reviews.
Capacity Planning Integration
Technician workload and shop capacity are factored into the schedule itself, so the plan reflects what the shop can actually execute, not just what is technically due.
Advance Alerts
Dispatchers and drivers are notified before a service window opens, keeping vehicles out of routes long enough to complete the PM on time instead of after the fact.
Weekly Compliance Reporting
Automated weekly summaries flag vehicles, routes, or technicians trending toward non-compliance before they drag down the fleet-wide average.
None of these features require the maintenance team to change how they work day to day. Technicians still close work orders the same way; the difference is that every one of those completions now feeds a compliance number that reflects reality instead of an outdated estimate carried forward from last quarter's spreadsheet.
Move From Reactive to Reliable
Turn PM Compliance Into a Number Your Fleet Actually Controls
OxMaint replaces manual tracking with a compliance system that schedules, alerts, logs, and reports automatically — so the gap between planned and completed maintenance closes instead of quietly growing.
Early Warning Signs
Five Signs Your PM Compliance Rate Is Already Slipping
Compliance rarely collapses overnight. It erodes quietly, one delayed service and one unlogged completion at a time, until the fleet-wide number no longer matches what dispatch and technicians believe is happening. Watch for these signals before the number forces the conversation for you.
A
Emergency repair invoices are climbing quarter over quarter even though the scheduled maintenance budget has stayed flat or grown, a near-certain sign that planned work is being replaced by reactive work.
B
The same handful of vehicles keep appearing in breakdown reports month after month, which usually means their service history has quietly fallen out of sync with their actual usage.
C
Nobody can produce a current compliance percentage on request without pulling data from three different spreadsheets and a stack of paper work orders first.
D
Technicians report completed PMs that never show up in the master schedule, meaning the tracked compliance number is understating the real work being done — or hiding a genuine gap.
E
Shop capacity conversations only happen after a breakdown, rather than as part of a proactive review of whether the PM schedule matches what the team can realistically execute.
A Realistic Snapshot
What a 20-Point Compliance Gain Looks Like on a 50-Vehicle Fleet
Numbers are easier to act on when they are tied to a fleet size that feels familiar rather than an abstract industry percentage. Here is a realistic before-and-after snapshot for a mid-size fleet moving from a 74% compliance rate — a common starting point for manually tracked fleets — to a 94% compliance rate after adopting automated scheduling and live tracking.
Before — 74% Compliance
Unplanned breakdowns / year≈ 55
Emergency repair share of budget≈ 42%
Average vehicle downtime / month≈ 2.4 days
After — 94% Compliance
Unplanned breakdowns / year≈ 20
Emergency repair share of budget≈ 18%
Average vehicle downtime / month≈ 1.1 days
The gap between these two columns is not a difference in vehicle quality, driver skill, or budget size. It is almost entirely the difference between a schedule that is tracked manually and one that is tracked automatically, alerted in advance, and reviewed every week instead of every quarter. Fleets that make this shift rarely describe it as a technology upgrade — they describe it as finally being able to trust their own maintenance data for the first time.
Common Questions
Fleet PM Compliance Rate — Questions Maintenance Managers Ask Most
What counts as a "good" PM compliance rate for a commercial fleet?
+
Most benchmarks place 85–94% as well-managed and 95–100% as the reliability-leader tier. Below 85% is where breakdown frequency and repair cost start rising sharply, and below 75% is where most emergency repair budgets originate.
Start a free trial to see where your fleet currently ranks.
How is PM compliance rate different from PM completion rate?
+
Completion rate only asks whether a service was eventually done, no matter how late. Compliance rate asks whether it was done inside its scheduled window, which is the version that actually predicts breakdown risk and should drive reporting.
Why does our fleet's compliance number look high but breakdowns keep happening?
+
A fleet-wide average can hide a small group of chronically overdue vehicles pulling the whole operation down while the rest of the fleet performs well. Breaking compliance down by vehicle usually reveals the real problem within days.
How quickly can a fleet improve a low PM compliance rate?
+
Fleets moving from manual tracking to automated scheduling and alerts typically see measurable gains within one to two maintenance cycles, since most misses trace back to visibility, not capability.
Book a demo to map a realistic timeline for your fleet.
Does improving PM compliance rate actually lower total maintenance cost?
+
Yes — fleets sustaining 95%+ compliance report 15–30% lower total maintenance spend, since planned work avoids the rush parts, overtime labor, and towing costs that emergency repairs carry.
OxMaint · PM Compliance Tracking
Stop Guessing Your PM Compliance Rate. Start Tracking It in Real Time.
OxMaint automatically schedules preventive maintenance, captures every completion, and calculates a live compliance percentage for your entire fleet — down to the vehicle and technician level. See where your fleet stands today, and what closing the gap is worth.