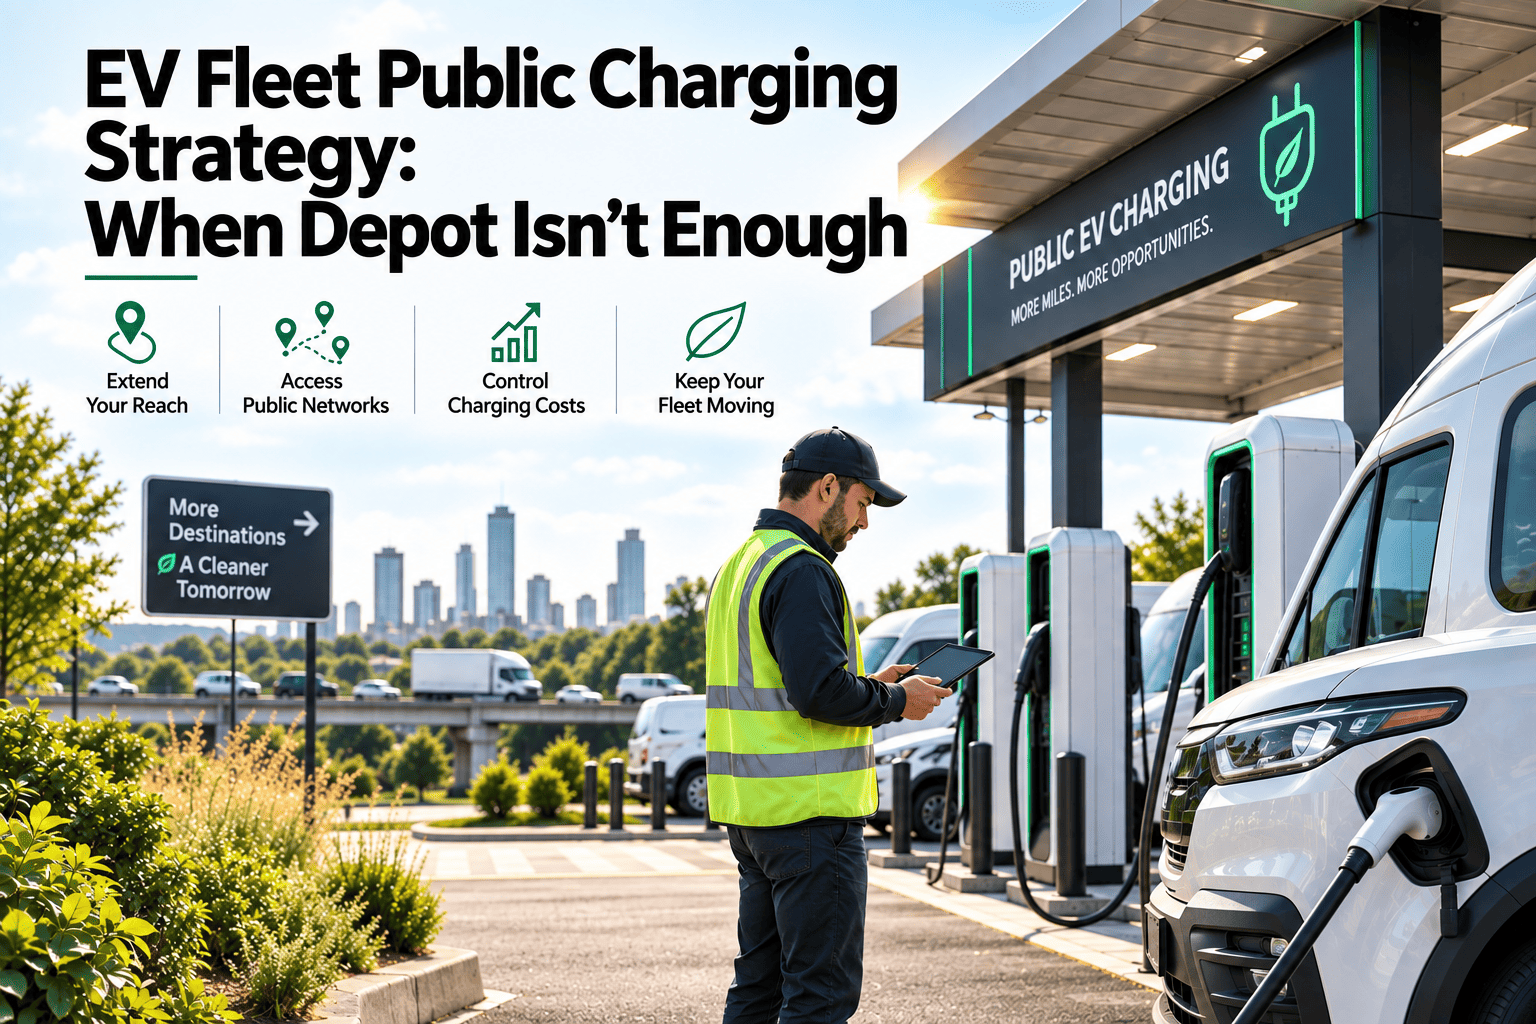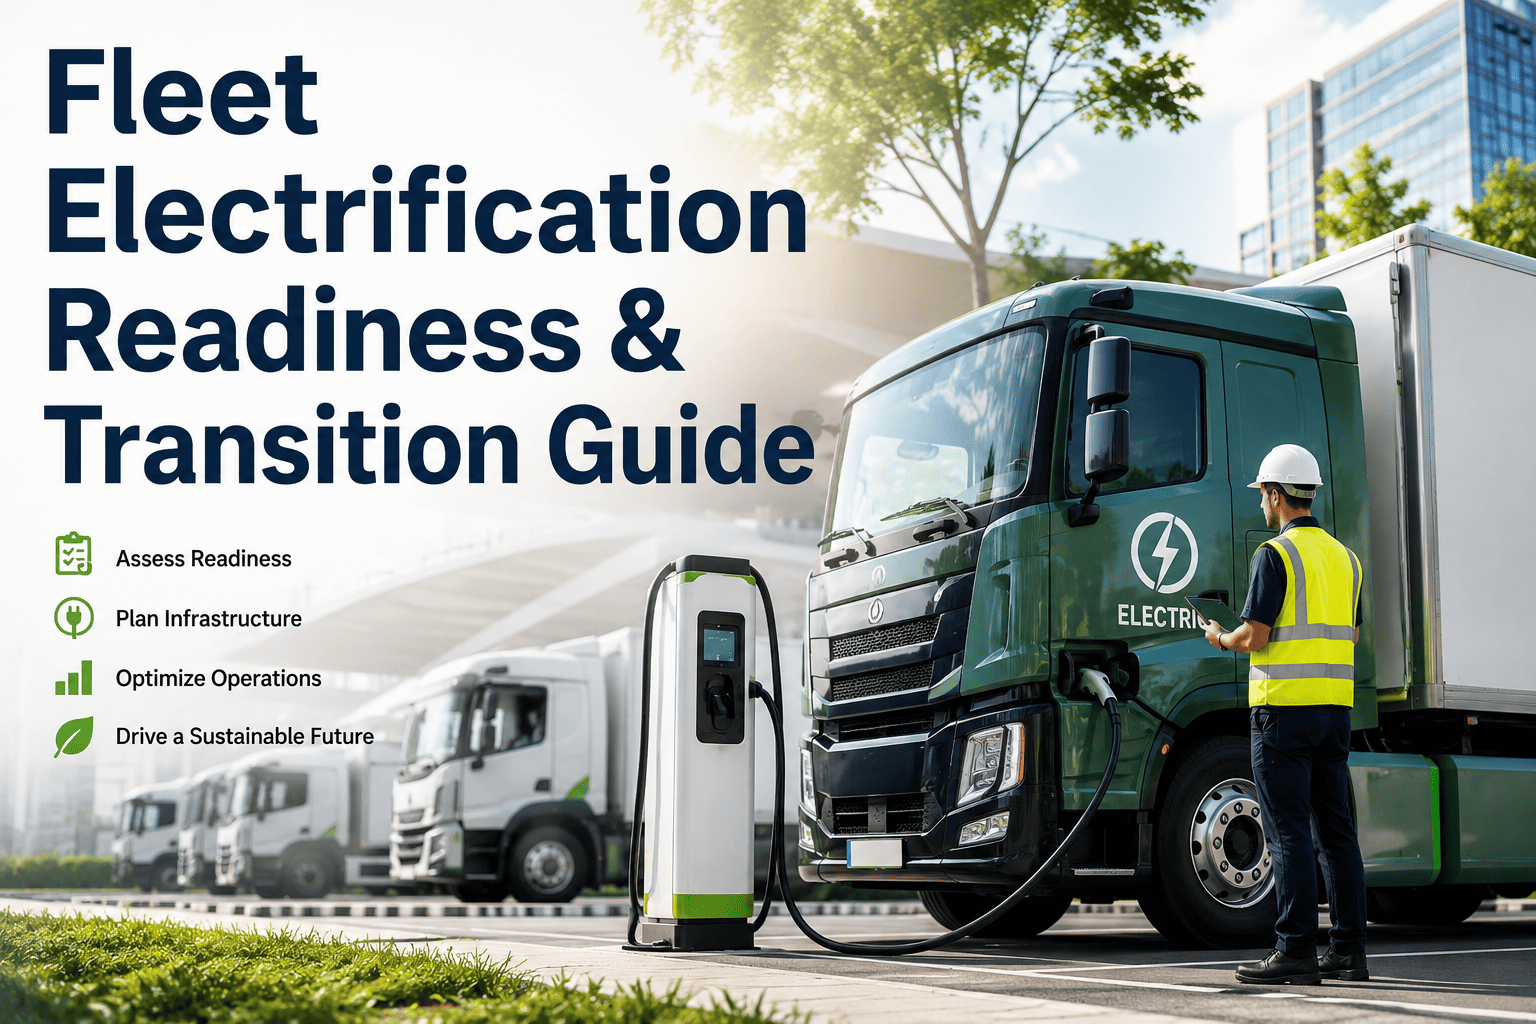
Electrifying a fleet without a readiness assessment is how fleets end up with EVs parked at the depot because the charging infrastructure wasn't sized for them, or assigned to routes the battery range can't reliably cover through a full shift. The vehicle purchase is the easy part — what actually determines whether an electrification program succeeds is duty-cycle analysis, depot power capacity, and a maintenance program built for two propulsion types running side by side, none of which show up on a vehicle spec sheet. A fleet that electrifies its highest-mileage, least depot-flexible routes first typically ends up reversing the decision within a year; the fleets that succeed start with the vehicles the data says are actually ready and scale from there. Getting this sequence right is the difference between a transition that compounds and one that stalls at the pilot stage. Book a demo to see an electrification readiness assessment built for your own fleet.
Oxmaint scores route and duty-cycle fit per vehicle, tracks depot charging infrastructure alongside vehicle maintenance, and runs EV-specific PM schedules next to your existing ICE program in one system.
Fleet electrification readiness means assessing route suitability, depot power capacity, and maintenance program structure before committing capital to EV purchases — not after. A readiness assessment scores each vehicle's route against its duty cycle — mileage, dwell time, load, and climate — evaluates whether the depot's electrical service can support charging demand at scale, and builds a mixed-fleet maintenance program that supports internal combustion and electric vehicles side by side. Fleets that skip this step typically electrify their most visible routes rather than their best-suited ones, and either strand capital in underused charging infrastructure or discover mid-pilot that dwell time at the depot isn't long enough to recharge for the next shift. Oxmaint supports the transition with EV-specific PM libraries, charging infrastructure PM tracking, and mixed-fleet maintenance scheduling across ICE and EV assets in one system.
Is Your Fleet Actually Ready to Electrify? Four Readiness Signals
Readiness isn't a single yes-or-no answer — it's four separate signals that each need to hold up on their own before capital gets committed to a vehicle order.
Daily mileage needs a real buffer against usable range, not rated range — cold weather, HVAC load, and cargo weight can cut real-world range well below the spec sheet number. Dwell time at the depot also has to be long enough to recharge before the next shift, which rules out routes with tight overnight turnarounds.
Charging a meaningful share of a fleet overnight draws far more power than most depots currently have available, and the utility upgrade to support it is usually the longest lead-time item in the entire transition — longer than vehicle delivery in most cases.
EV maintenance isn't lighter across the board — brake wear drops sharply thanks to regenerative braking, but battery thermal management, high-voltage system inspection, and charging-equipment upkeep are new categories most PM libraries don't have yet.
EVs typically cost more upfront and less to run, and the crossover point where lifetime cost favors electric varies significantly by vehicle class, mileage, and duty cycle — a single fleet-wide average hides which specific vehicle classes are actually ready to pencil out.
Score Every Route for EV Readiness Before You Order a Single Vehicle
Oxmaint scores duty-cycle fit, tracks depot power planning, and builds the mixed-fleet maintenance program alongside it — so the electrification sequence is based on data instead of visibility.
The Four-Phase Electrification Roadmap
Fleets that transition successfully move through the same four phases in order — skipping ahead to scale before the pilot phase has validated duty-cycle assumptions is the most common way a program stalls.
Score routes for duty-cycle fit, complete the utility service study, and place a small pilot cohort on the highest-fit routes to validate real-world range and dwell-time assumptions before scaling.
Expand to the next tier of high-fit routes once pilot data confirms range and maintenance assumptions, and begin the depot power upgrade construction identified in Phase 1's utility study.
Bring in medium-fit routes as infrastructure capacity grows, and mature the mixed-fleet maintenance program to run ICE and EV work orders through the same technician pool and parts inventory.
Electrify remaining suitable routes while retaining ICE vehicles on genuinely unsuitable duty cycles — high-range regional routes, extreme climate operations, or depots where infrastructure upgrades don't pencil out.
Route Suitability — Which Vehicles Should Go Electric First
The same five criteria decide route suitability regardless of vehicle class — a strong candidate clears most of them, a weak candidate clears almost none.
| Criterion | Strong Candidate | Weak Candidate |
|---|---|---|
| Daily mileage vs range | Well under usable range with buffer | Near or over usable range daily |
| Depot dwell time | Long overnight or midday charge window | Tight turnaround, minimal depot time |
| Route predictability | Fixed, repeatable route pattern | Variable, on-demand routing |
| Climate & terrain | Moderate climate, flat to rolling terrain | Extreme cold or heavy grades |
| Duty type | Stop-start urban or last-mile delivery | Sustained highway or heavy-haul duty |
Charging Infrastructure — What Depot Planning Actually Requires
Vehicle procurement moves fast; infrastructure moves slow. These four elements determine whether the charging side of the transition keeps pace with the vehicles arriving.
Level 2 charging is the right fit for overnight depot charging where dwell time is long — it's cheaper to install and easier on the electrical service. DC fast charging suits quick-turnaround routes but draws far more power and costs significantly more per port.
The utility service study, transformer upgrade, and make-ready construction are usually the longest lead-time item in the entire program — often longer than vehicle delivery — and need to start well before the first EV order, not after.
Charging an entire cohort at once can trigger demand charges that erase much of the fuel-cost savings EVs are supposed to deliver. Staggered, managed charging schedules keep peak demand — and the utility bill — under control.
Chargers fail, and a charger down at 5 a.m. is functionally the same as a vehicle down at 5 a.m. Charging equipment needs its own PM schedule and uptime tracking, not an assumption that it will simply work when needed.
Electrification Visibility Dashboard — What Oxmaint Tracks
Six metrics tracked across a mixed ICE and EV fleet, in the same system rather than two separate ones.
Results at Fleets Using Oxmaint Through Electrification
These figures come from fleets that started exactly where most readers of this page are starting — an EV pilot on order and no readiness assessment behind the route selection yet.
Our first EV pilot went to the routes that looked good on paper — high visibility, executive-approved. Half of them couldn't recharge in the dwell time we had at the depot, and we spent the next six months explaining why the pilot wasn't hitting its numbers. When we redid the selection using actual duty-cycle scoring in Oxmaint, the second cohort hit every target from month one, and it's the reason our board approved Phase 2 without a fight.
Frequently Asked Questions
The questions below come up in almost every first conversation about electrification planning — mostly around sequencing and what actually takes the longest.
Sequence Your Electrification Transition by Data, Not by Visibility.
Route and duty-cycle scoring, charging infrastructure PM, and mixed-fleet maintenance scheduling — all in the system that carries your fleet from ICE through Phase 4.