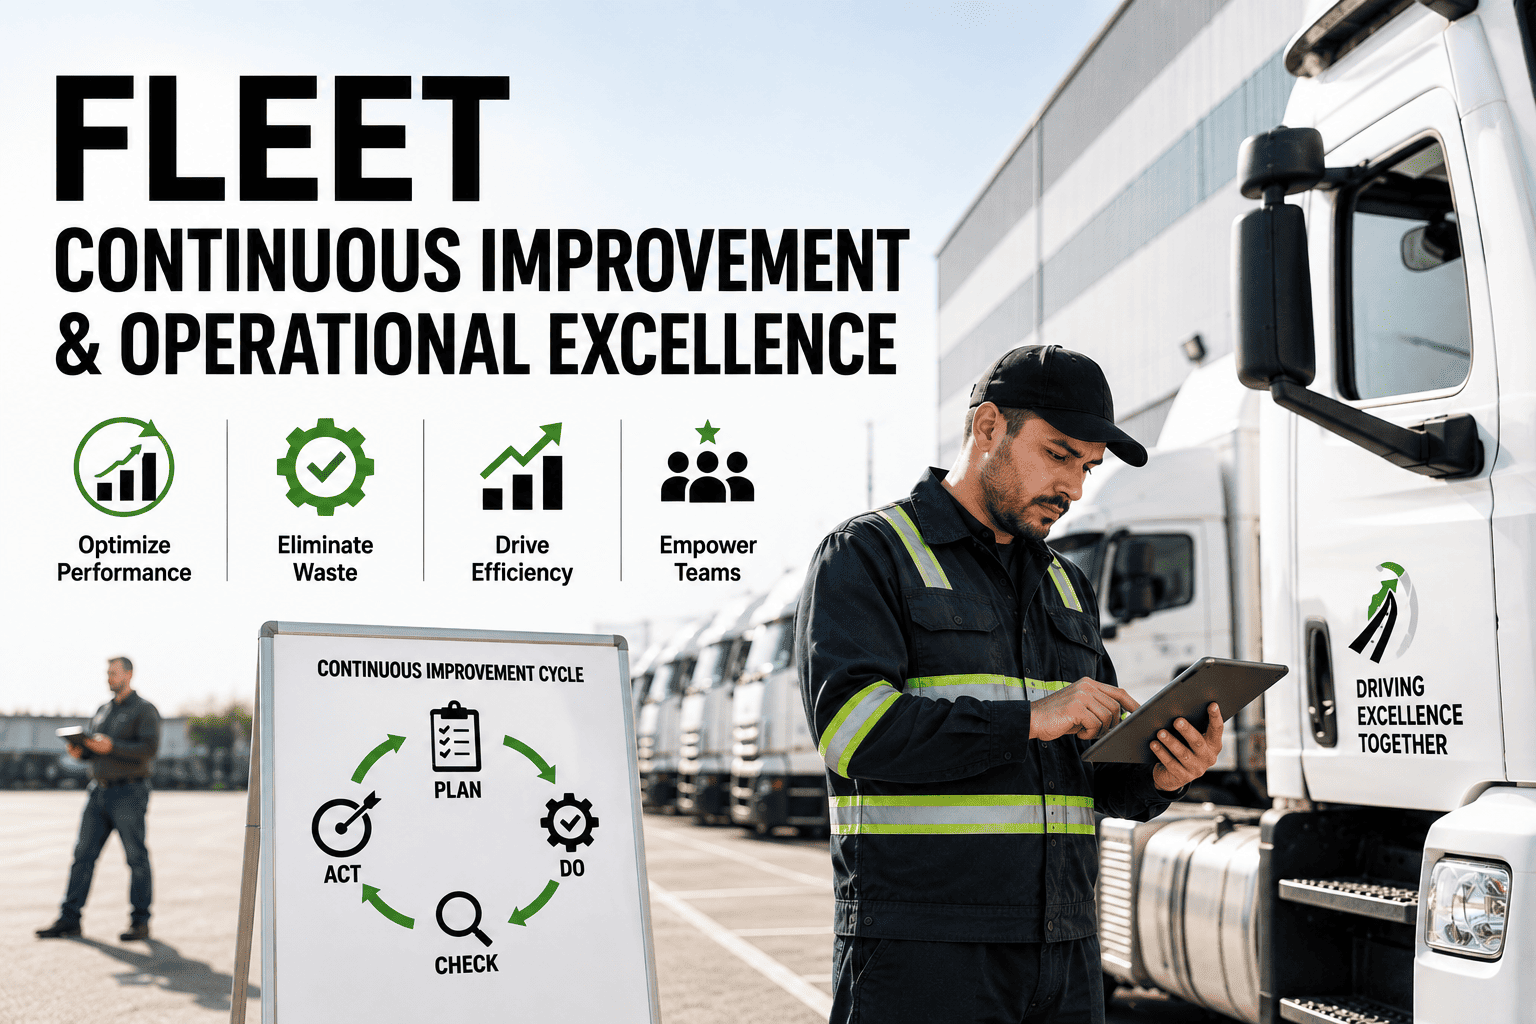
Every fleet manager has felt it — the month maintenance costs creep up again despite last quarter's "fix," or the week three trucks go down right after a program that was supposed to be working. Fleet continuous improvement is not a single project you finish and file away. It is the ongoing discipline that separates fleets stuck in permanent firefighting from fleets that get measurably better every single quarter. The strongest operations do not chase one big transformation — they compound dozens of small, tracked improvements until fleet operational excellence becomes the default state instead of the exception, and building that discipline takes a system, not willpower. See how that system works by booking a live demo with our team.
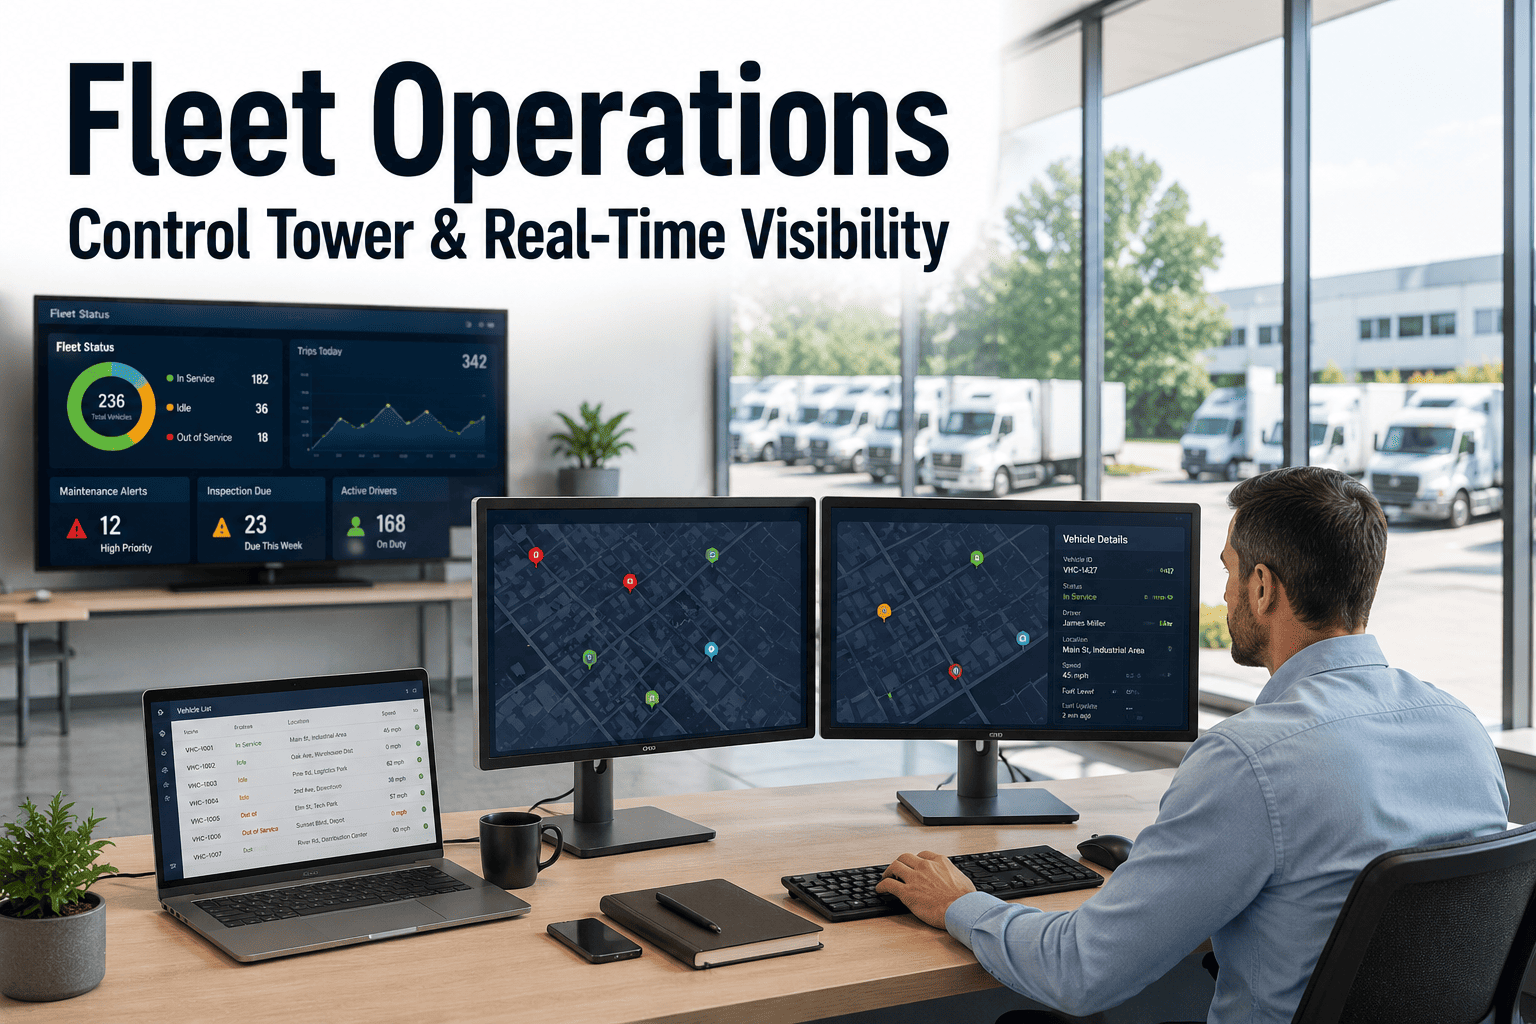
Fleet Operations — Continuous Improvement
Fleet Continuous Improvement & Operational Excellence, Built On Data Instead Of Guesswork
Most fleets don't fail because of one bad decision. They plateau because small inefficiencies never get measured, so they never get fixed. A real fleet continuous improvement program replaces hunches with a repeatable loop — measure, analyze, improve, sustain — powered by a CMMS that turns everyday maintenance and operations data into the next improvement idea.
6-8%
Lower maintenance cost for every 10% shift from reactive to planned work
70%
Fewer unexpected failures with predictive, KPI-driven maintenance
95%+
Fleet availability achieved by top-performing continuous improvement programs
Why Most Fleet Improvement Programs Quietly Stall
A fleet operations improvement effort rarely fails in one dramatic moment. It fades — a spreadsheet nobody updates, a KPI nobody reviews, a work order backlog that keeps growing until "continuous improvement" is just a phrase on a wall poster. These are the patterns that quietly stop fleet excellence programs before they ever compound into real savings.
Tracking Without Action
Dashboards get built, KPIs get charted, and nothing changes operationally. High visibility without an execution loop just creates a backlog that frustrates technicians and stalls the whole program.
Reactive Maintenance Culture
Most fleets still run close to a 50:50 split between scheduled and unscheduled work, when a mature fleet lean operations model targets 80:20. Every unplanned repair is a missed improvement opportunity.
No Single Source Of Truth
Fuel cards, telematics, technician notes, and inspection sheets all live in different places, so no one can connect a small mechanical drift to the cost spike it eventually causes.
Improvement Ideas Without Ownership
A technician spots a recurring fault, a driver reports a pattern, and the observation goes nowhere because there is no structured place for it to turn into a work order or a standard.
Turn Scattered Fleet Data Into One Improvement Engine
Oxmaint connects maintenance history, inspections, and asset performance into a single CMMS, so every small inefficiency becomes a tracked, assignable improvement instead of a forgotten observation.
The Continuous Improvement Loop For Fleet Operations
A fleet continuous improvement program only works when it runs on a repeatable cycle, not a one-time audit. These four stages are how operational excellence fleet programs turn everyday maintenance data into a compounding advantage, quarter after quarter.
Measure
Establish A Real Baseline
Capture 3-6 months of cost-per-mile, PM compliance, MTBF, and downtime data before setting any target. A baseline built on guesswork produces a fleet improvement program that measures the wrong things from day one.
Analyze
Find The Marginal Gains
Cross-reference maintenance cost, asset age, and failure frequency to find where a 1% improvement compounds fastest across the fleet — usually in the vehicles closest to their preventive maintenance threshold.
Improve
Assign, Don't Just Report
Every finding becomes a work order with an owner and a due date inside the CMMS. Fleet process improvement only sticks when the fix is dispatched, not just discussed in a monthly meeting.
Sustain
Lock In The New Standard
Once a fix holds for a full cycle, it becomes the new standard work — the new PM interval, the new inspection checklist item — so the fleet never drifts back to the old baseline.
The KPIs That Actually Drive Fleet Operational Excellence
Not every metric deserves a dashboard. These are the core indicators that consistently separate fleets running a real continuous improvement fleet operations program from fleets that just collect data without acting on it.
95%+
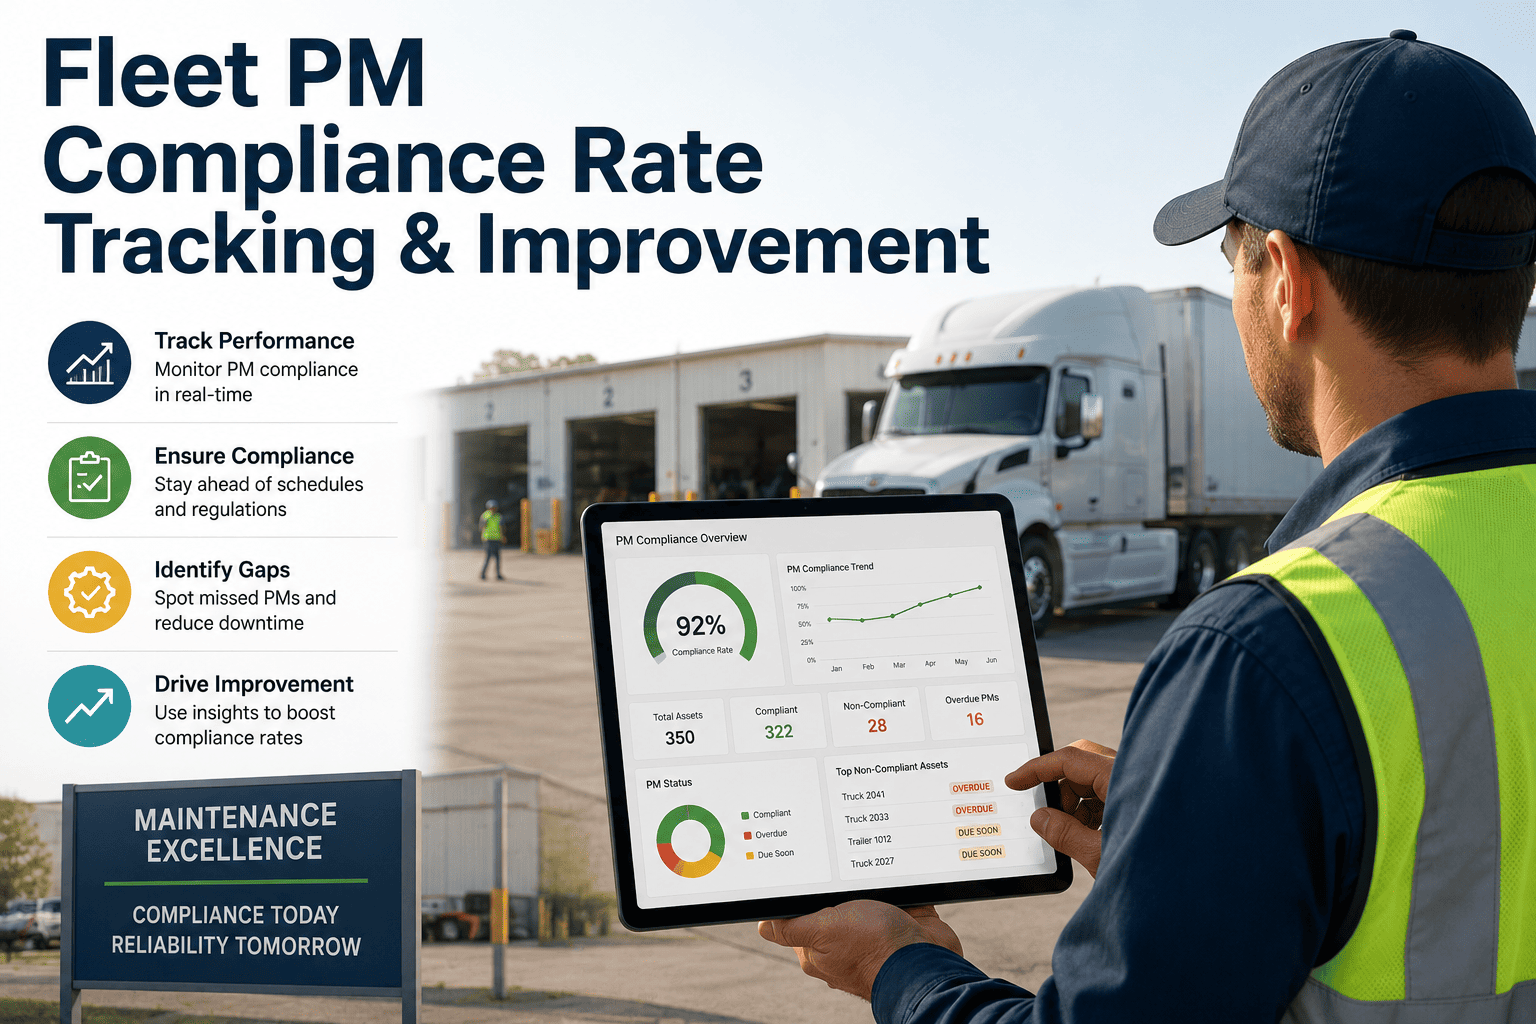
PM Compliance Rate
Completed preventive work divided by scheduled work. Below 85% statistically predicts higher breakdown frequency within 60-90 days.
$1.56
Cost Per Mile
The single most comprehensive fleet metric. Top performers hold this well below the 2026 industry average through disciplined preventive maintenance.
80:20
Planned Vs Reactive Ratio
The benchmark split between scheduled and unscheduled maintenance work for a mature fleet excellence program.
95%+
Fleet Availability
Available hours divided by scheduled hours. Every point of availability gained represents real, usable revenue capacity.
Leaders Vs. Laggards: What Fleet Excellence Programs Actually Look Like
The gap between an average fleet and a top-performing one is rarely one big decision — it is a set of daily habits, repeated consistently. This comparison of continuous improvement fleet operations shows exactly where that gap comes from.
| Operating Habit |
Average Fleet |
Fleet Excellence Program |
| Maintenance Mix |
Roughly 50:50 planned to reactive work |
80:20 planned to reactive, reviewed weekly |
| Dashboard Review |
Monthly, after invoices arrive |
Daily, against live CMMS data |
| Number Of KPIs Tracked |
3-5 basic financial metrics |
15-20 metrics across cost, safety, and compliance |
| Improvement Ideas |
Verbal, undocumented, easily lost |
Logged as CMMS work orders with an owner |
| Benchmarking Cadence |
Rarely compared to industry standards |
Reviewed quarterly against benchmark data |
Move From Average To Excellence, One Tracked Fix At A Time
See how Oxmaint's CMMS captures the daily habits — planned maintenance ratios, live KPI dashboards, and assigned improvement work orders — that separate leading fleets from the rest.
Rolling Out A Fleet Continuous Improvement Program
A fleet continuous improvement program earns trust in stages. Trying to fix everything in month one usually produces a program nobody keeps up with. This is the sequence that holds up in real fleet operations improvement rollouts.
Stage One
Baseline And Quick Wins
Pull historical maintenance and fuel data into the CMMS, identify the two or three highest-cost recurring faults, and fix those first to build early momentum and buy-in from technicians.
Stage Two
Standardize The KPI Set
Lock in the 15-20 metrics that matter for your fleet type, assign review owners, and set a weekly cadence for operational KPIs and a monthly cadence for trend analysis.
Stage Three
Convert Findings Into Work Orders
Every KPI breach automatically routes into a CMMS work order with an owner and a deadline, closing the gap between "we noticed a problem" and "we fixed it."
Stage Four
Sustain And Compound
Successful fixes become the new standard work — updated PM intervals, updated checklists — so the fleet keeps compounding gains instead of resetting to the old baseline every quarter.
Field Result
A mid-size regional fleet moved from a 55:45 reactive-to-planned maintenance ratio to 78:22 within two quarters of running a structured continuous improvement fleet operations program inside a single CMMS. Cost per mile dropped from $1.94 to $1.61, and unplanned breakdown call-outs fell by nearly a third — without adding a single vehicle to the fleet.
-30%
Unplanned breakdowns
2 Qtrs
Time to shift the ratio
Frequently Asked Questions
What does a fleet continuous improvement program actually involve day to day?
It means reviewing a small set of KPIs on a fixed schedule, logging every issue as a trackable work order in your CMMS, and confirming fixes hold before moving to the next one. You can see the full workflow by
booking a demo.
How is fleet operational excellence different from basic preventive maintenance?
Preventive maintenance is one input. Operational excellence also tracks cost per mile, availability, and safety trends together, then feeds every finding back into maintenance planning so the whole operation keeps improving, not just the repair schedule.
How long before a fleet improvement program shows measurable results?
Most fleets see early wins from quick-fix repairs within 4-8 weeks, and a measurable shift in the planned-to-reactive maintenance ratio within two to three quarters of consistent KPI tracking.
Can a CMMS really replace spreadsheets for fleet process improvement?
Yes — a CMMS keeps maintenance history, inspections, and KPI trends in one place and turns findings directly into assigned work orders, which spreadsheets cannot do on their own. Try it with a
free trial on your own fleet data.
How many KPIs should a fleet excellence program track?
Start with the "Big 5" — PM compliance, cost per mile, availability, MTBF, and the planned-to-reactive ratio — then expand toward 15-20 metrics as your team's review discipline matures.
Build Your Fleet's Continuous Improvement Engine Today
Oxmaint gives fleet operations leaders one CMMS for KPI tracking, maintenance history, and improvement work orders — the exact foundation a lasting operational excellence program is built on.