Every Friday, fleet managers repeat the same ritual: export GPS pings from one system, fuel receipts from a second, maintenance invoices from a third, and driver logs from a fourth, then spend hours stitching it all into a spreadsheet that is stale before anyone opens it. By the time a cost spike or a failing-brake pattern shows up in that report, the outlier has already turned into an unplanned breakdown or a six-figure budget miss. Fleets pulling ahead in 2026 skipped that cycle by centralizing every data source into one live dashboard — see how with a free Oxmaint trial.
Fleet Analytics / Strategy / 2026 Guide
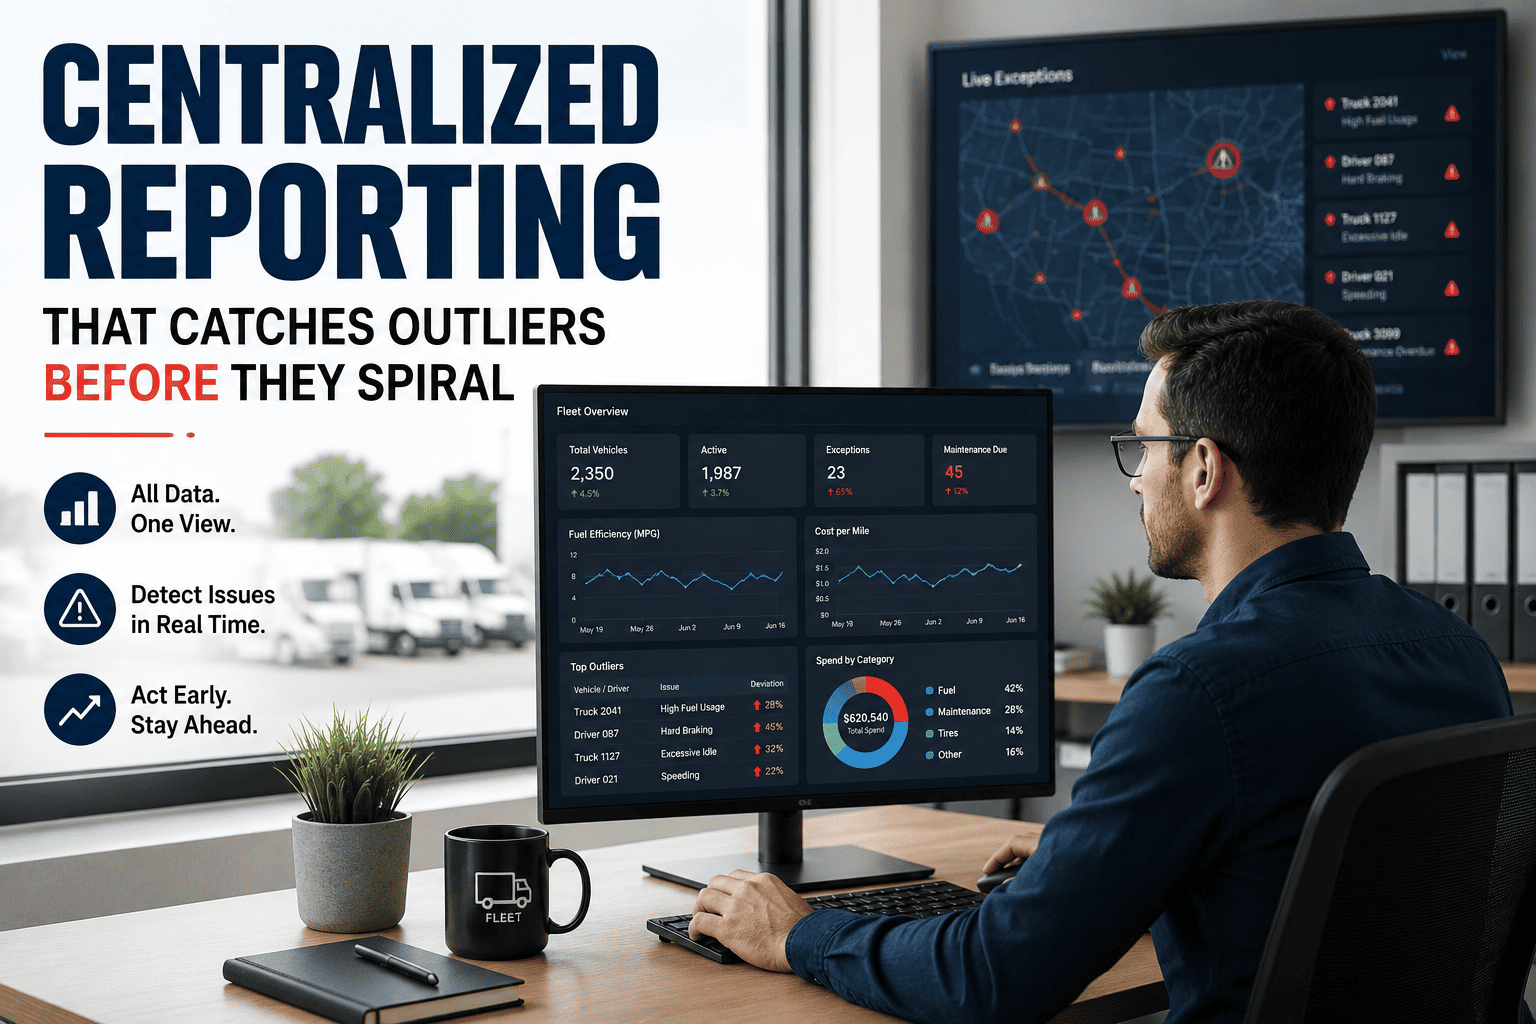
Centralized Reporting That Catches Outliers Before They Spiral
One live dashboard, built around the KPIs that actually predict margin, lets leadership catch a cost outlier in days — not the following Friday.
$2.26
Average fleet cost-per-mile in 2024, up $0.62 since 2020 — ATRI
5-10%
Of annual fleet budget wasted on underutilized assets and poor PM compliance
$448-760
Cost of unplanned downtime per vehicle, per day
3.5x
Average ROI on fleet analytics software within 12 months
Unified Fleet Intelligence
See Every Cost Outlier Before It Becomes A Budget Problem
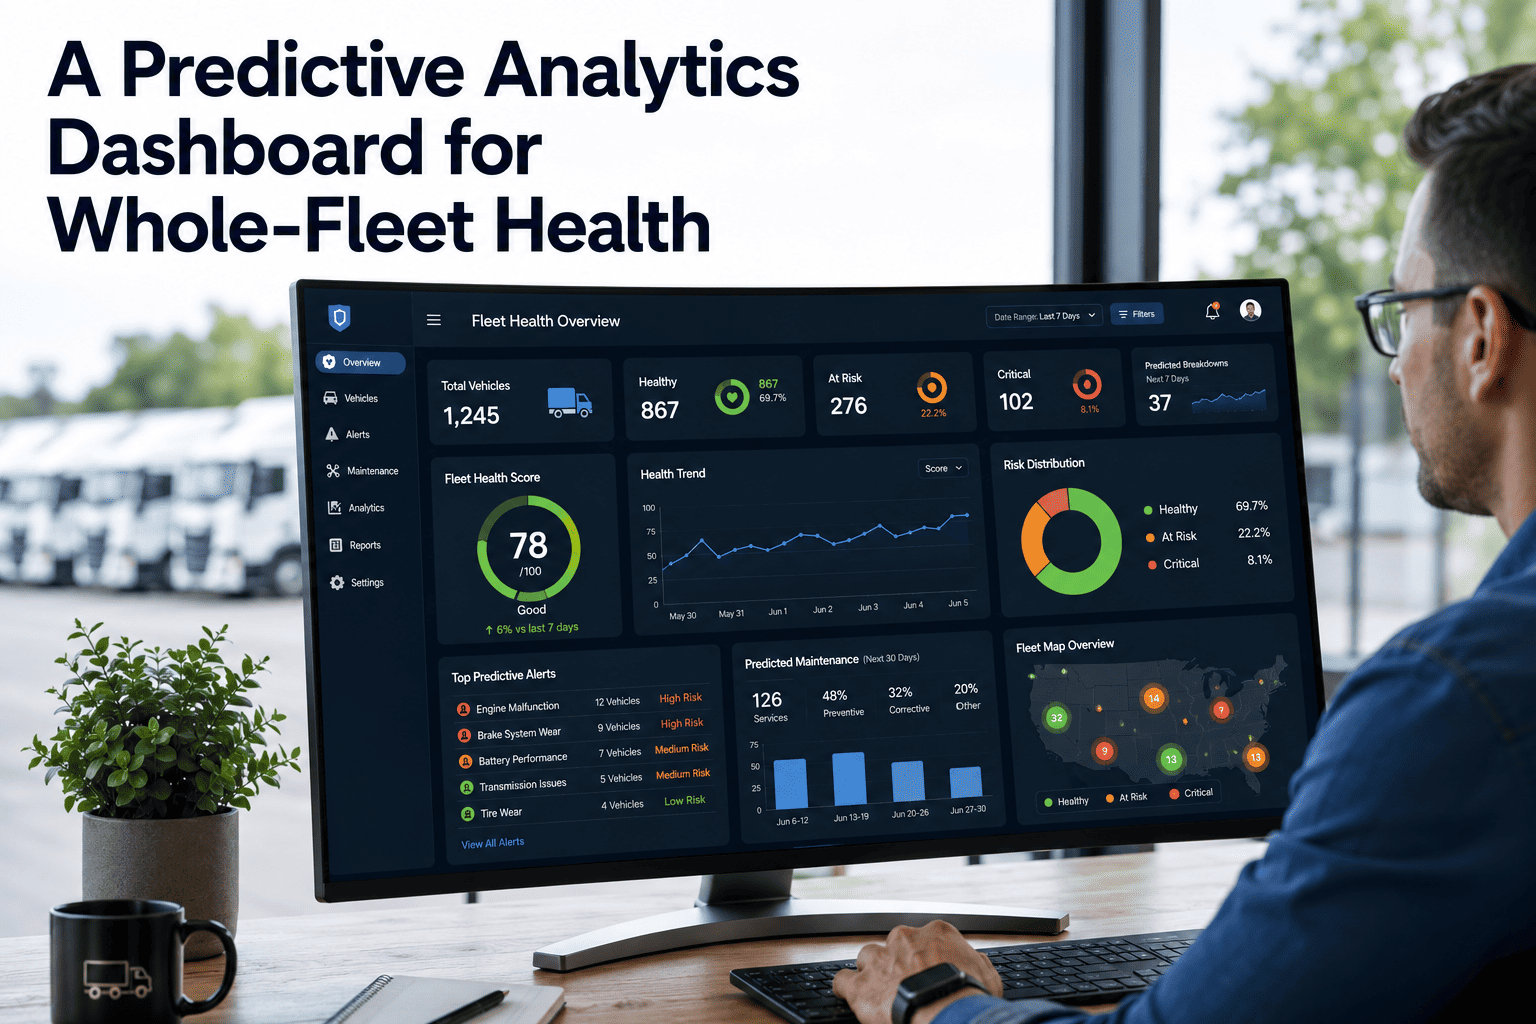
Oxmaint pulls telematics, work orders, inspections, and driver data into one dashboard, so leadership sees a problem the same day it starts instead of the following Friday.
Why Fleet Data Keeps Outrunning Fleet Reports
Most fleets are not short on data — they are short on a single place to see it. GPS pings, fuel receipts, maintenance invoices, driver logs, and compliance records typically sit in five or six disconnected systems, and the only way to make sense of them is a manual export that is already outdated the moment it lands in an inbox. Tracking every available metric does not fix this; a dashboard showing forty numbers with equal visual weight causes what analysts call dashboard fatigue, where managers simply stop opening it. The fix is not more data — it is fewer, better-prioritized numbers refreshed in real time, with everything else available one click deep.
The Four KPI Pillars Every Fleet Dashboard Needs
Industry practice in 2026 layers a dashboard around four North Star numbers shown large at the top, with four to six diagnostic metrics beneath them and everything else available on drill-down.
01
Cost Per Mile
The master number that blends fuel, maintenance, depreciation, insurance, and labor into one figure. Top-quartile fleets run $0.38-0.42; bottom-quartile fleets exceed $0.55.
1 cent of CPM on a 50-truck fleet equals roughly $40,000 a year
02
Asset Utilization
The share of scheduled time a vehicle is actually working instead of idle or in the shop. Low utilization quietly ties up capital that could be redeployed or sold.
Underused assets are a top driver of the 5-10% annual budget waste
03
Unplanned Downtime
Every hour a truck sits broken instead of dispatched. Roughly 78% of unplanned downtime is preventable with earlier visibility into failing components.
$448-760 lost per vehicle for every day of unplanned downtime
04
PM Compliance
The percentage of scheduled preventive maintenance completed on time. Compliance below 90% reliably predicts a spike in breakdowns within the following quarter.
Disciplined fleets push PM compliance past 95%
Weekly Spreadsheet vs. Centralized Live Dashboard
The gap between fleets that outperform and fleets that fall behind is rarely fleet size or driver quality — it is how fast each team can see a problem forming.
| What Changes |
Weekly Spreadsheet Export |
Oxmaint Centralized Dashboard |
| Data freshness |
Already stale by the time it is built |
Refreshed automatically in real time |
| Outlier detection |
Found only if someone happens to notice |
Threshold alerts flag it the same day |
| Time to insight |
4-6 hours of manual merging each week |
Live on one screen, no exports needed |
| Decision speed |
Reactive — action follows the breakdown |
Proactive — action precedes the breakdown |
| Typical cost outcome |
CPM drifts upward unnoticed |
2-5 cent CPM improvement within year one |
Four Places Outliers Hide Until They Get Expensive
01
Cost Creep Across Categories
Fuel, parts, and labor costs rise a little each month across many vehicles at once. No single line item looks alarming, so nobody flags it — until the quarterly total is unrecognizable.
02
Reliability Decline Before Breakdown
A rising rate of repeat work orders on one vehicle is the earliest signal of a failure. Buried in a monthly spreadsheet, that pattern is invisible until the truck is towed off the road.
03
Safety Risk Invisible Until The Incident
Harsh braking and rising near-miss events point straight at a coaching need. Without a live feed of driver behavior, the first time anyone sees the pattern is after an accident report.
04
Capital Trapped In Underused Assets
A vehicle running at half its expected utilization is quietly draining budget through depreciation and insurance without producing revenue — and it rarely shows up until an annual review.
How Oxmaint Centralizes Your Fleet's Reporting
Oxmaint connects the systems most fleets already run — telematics, inspections, work orders, and driver records — into a single dashboard, so a hard-braking event, a repeat repair, or an idle truck all speak the same language.
01
Dashboard Live Within An Hour
Your first KPI view populates automatically from inspection and work order data as soon as you connect it — no months-long setup project.
02
Role-Based Views
Executives see cost and margin; maintenance leads see repeat work orders; dispatch sees availability — the same data, filtered to what each role actually acts on.
03
Automated Threshold Alerts
When a vehicle crosses three hard-braking events in a week, or PM compliance dips below target, Oxmaint raises the flag instead of waiting for someone to spot it.
04
One-Click Reporting
Weekly leadership summaries, compliance packages, and cost breakdowns generate on demand — no manual exports, no spreadsheet rebuilds on a Friday afternoon.
From Spreadsheet To Single Screen
Put Your Cost, Uptime, and Safety Data On One Live Dashboard
Most teams find their first actionable outlier — an underused vehicle, a maintenance pattern, or a cost spike — within the first week of connecting Oxmaint.
The Return On Centralized Reporting
2-5¢
CPM improvement in year one
Worth $40,000-$100,000 annually on a 50-truck, 80,000-mile fleet
30%
Fewer unplanned breakdowns
When PM compliance and downtime become visible in real time
35-45%
Lower accident rates
Once driver safety data is visible weekly instead of after an incident
90 days
To measurable improvement
Typical window for CPM and availability gains after adopting a live dashboard
Frequently Asked Questions
How is centralized reporting different from the dashboard my telematics provider already gives me?+
A telematics dashboard shows GPS and driving data in isolation. Centralized reporting links that same data to maintenance history, cost, and utilization so one number explains another.
See it connected in a free trial.
How many KPIs should actually be on the main dashboard screen?+
Four. Cost per mile, utilization, downtime, and PM compliance are the North Star metrics that predict margin; everything else belongs one click deep, not on the front screen.
Do I need to replace my existing telematics or fuel card system?+
No. Oxmaint connects to the systems you already run and layers centralized reporting on top, so existing hardware and contracts stay in place while visibility improves immediately.
How quickly will leadership see a usable insight after setup?+
Most fleets identify their first actionable finding — an underutilized vehicle, a cost outlier, or a maintenance pattern — within the first week of connecting their data.
Can smaller fleets benefit from centralized reporting, or is it only worth it at scale?+
Even a 10-truck fleet loses real money to unnoticed cost drift and downtime. A modest CPM improvement compounds fast at any size.
Book a demo to see it sized to your fleet.
Centralized Fleet Reporting — Oxmaint
Stop Reading Last Friday's Numbers. Start Seeing Today's.
One dashboard for cost, uptime, safety, and utilization — built to flag an outlier while it is still cheap to fix, not after it becomes a nuclear budget line.