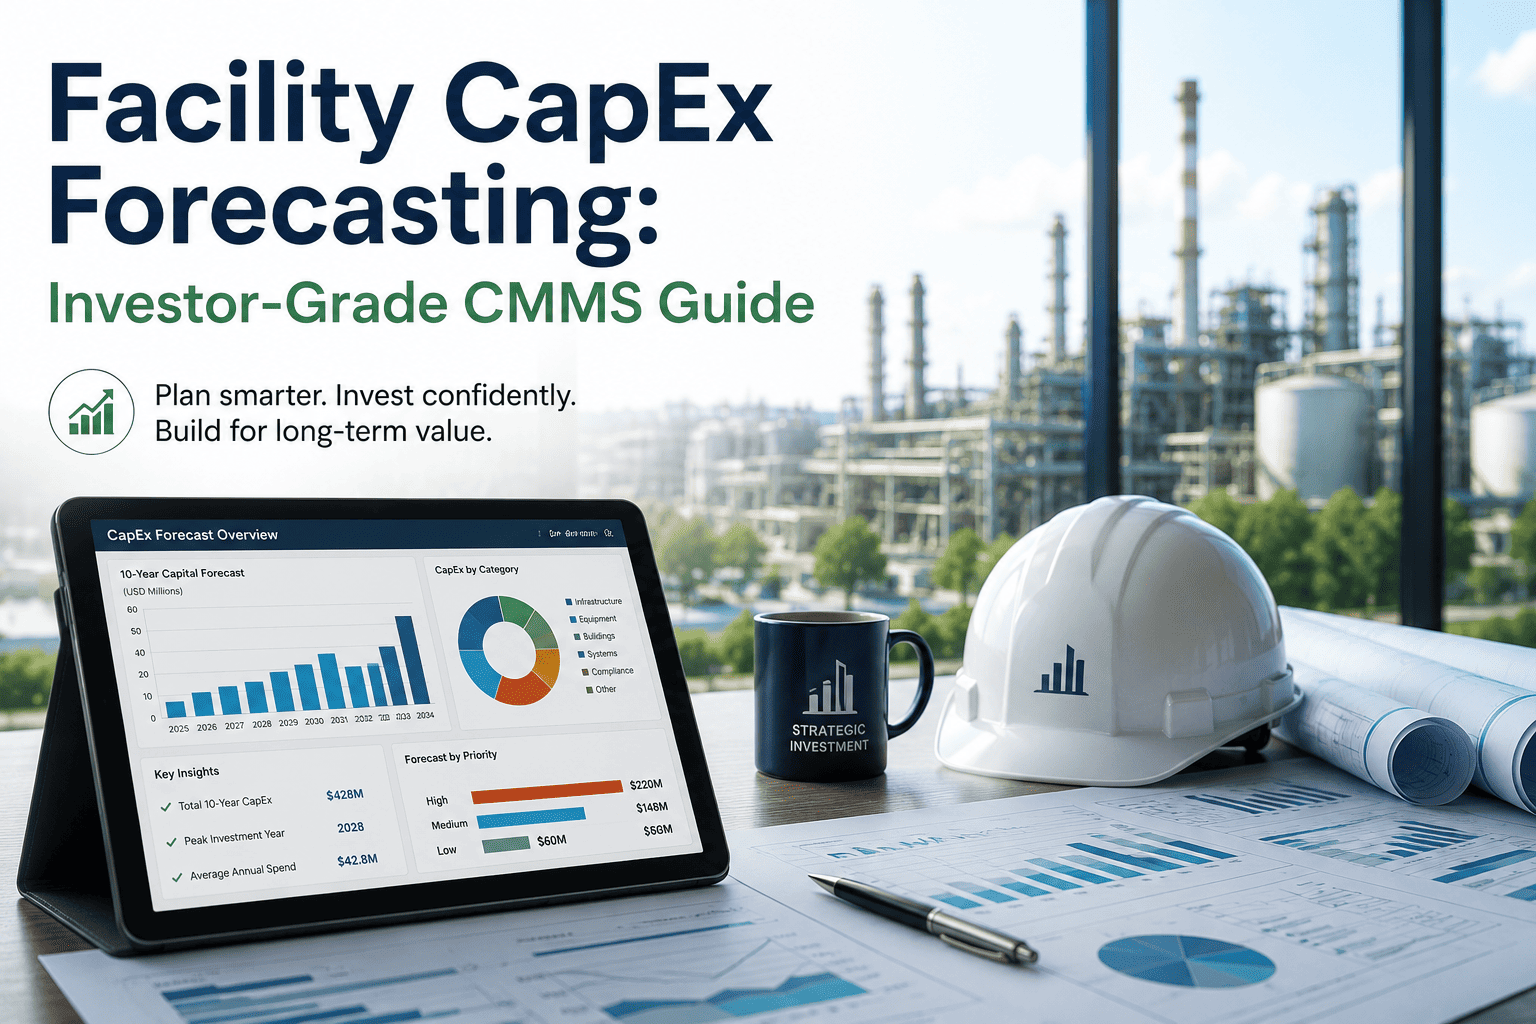
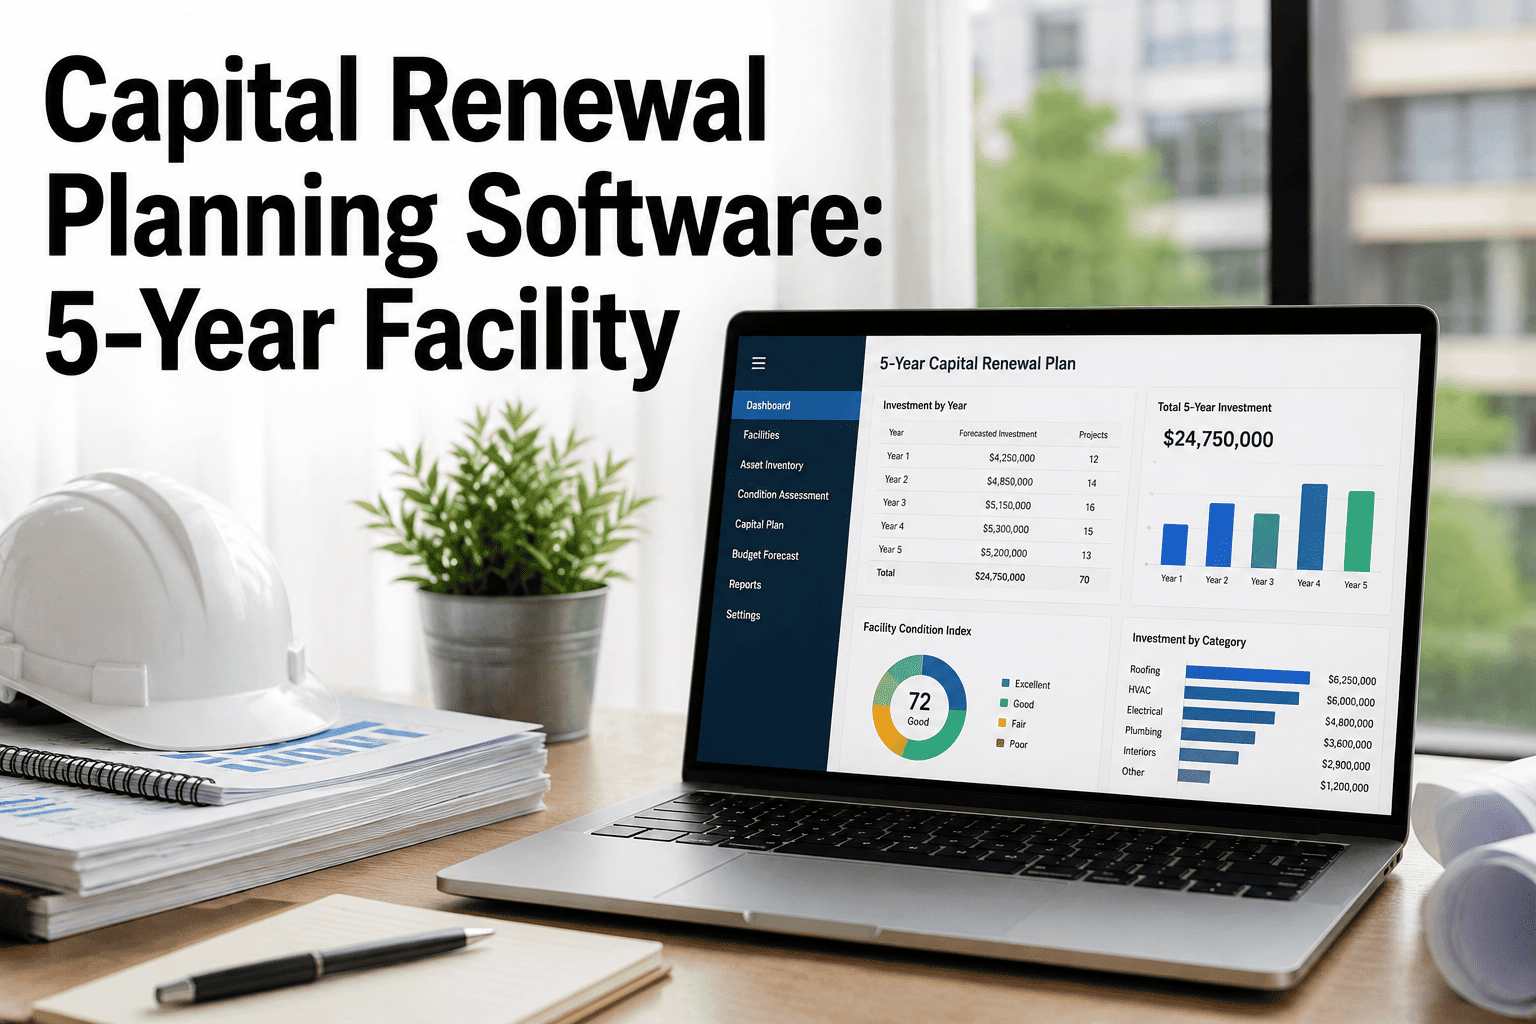
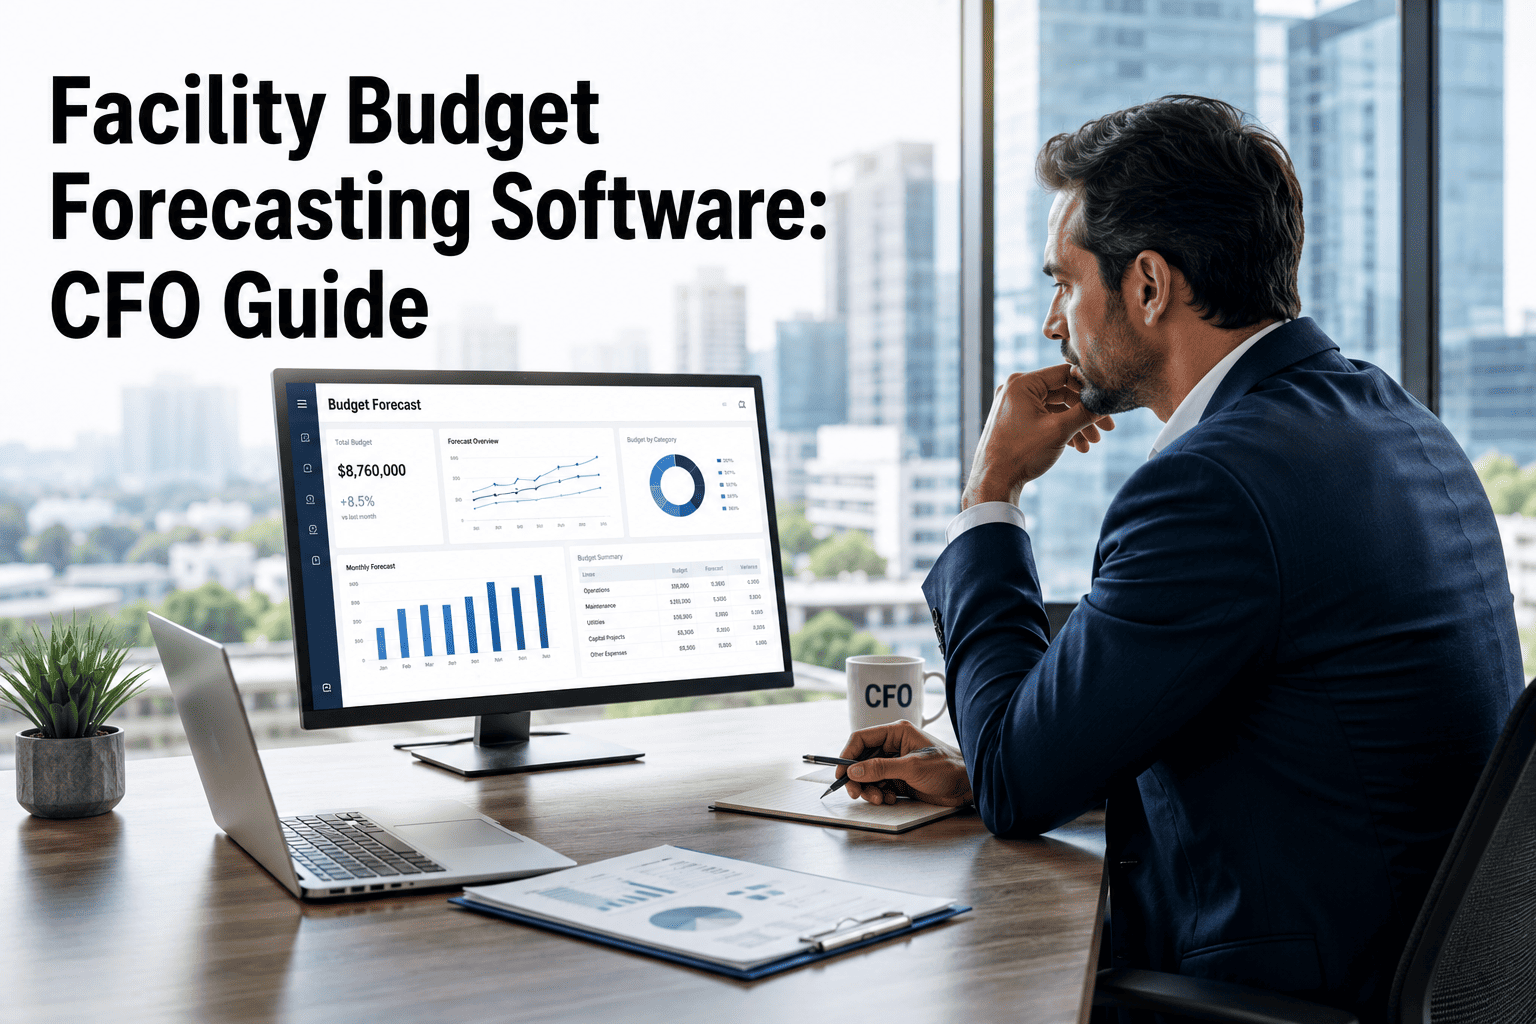
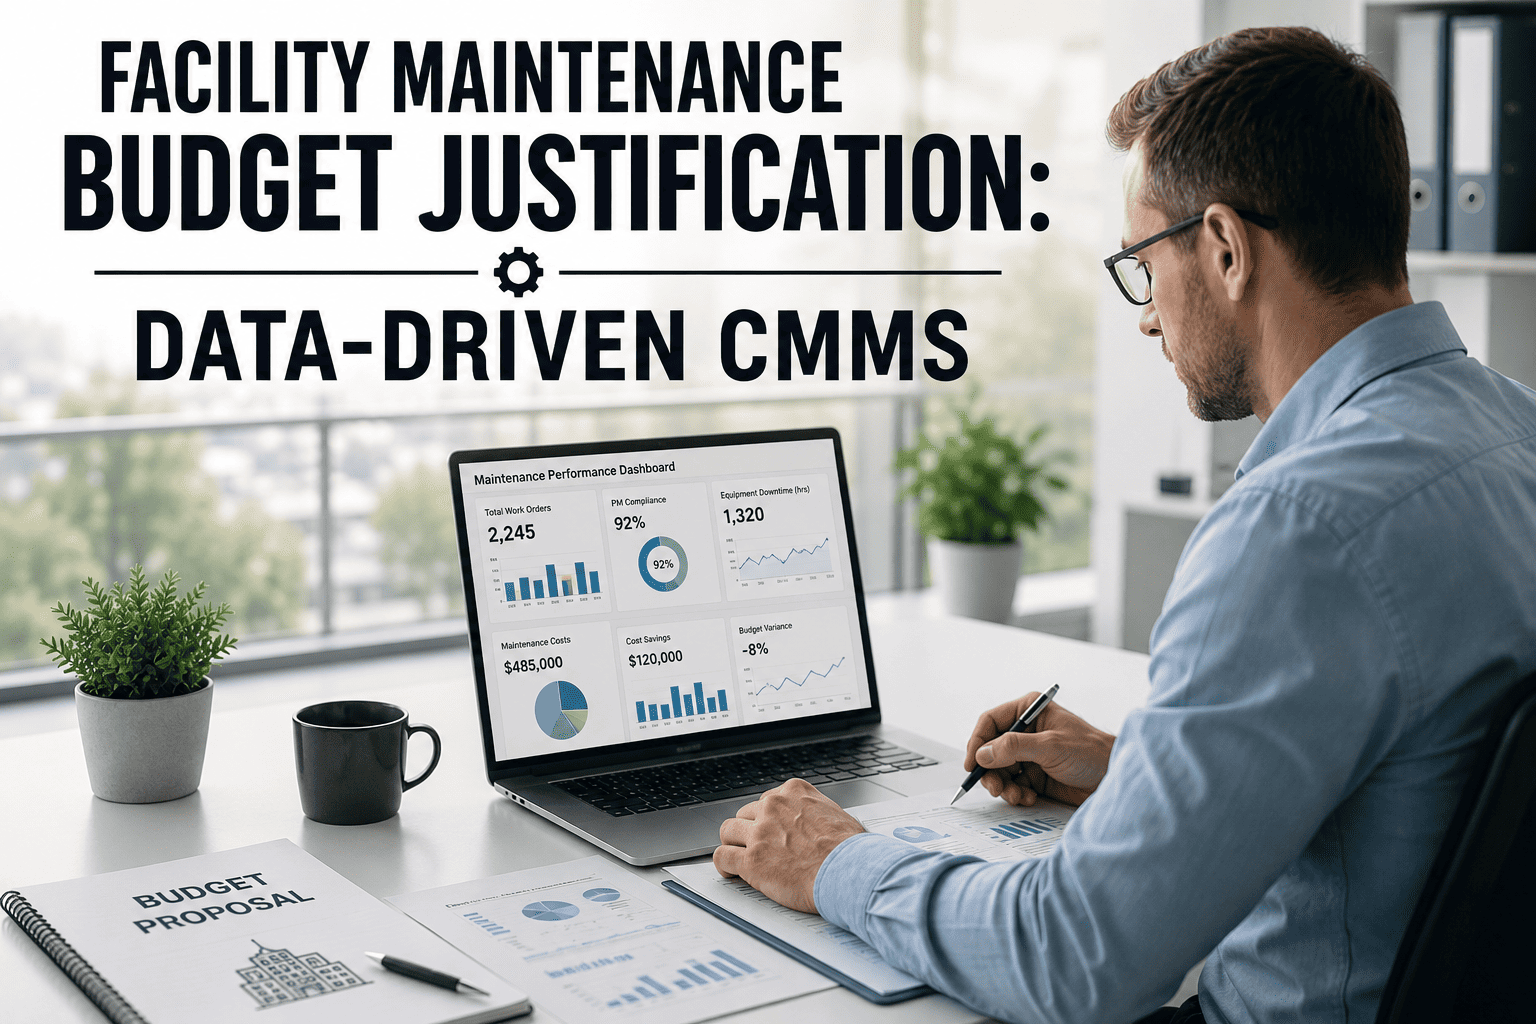
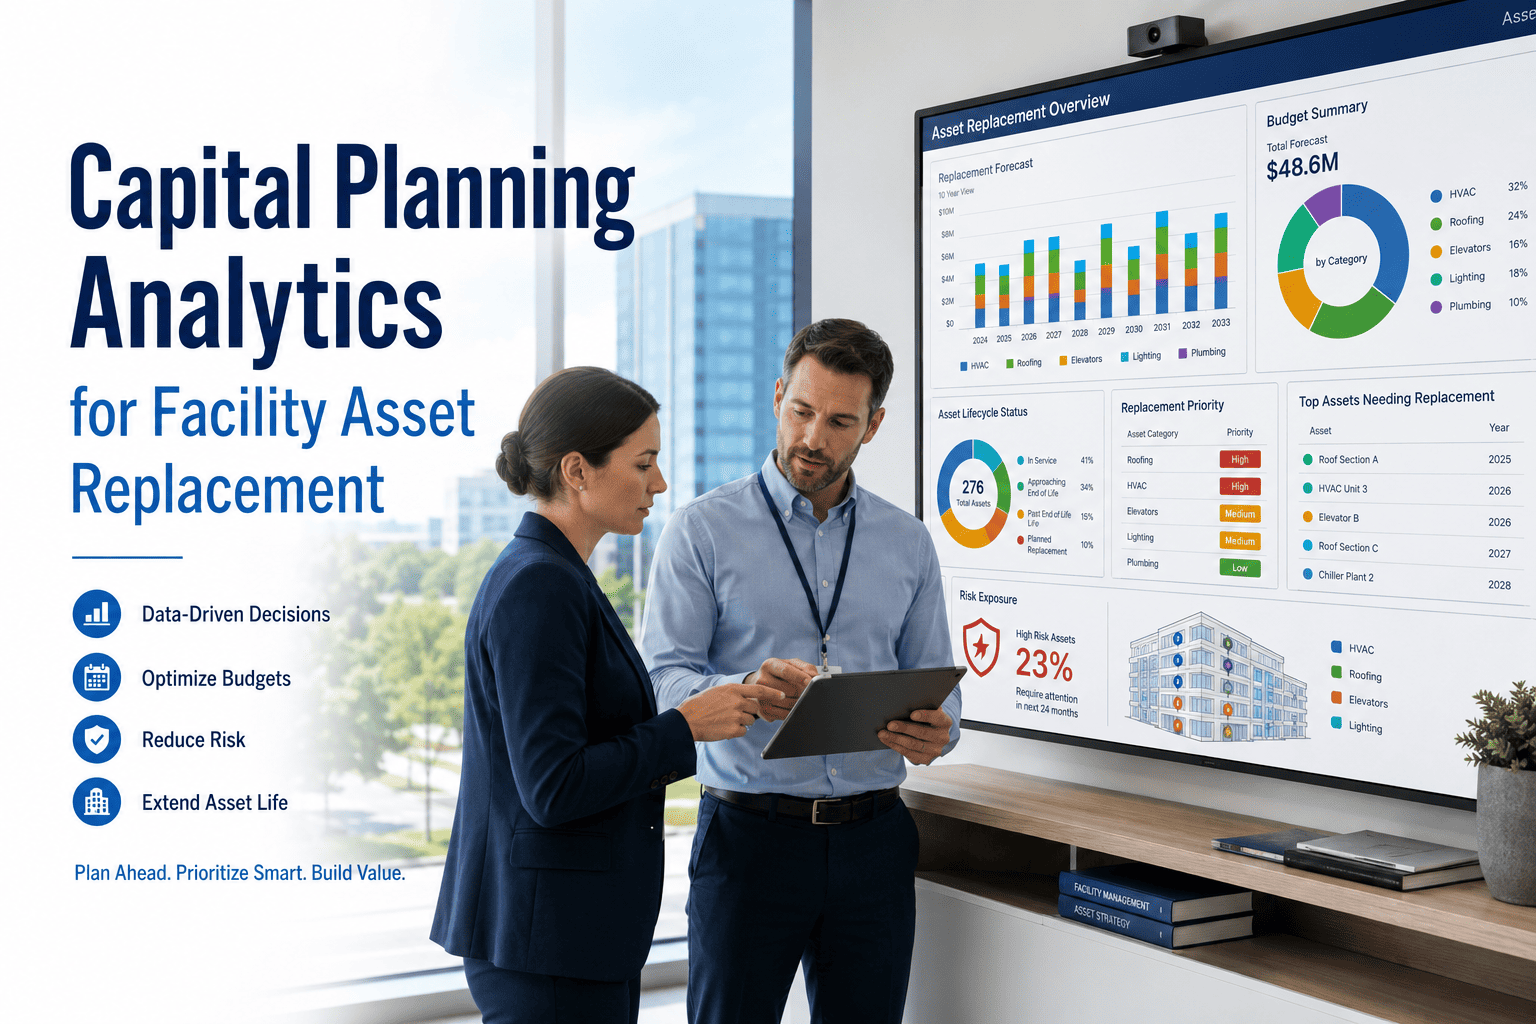
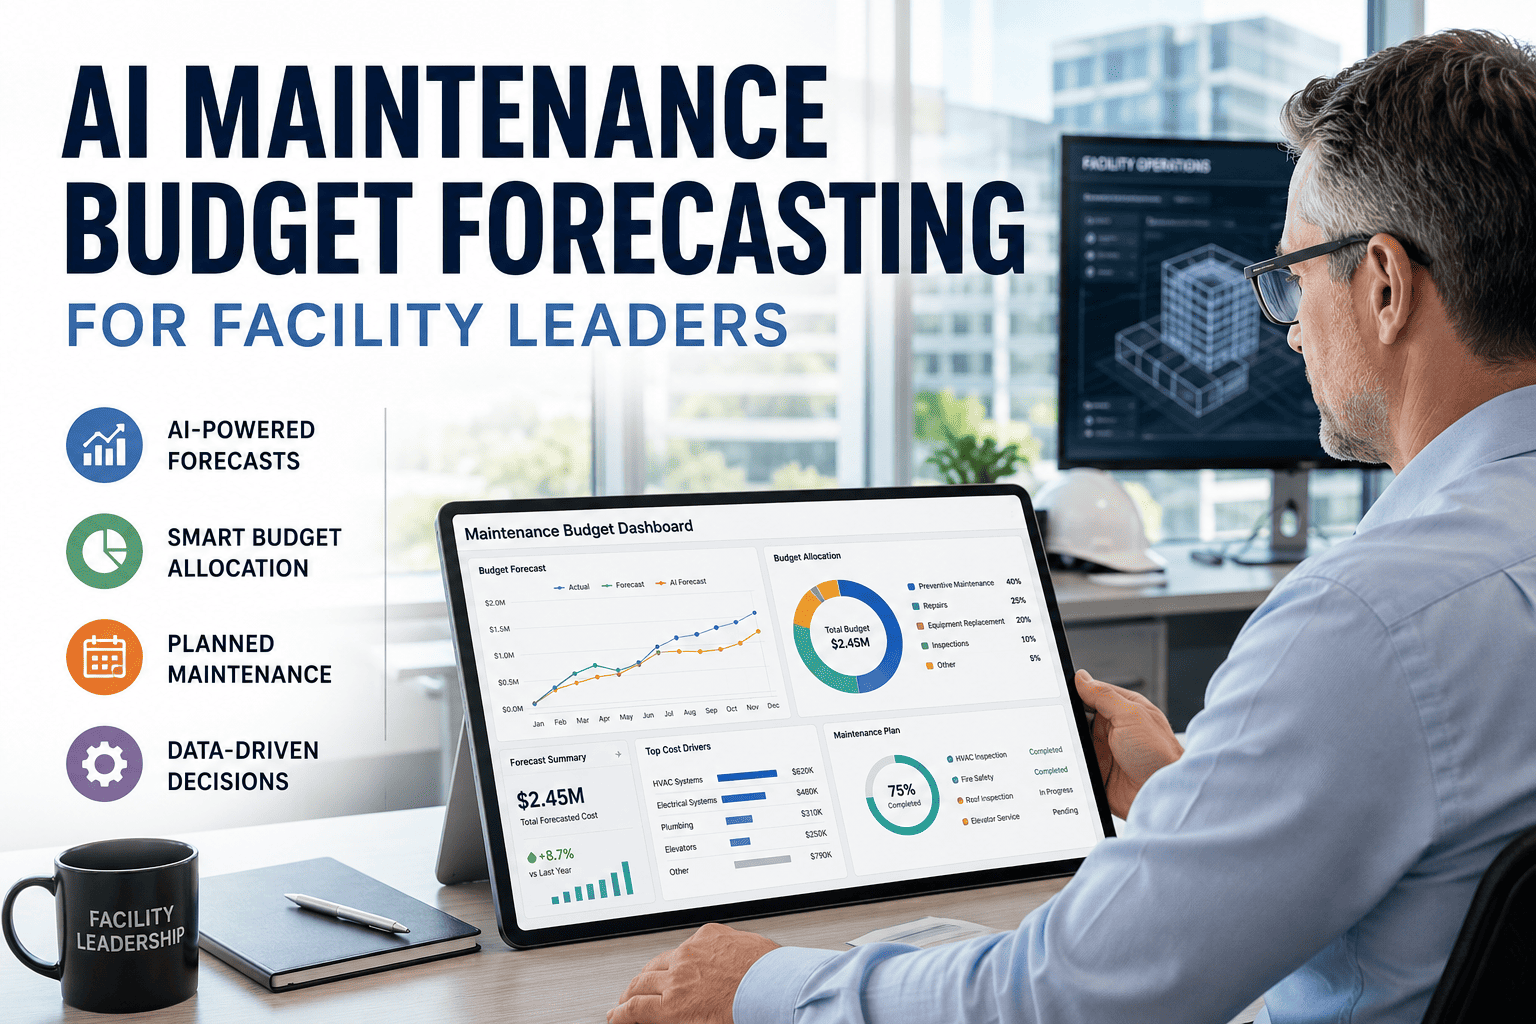
When a facility director asks a CFO for eight million dollars in capital funding, the first question is never about the equipment, it is about the evidence behind the number. Most teams still build that number from last year's budget plus a rounding adjustment, and CFOs can tell the difference immediately. An investor-grade forecast instead traces every dollar back to asset condition, remaining useful life, and real maintenance cost history, so the request survives scrutiny instead of getting sent back for revision. Facility teams already sitting on years of work order and inspection data are holding the raw material for this kind of forecast, they just have not connected it to a capital plan yet, and booking a demo is the fastest way to see it done with your own numbers.
Investor-Grade Guide · Facility CapEx Forecasting · 2026
Facility CapEx Forecasting: The Investor-Grade CMMS Guide
How facility leaders turn work order history and asset condition data into a five-year capital plan that a CFO can actually approve, instead of a spreadsheet that gets questioned line by line.
40–65%
Typical CapEx budget variance when forecasts skip asset condition data
4.8x
Cost premium of an emergency replacement over a planned one
38%
Average cut in emergency capital spend after switching to condition-based forecasting
5–7%
Annual inflation escalator needed on every multi-year capital plan built in 2026
Why Most Capital Requests Get Sent Back
A capital ask rarely fails because the equipment does not need replacing. It fails because nothing in the request proves the timing, the cost, or the risk of waiting another year. These are the three gaps that show up most often once a forecast reaches finance.
Forecasts Built On Guesswork
Without asset condition data behind the number, CapEx variance runs 40 to 65 percent, so finance pads every line with contingency and the whole plan loses credibility before the meeting starts.
Numbers That Are Already Stale
Pulling a report from spreadsheets and paper logs takes 6 to 12 hours per property, and by the time it reaches the boardroom the underlying condition data is already months old.
Capital Nobody Planned For
Emergency replacements cost 4.8 times more than planned ones, and most teams only learn an asset was critical after it has already failed on the floor.
How An Investor-Grade Forecast Actually Gets Built
A forecast that survives CFO review is not one report, it is a chain of five data steps that each feed the next. Skip a step and the number at the end reverts to a guess with a nicer chart around it.
1
Condition Capture
Inspection scores, meter readings, and repair frequency get logged against every asset, not just the ones that recently broke down.
→
2
Remaining Useful Life
Actual deterioration rates replace the manufacturer's generic schedule, so replacement timing reflects how the asset has really performed.
→
3
Total Cost Modeling
Parts, labor, downtime, and repair trend lines are combined into one total cost of ownership figure per asset.
→
4
Scenario Comparison
Repair-and-extend is weighed against replace-now across a rolling five to ten year window, with inflation escalation built in.
→
5
Board-Ready Output
The forecast exports as a ranked capital plan with photos and cost trends attached, ready for the finance committee.
Facility CapEx · OxMaint · 2026
See Your Own Assets Turned Into A Five-Year Forecast
OxMaint pulls the condition scores, cost history, and replacement timing already sitting in your maintenance records and turns them into a capital plan your CFO can actually sign off on.
Guesswork Budgeting vs Investor-Grade Forecasting
| Planning Dimension |
Traditional Capital Budgeting |
Investor-Grade CMMS Forecasting |
| Data source |
Last year's budget, age estimates, and staff memory |
Condition scores, work order history, and meter data per asset |
| Budget accuracy |
40 to 65 percent variance from actual spend |
Under 15 percent variance when condition data drives the plan |
| Update frequency |
Once a year, already outdated by the next quarter |
Rolling forecast that updates as new maintenance data arrives |
| Emergency capital |
Frequent, at roughly 4.8 times planned replacement cost |
Reduced by an average of 38 percent through earlier flagging |
| Evidence for finance |
A spreadsheet with numbers nobody can trace back to a source |
Condition photos, cost trends, and RUL data attached per asset |
| Portfolio view |
Each site builds its own request with no shared ranking |
One ranked list comparing every site on the same scoring model |
Building Your Five-Year Forecast In Four Stages
Teams that get a forecast approved on the first pass tend to follow the same rough sequence, moving from raw data to a defensible plan rather than trying to produce the final number on day one.
1
Score Every Asset
Start with the highest-value systems: HVAC, roofs, electrical, and life safety, and give each one a current condition score.
2
Calculate RUL and TCO
Convert condition and cost history into a remaining useful life estimate and a total cost of ownership per asset.
3
Model The Scenarios
Compare repair-and-extend against replace-now across a five to ten year window, with inflation built into every year.
4
Package The Plan
Rank assets by urgency and risk, attach the supporting data, and hand finance a plan instead of a promise.
Expert Perspective
Boards do not reject capital requests because the number is too high, they reject them because nobody can explain where the number came from. Once a forecast is traced back to real condition data instead of an age assumption, the conversation changes completely, finance stops negotiating the total and starts asking which projects to sequence first. The teams who get funded consistently are not the ones asking for the least, they are the ones who can defend every figure on the page without opening a second document.
Marcus Ferreira, CPA, CFM
Certified Facility Manager and capital planning advisor, 18 years working with municipal and commercial portfolios on CFO-facing budget approval
Frequently Asked Questions
What makes a CapEx forecast investor-grade instead of a standard budget?
An investor-grade forecast ties every replacement figure to asset condition, remaining useful life, and cost history, so it can be traced and defended rather than accepted on trust.
Start free to build one from your own asset data.
How is this different from the work order side of a CMMS?
Work orders and PM schedules handle day-to-day execution. Forecasting takes that same accumulated data and projects it forward into a multi-year capital plan for finance.
How many years should a facility capital forecast cover?
Most teams run a rolling five-year forecast for near-term budgeting, extending to ten years when the plan needs to support bond requests or long-range reserve planning.
What data does a CMMS need before it can forecast CapEx accurately?
Asset age, inspection or condition scores, repair frequency, and maintenance cost history are the minimum inputs. More history produces a tighter, more defensible forecast.
Can this help defend a request in front of a CFO or board?
Yes, the forecast exports with condition photos, cost trends, and scenario comparisons attached, so every figure has a source that finance can check.
Book a demo to see a live export.
Facility CapEx Forecasting · OxMaint · 2026
Stop Defending A Budget You Cannot Trace
OxMaint turns the condition data, work orders, and cost history you already have into a rolling five-year capital forecast your finance team can approve with confidence.