Facility teams filing hundreds of work orders every month rarely notice the pattern hiding in plain sight: the same HVAC unit on Floor 3 generates 11 tickets a year, the parking garage lighting section gets repaired six times before anyone checks the panel, and restroom complaints cluster around a single plumbing riser every 30 days. AI work order clustering software reads your maintenance history and surfaces these patterns automatically — grouping tickets by asset, location, root cause, and complaint type — so your team stops repairing symptoms and starts eliminating the source. Start free on Oxmaint and see how AI clustering transforms your maintenance backlog into actionable insight within days.
AI Automation · Facility Management · CMMS Intelligence
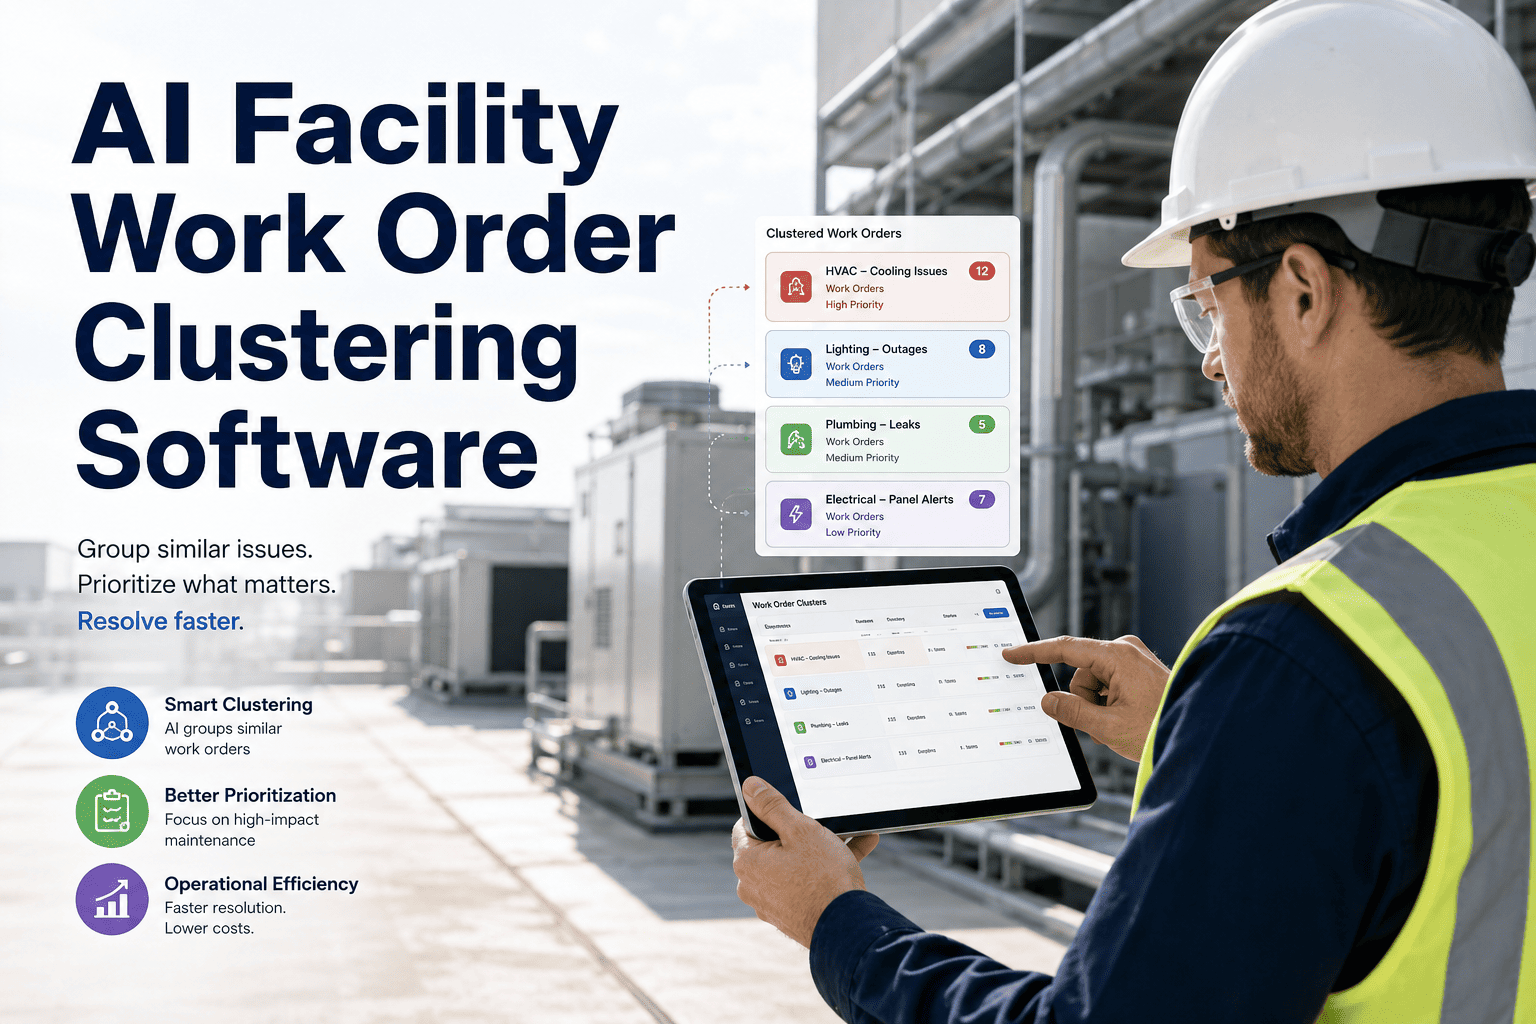
AI Facility Work Order Clustering Software
Stop treating every work order as a one-off event. AI clustering groups similar tickets by asset, location, root cause, and complaint pattern — so your team fixes problems once, not repeatedly.
38%
of facility work orders are repeat repairs on the same asset
3.2x
higher labor cost on reactive vs. pattern-detected repairs
60 days
average lag before manual teams spot a repeat failure pattern
The Hidden Cost of Unclustered Work Orders
Without AI clustering, maintenance teams treat every ticket as isolated. The real problem — a failing asset, a bad installation, a recurring complaint — stays invisible until costs spiral.
01
Labor Wasted on Repeat Dispatches
Technicians are sent to the same location multiple times because no one connects the tickets. Each trip looks like a new job. AI clustering flags the pattern after the second occurrence — not the sixth.
02
Parts Spend Without Root Cause
Replacing the same component every 45 days burns parts budget. Clustering reveals that the root cause is upstream — a voltage fluctuation, a failing motor bearing, a clogged drain — not the part being replaced.
03
Occupant Complaints Ignored as Isolated
Comfort complaints from the same building zone get logged and closed individually. Clustered, they reveal a systematic HVAC imbalance or damper failure affecting 40 occupants — invisible until grouped.
04
Asset Replacement Delayed or Missed
An asset approaching end of life generates increasing repair tickets. Without clustering, each ticket looks minor. Grouped by asset ID over 12 months, the failure trajectory becomes obvious before a critical breakdown.
How AI Work Order Clustering Works
Oxmaint's AI analyzes open and historical work orders across four clustering dimensions simultaneously — giving your team a multi-lens view of where problems actually live.
AI Clustering Engine
Asset Clustering
Groups all tickets tied to the same asset ID — reveals high-frequency assets needing replacement or deep PM review
Location Clustering
Maps tickets to floor, zone, or room — uncovers infrastructure issues causing complaints across multiple systems
Complaint Type Clustering
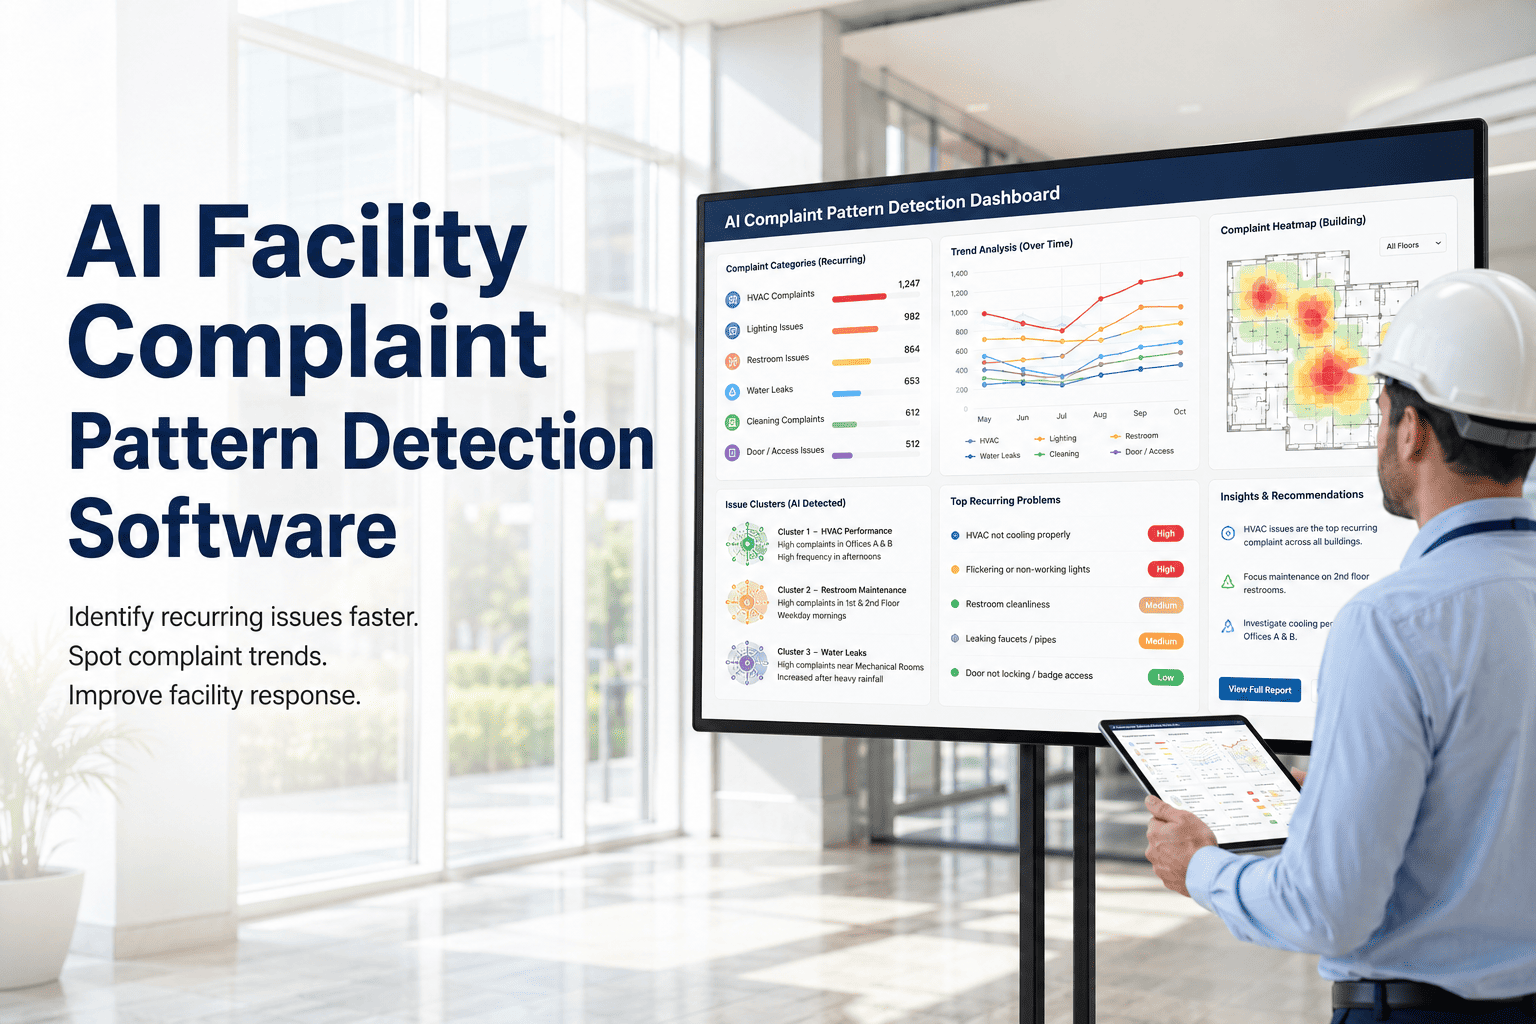
Matches complaint descriptions using NLP — groups "too cold," "drafty," and "temperature issues" as one HVAC pattern
Root Cause Clustering
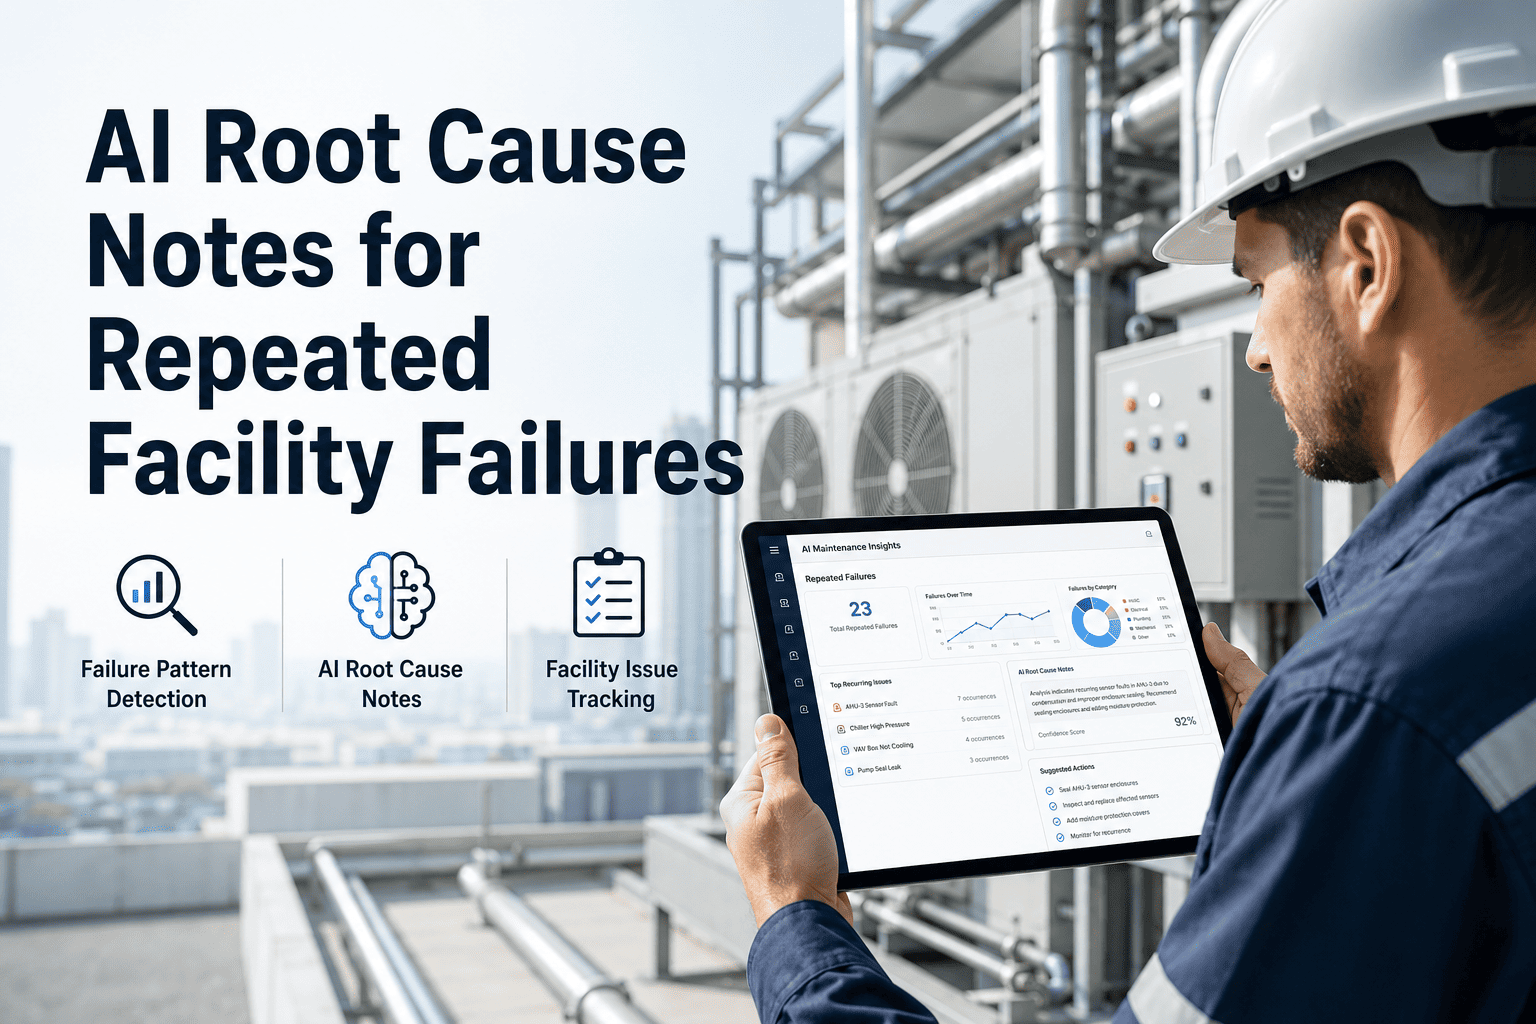
Links repair codes and technician notes to surface shared failure modes across different assets or locations
Cluster Types and What They Tell You
Not all clusters mean the same thing. Understanding cluster type drives the right corrective action — from PM schedule changes to capital replacement decisions.
| Cluster Type |
What AI Detects |
Recommended Action |
Typical Savings |
| High-Frequency Asset |
5+ tickets on same asset in 90 days |
Asset condition audit, replacement assessment |
Avoid 3–6 repeat dispatches per quarter |
| Location Hot Spot |
Multiple systems failing in same zone |
Infrastructure inspection (electrical, plumbing, structural) |
Resolve 4–8 tickets with a single root-cause fix |
| Complaint Pattern |
Semantic similarity in occupant descriptions |
Comfort audit, system balancing, HVAC calibration |
Reduce occupant complaint volume 25–40% |
| Seasonal Recurrence |
Same failure each year in same window |
Add pre-season PM to prevent recurrence |
Eliminate reactive cost of annual repeat event |
| Shared Root Cause |
Same repair code across different assets |
Fleet-wide PM or parts standardization review |
Single corrective action fixes multiple assets |
See Your Repeat Repair Patterns in 24 Hours
Oxmaint connects to your existing work order data and surfaces clustering insights on day one — no manual analysis required.
What Clustering Looks Like in Practice
Real facility teams using AI clustering shift from reactive firefighting to pattern-based prevention within weeks of deployment.
Technician dispatched to Floor 3 HVAC — again
Work order closed, root cause: "unit repaired"
Same unit generates ticket 3 weeks later
10 separate tickets in 6 months, each treated independently
Year-end audit: $14,000 in reactive spend on one unit
After 2nd ticket, AI flags asset cluster forming
Manager alerted: 2 tickets, same asset, 18 days apart
Full condition audit triggered — compressor bearings failing
Planned replacement scheduled in next downtime window
8 future tickets eliminated. Reactive spend avoided: $11,200
Expert Review
FM
Facilities Management Insight
Operations Intelligence Review
AI work order clustering is one of the highest-ROI features a facility team can deploy. The average facility generates 200–400 work orders per month — far too many for any manager to spot patterns manually. Research from BOMA and IFMA consistently shows that 30–40% of facility maintenance spend is avoidable when repeat failures are identified and addressed at root cause. The most effective implementations use clustering not just as a reporting tool but as an operational trigger — automatically escalating clustered asset groups to a PM review or capital planning queue. Teams that do this reduce their reactive-to-planned maintenance ratio by 20–30 percentage points within one operating year.
Frequently Asked Questions
How does AI work order clustering differ from standard CMMS reporting?
Standard CMMS reports show you what happened — a list of closed work orders, average completion time, or open backlog count. AI clustering actively reads across your work order history to identify hidden patterns, grouping tickets by shared attributes you would not manually connect. It surfaces insights like "this asset has 7 tickets in 60 days" or "three different complaint types in Zone B all trace to the same duct riser" — insights that standard reports never generate.
Book a demo to see how Oxmaint clustering differs from traditional reporting.
What data does Oxmaint need to start clustering work orders?
Oxmaint needs work order records including asset ID or location, complaint description or category, and open/close dates. Historical data going back 6–12 months produces the strongest initial clusters, though patterns begin emerging after as few as 30 days of new data. Technician notes, repair codes, and parts used enrich the clustering quality significantly.
Start free on Oxmaint and connect your existing CMMS data through our import tools.
Can clustering work orders help justify capital replacement decisions?
Yes — this is one of the strongest use cases for AI clustering. When an asset generates a documented cluster of 8 or more tickets within 12 months, the repair cost total becomes a concrete number you can compare against replacement cost. This data-driven case for capital replacement is far more persuasive to budget approvers than a technician's verbal recommendation.
Book a demo to see how Oxmaint generates capital justification reports from cluster data.
How quickly do teams typically see results from AI work order clustering?
Most facility teams identify their first high-value clusters within 2–4 weeks of deploying Oxmaint. Initial clusters often surface long-running repeat repair problems that were invisible in daily operations — with one corrective action eliminating months of future reactive work. Facilities with 12 months of historical data often see 5–10 significant clusters on day one of analysis.
Try Oxmaint free and run your first cluster analysis on existing data.
Stop Fixing the Same Problems Twice
Oxmaint's AI clustering gives facility managers the pattern intelligence to eliminate repeat repairs, reduce reactive spend, and make smarter asset decisions — starting with the data you already have.