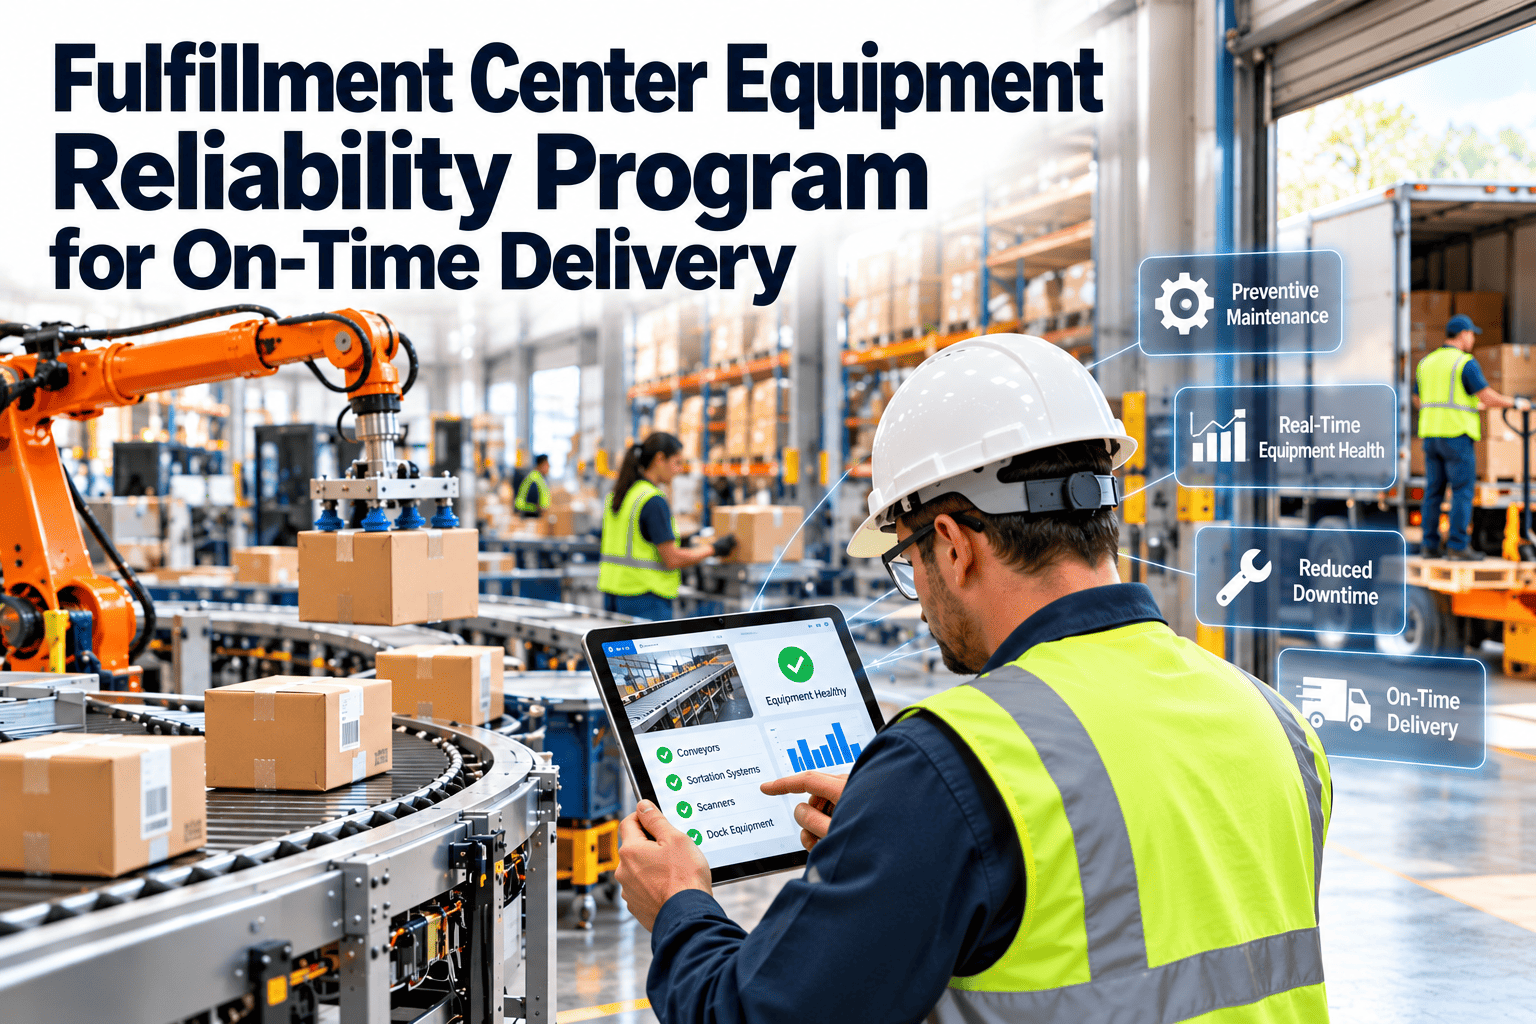
A distribution center rarely misses peak season because of one dramatic failure. It happens when conveyors, lift trucks, dock doors, and packing lines each lose a little availability at the wrong moment and the combined effect stalls outbound volume. A reliability program replaces firefighting with a ranked, scheduled approach to keeping equipment running when demand is highest. This guide shows how to rank assets by criticality, choose a maintenance strategy for each asset class, stock the right spares, and build the records foundation with a maintenance management system that your technicians will actually use.
Fulfillment Center Equipment Reliability Program for On-Time Delivery
Warehouse equipment failures stall fulfillment and delivery alike. Build a program that ranks equipment by consequence, schedules the right work, and keeps critical assets running through peak demand.
Tier A: single points of failure
Inspect often, monitor condition, hold critical spares
Tier B: important, partly redundant
Time-based preventive schedule
Tier C: low consequence
Basic care, planned replacement
Reactive Repair Versus a Reliability Program
The difference is not effort. Technicians in reactive sites often work harder. The difference is whether work is chosen by consequence or by whoever called last.
Reactive site
Equipment is serviced when it stops
Every asset is treated as equally important
Spare parts are ordered after the failure
History lives in technicians' memory
Peak season is managed with contractors and overtime
Reliability program
Work is scheduled from criticality and condition
Tier A assets receive the most attention
Critical spares are stocked against known failures
Every repair is recorded against the asset
Peak readiness is completed weeks before volume rises
Step One: Rank Equipment by Criticality
Score each asset on two questions: how likely is it to fail, and what happens to throughput when it does? The intersection sets the tier.
Failure likelihood: low
Likelihood: medium
Likelihood: high
Consequence: high
Tier B
Tier A
Tier A
Consequence: medium
Tier C
Tier B
Tier A
Consequence: low
Tier C
Tier C
Tier B
Factors to include when scoring consequence
- Does outbound or inbound flow stop completely, or can work reroute?
- Is there a standby unit, a manual workaround, or none?
- Is there a safety exposure for employees if it fails?
- How long does repair take, including parts lead time?
- How much of peak-season volume depends on it?
Step Two: Match Maintenance Strategy to Asset Class
Warehouse equipment fails in different ways, so one schedule does not fit all. Always start with manufacturer guidance and adjust for your duty cycle.
| Asset class | Common failure pattern | Strategy | Typical checks |
|---|---|---|---|
| Conveyors and accumulation | Belt tracking, worn rollers, drive and motor faults, sensor misreads | Preventive plus condition checks | Belt condition, roller noise, motor temperature, photo-eye cleaning |
| Lift trucks and reach trucks | Brake, mast, tire, battery, and hydraulic wear | Usage-hour preventive plus daily operator checks | Forks, chains, hoses, battery water and connectors, horn and lights |
| Dock levelers and doors | Hydraulic leaks, worn hinges, damaged seals | Time-based preventive | Lip operation, hydraulic fluid, door tracks, seals |
| Racking and shelving | Impact damage, bent uprights, missing safety clips | Scheduled inspection, impact reporting | Upright plumb, beam locks, floor anchors, load signage |
| Automated storage and shuttles | Wheel wear, sensor drift, communication faults | Preventive plus condition-based | Rails, wheels, encoders, fault-code history |
| Charging rooms and chargers | Cable damage, ventilation problems, failed chargers | Preventive | Connectors, cables, ventilation, charge completion logs |
| Packing, labeling, strapping | Jams, worn knives and heaters, misprints | Preventive and consumable replacement | Blades, heat elements, print heads, belts |
Step Three: Stock Spares by Consequence, Not by Habit
Critical spares
Parts for Tier A assets that would halt flow and have long lead times. Hold on site, with minimum quantities and a named owner.
Fast-moving consumables
Belts, rollers, filters, fuses, sensors, and wear items replaced on schedule. Set reorder points from actual usage history.
Shared and vendor-held
Expensive, rarely used parts that a supplier can deliver fast. Record lead times and contacts so nobody searches during an outage.
Rules that keep the storeroom useful
- Tie every part to the asset it serves so shortages are visible before a job starts.
- Review parts used on emergency work orders each month and add repeat items to stock.
- Count critical spares on a fixed cycle instead of trusting the system balance.
Peak Readiness Timeline
The best peak preparation happens while the building is still calm.
12 to 8 weeks out
Review last season's downtime by asset. Confirm Tier A list. Order long-lead parts.
8 to 4 weeks out
Complete overdue preventive work and inspections on all Tier A and B equipment. Fix known defects.
4 to 1 weeks out
Run trial shifts at peak rates. Confirm temporary workers are trained on daily equipment checks.
During peak
Short daily reliability huddle, rapid response rota, minimal non-essential shutdowns.
After peak
Hold a failure review, update schedules, and plan deferred work while volumes drop.
Keep Critical Equipment Ahead of Peak Demand
Oxmaint organizes assets, preventive maintenance, work orders, and spare parts in one place, so reliability work is planned instead of improvised.
Climbing the Reliability Maturity Ladder
Level 4: Predictive and reliability-centered
Failure modes analyzed, strategies tuned from data, sensors on selected Tier A assets.
Level 3: Condition-based
Work triggered by readings, runtime, and inspection findings, not only the calendar.
Level 2: Preventive
Scheduled tasks by asset with compliance tracking.
Level 1: Reactive
Repairs when equipment fails, limited history.
Reliability Metrics That Show Whether the Program Works
| Metric | Meaning | Action it supports |
|---|---|---|
| Equipment availability | Share of scheduled time an asset is ready to run | Prioritize Tier A improvement |
| Mean time between failures | Average run time between breakdowns | Evaluate whether strategy changes help |
| Mean time to repair | Average time from failure to restart | Find parts, diagnosis, or staffing delays |
| Preventive maintenance compliance | Planned tasks completed on time | Spot overloaded schedules |
| Planned versus reactive work | Share of hours spent on scheduled work | Track shift from firefighting |
| Repeat failures | Same fault returning on the same asset | Trigger root cause analysis |
Where Oxmaint Fits in the Program
Asset registry
Every conveyor section, truck, door, and charger recorded with tier, location, and history.
Preventive schedules
Time-, usage-, and inspection-based tasks assigned to the right technicians.
Work orders
Corrective and emergency jobs tracked from request to completion on mobile devices.
Inventory
Spare part levels, reorder points, and usage by asset.
Reporting
Dashboards for compliance, downtime, repeat failures, and cost.
Failure Modes Behind Warehouse Downtime
Most equipment failures develop over weeks or months and give off signals first. A reliability program is largely the practice of noticing those signals and acting before the machine stops.
| Failure mode | How it develops | How to detect it | Control |
|---|---|---|---|
| Bearing and roller wear | Contamination and lack of lubrication raise friction and heat | Noise, vibration, temperature rise | Lubrication routes, periodic vibration or temperature checks |
| Belt and chain stretch | Tension drops gradually under load and cycling | Tracking problems, slipping, visible slack | Tension inspection and replacement at defined limits |
| Sensor contamination | Dust and film cover lenses and reflectors | Nuisance stops, missed detections | Scheduled cleaning and function testing |
| Hydraulic seal leakage | Seals harden and wear with cycling and contamination | Fluid on floor, slow movement | Leak checks, fluid sampling, scheduled seal replacement |
| Battery and charger decline | Charge cycles, heat, and poor charging habits reduce capacity | Shorter runtime, long charge times | Charge logs, connector inspection, rotation rules |
| Structural impact damage | Repeated forklift contact weakens uprights and guards | Visible bends, gaps, loose anchors | Impact reporting and scheduled rack inspection |
Who Does What in a Reliability Program
Reliability fails when it belongs to one person. Spread clear responsibilities across the people who touch the equipment.
Equipment operators
Complete short daily checks, report abnormal noise, leaks, and damage immediately, and stop using unsafe equipment. Their reports are the earliest warning the program receives.
Maintenance technicians
Perform preventive tasks, diagnose faults, and record what they found and fixed. Good records turn each repair into data for the next decision.
Planners and schedulers
Prepare work orders, confirm parts and tools, and fit tasks into operating windows so technicians spend their time on repairs instead of searching.
Operations supervisors
Release equipment for service, protect scheduled windows, and escalate repeat problems before they affect shift targets.
Site leadership
Review reliability metrics, approve spare parts investment, and decide when to repair, refurbish, or replace aging assets.
Root Cause Analysis After a Failure
Fixing the symptom restores output for today. Finding the cause prevents the next breakdown. Not every failure needs a full investigation, so set clear triggers.
When to investigate
- Any failure of a Tier A asset that stopped flow.
- A repeat failure of the same component within a defined period.
- Any failure that created a safety incident or near miss.
- Failures that consumed significant labor, parts, or outside contractor cost.
A practical investigation sequence
- Preserve evidence, including the failed part, photos, fault codes, and operator statements.
- Review the asset history for similar events, overdue tasks, and recent changes.
- Ask why repeatedly until you reach a cause the site can control, such as a missing lubrication task or a wrong part.
- Assign a corrective action with an owner and date, then confirm it was completed.
- Update the preventive task list or spare parts plan so the lesson persists.
Common Reliability Program Mistakes
Treating every asset the same
Effort is spread thinly, so critical equipment gets no more attention than a spare pallet jack. Rank assets first and concentrate effort where consequences are highest.
Writing tasks nobody can finish
Overloaded schedules produce skipped work and false compliance. Size task lists to available labor and operating windows.
Ignoring operator reports
When reports disappear without feedback, operators stop making them. Close the loop on every defect submitted.
Stocking spares by gut feel
Shelves fill with parts that never move while critical items run out. Use failure history and lead times to set levels.
Never retiring tasks
Tasks that find nothing for years add cost without value. Review and adjust intervals using actual findings.
Measuring only breakdowns
Reliability also depends on compliance, backlog age, and repeat failures, which reveal problems before output drops.
A 90-Day Starting Plan
Days 1 to 30: Foundation
List every asset that affects throughput, record location and model, and score criticality. Gather manuals and past repair records. Choose the ten assets whose failure hurts most and agree on a baseline for availability, repair time, and emergency work share.
Days 31 to 60: Schedules and spares
Build preventive tasks for Tier A and B assets from manufacturer guidance and technician experience. Set minimum stock for critical spares and name an owner for each. Start capturing every repair on a work order, including cause and time spent.
Days 61 to 90: Control and improve
Hold a weekly review of compliance, backlog, and repeat failures. Investigate the worst failures and adjust tasks accordingly. Share results with operations so scheduled downtime windows become a normal part of the plan rather than a negotiation.
Quick Wins That Build Momentum
A reliability program earns support when operations sees fewer stoppages. Start with changes that are cheap, visible, and fast.
- Standardize a one-page daily check for lift trucks and conveyors, and review the results at the start of each shift.
- Clean and test all photo-eyes and reflectors on automated lines, because dirty sensors cause a large share of nuisance stops.
- Tag every critical asset with a clear identifier so work orders and failure histories attach to the right machine.
- Move repeat emergency parts into stock, using the last six months of urgent purchases as the guide.
- Publish a weekly one-page summary showing downtime, overdue tasks, and the top three recurring problems, so everyone sees the same picture.
Warehouse Equipment Reliability FAQs
Where should a reliability program start?
Start with a Tier A list of the assets whose failure stops flow. Build schedules and spares for those before expanding.
How is reliability different from preventive maintenance?
Preventive maintenance is one tool. Reliability also covers criticality, failure analysis, spares, and continuous improvement.
Do we need sensors on every machine?
No. Reserve monitoring for high-consequence assets. Most equipment benefits more from consistent inspections. Start with inspections today.
How do we manage temporary peak staff?
Give them short mobile checklists for daily equipment checks and a clear defect reporting path.
Can one system cover several buildings?
Yes, assets and schedules can be organized by site. Book a demo to see multi-site reporting.
Make Peak Season a Planned Event
Rank your equipment, schedule the work that protects it, and keep every repair on record. Begin with the assets your throughput depends on.