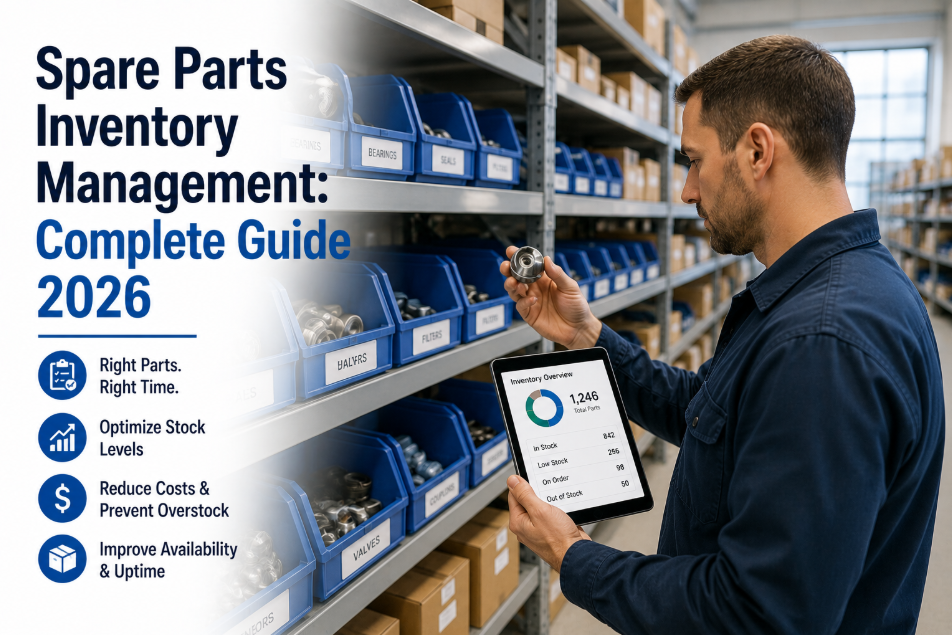
Spare Parts Inventory Management: Complete Guide 2026
Maintenance teams spend an average of 23% of every repair event waiting for parts. Not diagnosing the fault. Not performing the repair. Waiting — because the right component is not on the shelf, the reorder was not triggered, and the emergency procurement process is now consuming both time and budget at a 4.8x cost premium. Spare parts inventory management is the unsexy half of maintenance operations that determines whether your technicians spend their shift turning wrenches or standing at a storeroom window. The facilities that have solved this problem — with structured ABC analysis, automated reorder points, and parts directly linked to asset records — report 40% lower parts expenditure, 58% faster repair completion, and MTTR reductions that translate directly into fewer downtime hours and lower production loss. OxMaint's spare parts inventory module connects every part to the assets it serves, automates reorder when stock falls below minimum, and runs ABC analysis to show you exactly where your inventory budget is generating value and where it is collecting dust. Want to see parts inventory connected to your work orders? start a free trial or book a demo and see a live parts catalog built around your asset base.
Analytics and KPIs · Maintenance Operations · 2026 Complete Guide
Spare Parts Inventory Management: The Complete CMMS Guide for Maintenance Teams
Reorder points, ABC analysis, vendor management, and automated procurement — everything you need to stop losing repair time to parts stockouts.
23%
of every repair event spent waiting for parts — not diagnosing or repairing
40%
lower parts expenditure with ABC analysis and automated reorder in CMMS
58%
faster repair completion when critical spares are stocked and linked to assets
4.8x
cost premium on emergency parts procurement versus planned stocking
OxMaint's spare parts inventory links every component to the assets it serves, automates reorder at configurable minimum stock levels, and runs ABC analysis to prioritize your stocking budget. Start a free trial and load your first parts catalog in under 24 hours, or book a demo to see automated reorder running on live inventory data.
Why Spare Parts Management Breaks Down Without a CMMS
Parts management failure is not a purchasing problem or a storage problem. It is a data problem. Without a connected system, critical inventory decisions are made on memory, guesswork, and whoever shouted loudest after the last stockout. These are the six failure modes that consistently drain maintenance budgets and inflate MTTR.
No Minimum Stock Levels
Parts are reordered after stockout — not before. The discovery moment is when a technician arrives at a failed asset and finds the storeroom empty. The repair waits 2-7 days for procurement while production loses output and the technician does paperwork.
Impact: 47% of extended MTTR is caused by parts unavailability, not repair complexity
Over-Stocking Low-Criticality Parts
Without ABC analysis, storerooms accumulate large quantities of cheap, readily available parts while critical, long-lead-time components sit at zero stock. Capital is tied up in slow-moving inventory while high-risk stockouts occur on the items that matter most.
Impact: Average maintenance storeroom holds 22% obsolete or over-stocked inventory
Parts Not Linked to Assets
Storeroom catalogs exist as separate spreadsheets with no connection to the assets that use each part. When a technician gets a work order, they cannot see from the CMMS which parts are compatible, available, and in stock for that specific asset — requiring a manual storeroom trip before any wrench is turned.
Impact: Unlinked parts catalogs add 35-60 minutes of search time per repair event
No Vendor Performance Tracking
Multiple vendors supply the same part category with different lead times, quality levels, and pricing. Without vendor performance data in the CMMS, procurement always defaults to the same familiar supplier regardless of whether that supplier is delivering the best value — or the worst lead times on critical components.
Impact: Facilities with vendor performance tracking save 12-18% on parts procurement annually
No Consumption History Per Asset
Without tracking which parts were used on which work orders for which assets, it is impossible to identify which assets are consuming disproportionate parts budget, which component failure modes are recurring, or when the cost of repeat parts purchases approaches the cost of asset replacement.
Impact: 20% of assets consume 80% of parts budget — invisible without asset-linked consumption data
Emergency Procurement as Normal Practice
When planned stocking fails, emergency procurement becomes the default. The same part costs 4.8x more on emergency order due to expedited freight, after-hours vendor fees, and market rate premiums. Facilities running reactive maintenance spend 35-45% of their parts budget on emergency procurement that proper stocking would eliminate.
Impact: $8,400 average annual emergency parts premium per critical asset — preventable with reorder automation
ABC Analysis: The Framework That Prioritizes Your Stocking Budget
ABC analysis classifies every part in your inventory by its criticality to operations and its consumption value — so your stocking budget protects the parts that matter most, not the parts that happen to be cheapest or most familiar. It is the single most impactful framework for reducing both stockout risk and inventory carrying cost simultaneously.
A
Class A — Critical Parts
10-20% of SKUs · 70-80% of parts spend impact
High-criticality, high-value parts for critical assets. Long lead times. Stockout causes production shutdown or safety risk. These are your insurance inventory — carried at defined minimum stock regardless of cost. No Class A part should ever be at zero stock.
Minimum stock: 2-4 units maintained at all times
Reorder trigger: Automatic when stock hits minimum
Supplier: Primary and backup vendor identified
Review cycle: Monthly stock count and verification
Moderate criticality, moderate value parts for important but not mission-critical assets. Medium lead times. Stockout causes delay but not immediate shutdown. Stock at lower minimums with faster reorder cycles to balance cost and availability.
Low criticality, low value parts for non-critical equipment. Short lead times — available same-day or next-day from multiple suppliers. Do not over-stock. Carry minimal inventory or order on-demand. Over-stocking Class C parts is where most maintenance budgets leak unnecessarily.
Minimum stock: Zero to 1 unit — order on demand
Reorder trigger: As needed, not automatic
Supplier: Lowest cost qualified vendor
Review cycle: Annual — eliminate obsolete stock
Examples: Standard fasteners, cable ties, lubricants, general consumables, light bulbs
OxMaint automatically classifies your parts catalog using ABC analysis based on consumption history and asset criticality scores. The classification updates dynamically as usage patterns change — no manual re-categorization required. Start a free trial and run your first ABC analysis within 48 hours, or book a demo to see live classification running on a parts catalog like yours.
Reorder Points and Safety Stock: The Calculation Behind Automated Procurement
Automated reorder only works when the trigger levels are calculated correctly. Set them too high and you over-stock. Set them too low and you stockout before the replenishment arrives. These formulas give you defensible, data-backed reorder parameters for every part in your catalog.
Reorder Point (ROP)
ROP = (Average Daily Usage x Lead Time) + Safety Stock
Example: A compressor seal used 0.3 times per day on average, with a 14-day vendor lead time and 5-unit safety stock.
ROP = (0.3 x 14) + 5 = 9.2 — round up to 10 units.
When stock hits 10, OxMaint automatically triggers a purchase order to the preferred vendor.
Safety Stock Calculation
Safety Stock = Z-score x Standard Deviation of Daily Usage x Square Root of Lead Time
Simplified approach: For most maintenance storerooms, use 50-100% of average lead time usage as safety stock for Class A parts, 25-50% for Class B, and zero for Class C. This covers 95%+ of demand variability without requiring statistical analysis.
Economic Order Quantity (EOQ)
EOQ = Square Root of (2 x Annual Demand x Order Cost) / Holding Cost per Unit
Example: 48 units annual demand, $25 order processing cost, $4 annual holding cost per unit.
EOQ = Square root of (2 x 48 x 25) / 4 = 24.5 — order 25 units each time.
This minimizes the combined cost of ordering too often and holding too much stock.
Inventory Turnover Rate
Turnover = Annual Parts Consumption Value / Average Inventory Value
Target benchmarks: Class A parts: 6-12 turns per year. Class B parts: 3-6 turns per year. Class C parts: 1-3 turns per year. Turnover below 1 for Class A signals over-stocking risk. Turnover above 15 for Class A signals stockout risk.
OxMaint calculates reorder points automatically from your work order consumption history and configured vendor lead times. You set the safety stock policy per part class — the system handles the math and fires purchase orders automatically when thresholds are crossed. No spreadsheet. No manual monitoring. Book a demo to see automated reorder configured for your parts catalog.
Manual Parts Management vs. CMMS-Driven Inventory
Inventory Function
Manual / Spreadsheet Management
OxMaint CMMS-Driven Inventory
Stock Level Monitoring
Weekly manual count — stockouts discovered at point of need
Real-time quantity tracking — updated automatically when parts are issued from work orders
Reorder Triggering
Manual — someone notices stock is low and remembers to order
Automatic purchase order generated when stock crosses configured reorder point
Parts Linked to Assets
Separate catalog — technician must know which part fits which asset
Every part linked to compatible assets — technician sees available parts directly from the work order
ABC Classification
None — all parts treated with equal stocking priority
Automatic ABC classification from consumption history and asset criticality scores
Consumption Tracking
Not tracked — no data on which assets consume which parts
Every part issue logged against the work order and asset — full consumption history per SKU
Vendor Management
Single familiar vendor — no performance comparison data
Multiple vendors per part with lead time, quality, and pricing tracked for comparison
Emergency Procurement
Frequent — stockouts trigger emergency orders at 4.8x cost premium
Rare — automated reorder prevents stockout on Class A and B parts before emergency arises
Inventory Cost Reporting
Manual compilation — monthly snapshot with no trend analysis
Real-time inventory value, turnover rate, dead stock, and parts spend by asset and system
OxMaint Spare Parts Features That Drive Inventory Performance
Effective spare parts management requires more than a digital parts list. It requires parts connected to assets, consumption feeding reorder logic, and procurement triggered automatically. Here is how OxMaint handles every layer of the inventory stack.
Parts Catalog
Asset-Linked Parts Database
Every part in your catalog linked to the assets it is compatible with. When a technician receives a work order for Air Handler AHU-01, they see immediately which parts are required, which are in stock, and where they are located in the storeroom — from their mobile device before they leave their workbench.
Reorder Automation
Automatic Purchase Order Generation
Configure minimum stock levels and preferred vendors for every part. When inventory drops to the reorder point, OxMaint generates a purchase order automatically — directed to the preferred vendor at the configured quantity. Class A parts never hit zero. Emergency procurement becomes the exception, not the rule.
ABC Analysis
Dynamic Inventory Classification
OxMaint classifies every part as A, B, or C based on actual consumption frequency, asset criticality, and spend impact. Classification updates automatically as usage patterns change. Dead stock is flagged for review. Over-stocked Class C items are identified for reduction. Stocking budget is redirected to where it matters.
Mobile Issuance
Parts Issued From Work Orders in the Field
Technicians scan or select parts from the mobile work order interface. Inventory quantity updates instantly when parts are issued. No storeroom clerk required. No end-of-day reconciliation. Stock levels reflect reality in real time — which is the only way reorder automation works accurately.
Vendor Management
Multi-Vendor Performance Tracking
Manage multiple vendors per part with lead time, quality score, and pricing recorded for every supplier. Compare vendors across the same SKU. Route reorders to the vendor delivering best value for each part class — A-class parts to the fastest supplier, C-class parts to the cheapest. Vendor performance data is built from actual PO history, not assumptions.
Reporting
Inventory Cost and Consumption Analytics
Real-time reports showing total inventory value, turnover rate by class, dead stock identification, parts spend by asset and system, and emergency procurement frequency. The data you need to defend your storeroom budget — and to identify the 22% of inventory that is generating zero operational value.
What CMMS-Driven Spare Parts Management Delivers
40%
Lower parts expenditure
ABC analysis redirects stocking budget to critical parts — eliminating over-stocking of low-value items and reducing emergency procurement frequency
58%
Faster repair completion
when critical spares are stocked, linked to assets, and visible on mobile work orders — technicians arrive prepared and complete repairs in a single visit
$8,400
Emergency premium eliminated
average annual emergency parts cost saving per critical asset when automated reorder prevents stockout events that previously triggered 4.8x cost procurement
22%
Dead stock identified
of average maintenance storeroom inventory is obsolete or over-stocked — ABC analysis and turnover reporting surface these items for liquidation or reallocation
Frequently Asked Questions
How do we determine the right minimum stock level for critical spare parts?
Calculate your reorder point using: (Average daily consumption x vendor lead time in days) + safety stock. For Class A critical parts with long lead times, carry safety stock equal to 50-100% of average lead time consumption. In OxMaint, this calculation is done automatically from your work order consumption history — you set the safety stock policy (aggressive, moderate, or conservative) and the system calculates the reorder point per SKU. For parts with no consumption history (new storeroom setup), use OEM recommended spare lists as your starting point, then refine after 90 days of actual usage data.
What is the difference between spare parts inventory and MRO inventory?
Spare parts inventory refers specifically to replacement components for equipment — motors, bearings, seals, circuit boards — that are used during corrective or preventive maintenance work. MRO (Maintenance, Repair, and Operations) inventory is broader and includes consumables, safety supplies, janitorial products, office supplies, and any non-production item used to keep operations running. In OxMaint, both are managed in the same inventory module but classified differently — allowing separate tracking of parts spend versus MRO consumable spend, which is important for accurate maintenance cost reporting and budget defense.
How often should we perform cycle counts on our parts storeroom?
Class A parts should be counted monthly — the consequences of an inaccurate quantity on a critical part are too high to rely on system records alone. Class B parts quarterly. Class C parts annually. With CMMS-driven inventory where parts are issued directly from work orders on mobile devices, system quantities are typically accurate to within 2-3% without manual counts — because every transaction updates the record immediately. Most OxMaint customers reduce count frequency by 60% compared to manual storerooms while improving accuracy, because real-time issuance eliminates the main source of count discrepancy: unrecorded informal parts withdrawal.
Can OxMaint integrate spare parts reorder with our existing ERP purchasing system?
Yes. OxMaint integrates with ERP systems via REST API for purchase order synchronization. When OxMaint generates a reorder trigger, it can either create a purchase requisition directly in your ERP (SAP, Oracle, Microsoft Dynamics, and others) or generate a PO within OxMaint that is then exported to ERP for financial processing. The CMMS handles the maintenance workflow — which parts, which quantities, which vendor, which asset they serve. The ERP handles the financial transaction — approval routing, payment, and general ledger coding. Both systems do what they do best without requiring manual data re-entry between them.
OxMaint CMMS · Spare Parts Inventory with Reorder Automation and ABC Analysis
Stop Running Out of Critical Parts. Start Managing Inventory Like a Reliability Operation.
OxMaint connects every spare part to the assets it serves, automates reorder when stock falls below configured minimums, runs ABC analysis to prioritize your stocking budget, and tracks consumption per asset so you always know which components are driving your maintenance spend. The 23% of repair time your technicians spend waiting for parts — gone.