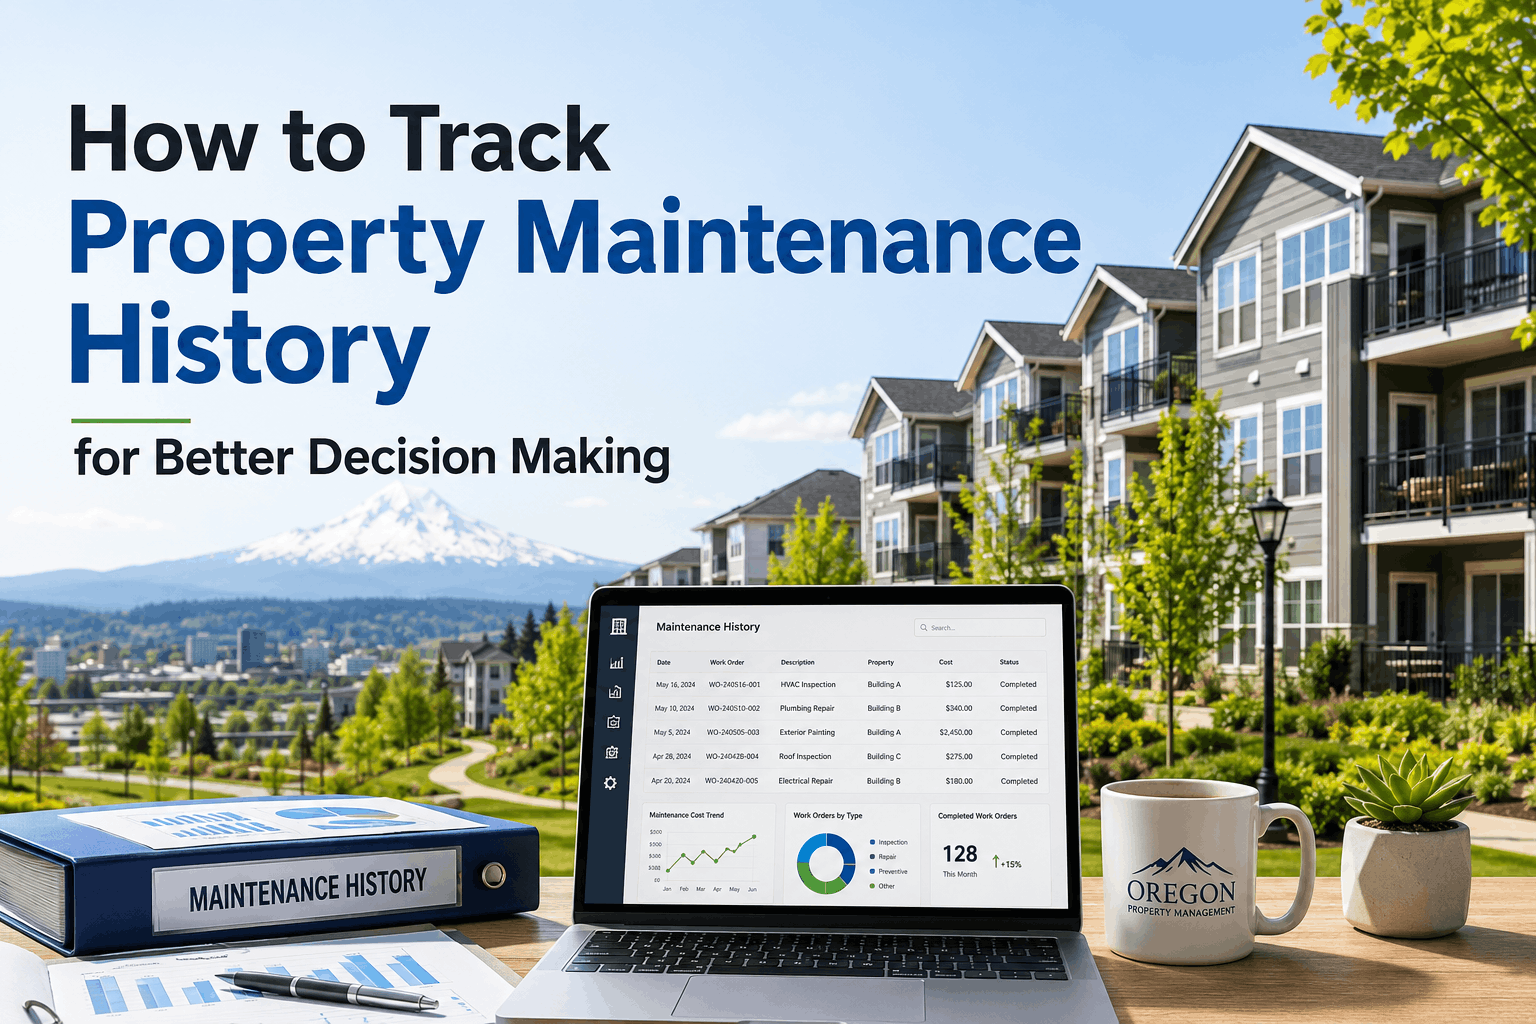
Property managers who do not track maintenance history are making budget decisions, capital planning choices, and vendor selections based on intuition — not data. A property's maintenance history is its single most valuable operational asset. It tells you which HVAC units are failing repeatedly (replace them, don't repair them), which vendors consistently finish on time and on budget (use them again), and which properties are consuming maintenance dollars faster than rent increases can cover (adjust your acquisition criteria). Yet most property managers treat maintenance history as an afterthought — paper logs that disappear, spreadsheets that no one updates, or CMMS data that no one analyzes. Sign Up Free to start tracking maintenance history automatically in Oxmaint. Book a Demo to see how portfolio managers use historical data to cut costs by 18–27 percent. This guide gives property managers a practical framework to capture, organize, and analyze maintenance history — work order history, asset repair frequency, cost trends, vendor performance, warranty tracking, and capital planning — so every decision is backed by data, not guesswork.
Why Maintenance History Is Your Most Valuable Operational Asset
Maintenance history is the complete record of every repair, inspection, part replacement, and vendor interaction for every asset in your portfolio. When maintained properly, it answers five critical questions that every property manager faces: Which assets should I replace vs repair? Which vendors deliver quality work on time? Which properties have hidden maintenance liabilities? When should I schedule capital replacements? And what is my true cost of ownership per asset? Property managers who analyze maintenance history make decisions that reduce costs by 18 to 27 percent and extend asset life by 3 to 5 years. Sign Up Free to start building your maintenance history database.
What Maintenance History Must Include: The 6 Critical Data Points
Incomplete maintenance history is almost as useless as no history at all. To support good decisions, every maintenance record must capture six critical data points. Without any one of these, the history is incomplete and decisions based on it may be flawed. Book a Demo to see how Oxmaint automatically captures all six data points on every work order.
Unique asset ID, manufacturer, model, serial number, installation date, and location. Without this, you cannot aggregate repair history by asset to identify failure patterns.
Work order number, creation date, completion date, priority, type (PM / corrective / emergency), and description of work performed.
Labor hours and rate, parts used with costs, contractor charges, and total cost. Essential for life cycle cost analysis and budget forecasting.
Who performed the work — internal technician name or external vendor name. Enables performance tracking and informed vendor selection.
Warranty status at time of repair, warranty claim filed (yes/no), claim amount recovered, and warranty expiration date. Prevents paying for covered repairs.
Photos before and after repair, inspection reports, test results, and signed completion forms. Provides evidence for warranty claims and insurance audits.
How to Use Maintenance History for Smarter Decisions
Maintenance history is only valuable if you use it to make better decisions. The six use cases below represent the highest-ROI applications of historical maintenance data. Property managers who implement all six report measurable improvements in cost control, capital planning, and vendor management. Sign Up Free to access Oxmaint's historical analysis tools.
- Pull repair history for each asset — count repairs in last 12 months, total repair cost, parts availability trends
- Rule of thumb: If repair costs in 12 months exceed 50% of replacement cost, replace the asset
- Example: Water heater replacement $1,200. Repair history shows $700 in repairs last year → replace, don't repair again
- Compare vendors on response time, first-time fix rate, cost vs estimate, and warranty call frequency
- Identify underperforming vendors (high cost, low quality, slow response) for replacement
- Negotiate better rates with high-performing vendors using performance data as leverage
- Analyze repair frequency trends to predict when assets will need replacement
- Use actual historical replacement costs (not estimates) for reserve calculations
- Present repair history to justify capital requests — ownership approves data-backed requests at 4x higher rate
- Cross-reference repair history with warranty expiration dates before approving work
- File warranty claims for components that failed within coverage period
- Track warranty claim success rate and recovery amount per asset class
- Use historical failure patterns to set meter-based PM triggers
- Example: Historical data shows water heater failures at 4,000 operating hours → set PM inspection at 3,500 hours
- Shift from reactive to predictive using your own asset history, not manufacturer averages
- Review maintenance history of acquisition targets to identify hidden deferred maintenance
- Calculate actual historical maintenance cost per unit — not seller's estimate
- Use repair frequency data to negotiate purchase price or reserve escrow
Maintenance History Analysis: Before vs After
The difference between a property manager who uses maintenance history and one who does not is visible across every decision outcome in the table below. Portfolio managers who analyze historical data consistently make better replacement decisions, choose better vendors, secure more capital budget, and achieve lower maintenance costs. Book a Demo to see how Oxmaint's historical analysis tools enable data-driven decisions.
| Decision Area | Without History (Gut Feeling) | With History (Data-Driven) | Improvement |
|---|---|---|---|
| Replace vs repair decision | Repair again ($500–2,000) → fails again in 6 months | Replace asset ($2,000–5,000) → lasts 8–12 years | −70% long-term cost |
| Vendor selection | Lowest bidder → poor quality, repeat calls | Best value based on history → first-time fix rate 85% | −40% repeat repair cost |
| Capital budget approval | Verbal request → denied or reduced | Data-backed with repair history → 4.2× approval rate | +320% approval rate |
| Warranty recovery | Pay full cost for covered repair → $1,500 lost | File warranty claim → $1,500 recovered | 100% recovery |
| PM schedule optimization | Manufacturer interval (conservative) → over-maintains | History-based interval (actual failure patterns) → right-sized PM | −20% PM labor cost |
| Acquisition due diligence | Miss deferred maintenance → $50,000 surprise | History reveals issues → negotiate $50,000 price reduction | $50,000 saved |
How to Build a Maintenance History Database from Scratch
If you do not have organized maintenance history today, start capturing it now. The four-phase process below builds a usable history database within 90 days. Sign Up Free to use Oxmaint's historical data capture tools that automate the entire process.
- From today forward, every work order must include all 6 critical data points
- Use mobile app with required fields — no incomplete entries allowed
- Train technicians on why history matters (show them the use cases above)
- Start with highest-value assets: HVAC, water heaters, elevators, roof
- Enter last 3–5 years of repair history from invoices, paper logs, memory
- Don't let perfection delay progress — partial history is better than none
- Monthly review of repair frequency by asset — identify assets with rising repair counts
- Quarterly vendor scorecard using historical performance data
- Annual asset health assessment for capital planning
- Automate history alerts: notify when asset repair count exceeds threshold
- Require history review before any capital request or major repair approval
- Include history summary in quarterly owner reports
From Reactive to Predictive: The Power of Historical Trend Analysis
The most advanced use of maintenance history is predictive — using past failure patterns to predict future failures before they occur. When you have 3–5 years of repair history for each asset class, you can identify the leading indicators that precede failure: rising repair frequency, increasing parts cost per repair, or declining MTBF (mean time between failures). Property managers who use historical trend analysis shift from reactive firefighting to predictive maintenance, reducing emergency repairs by 40–60 percent. Book a Demo to see how Oxmaint's trend analysis tools identify at-risk assets before they fail.