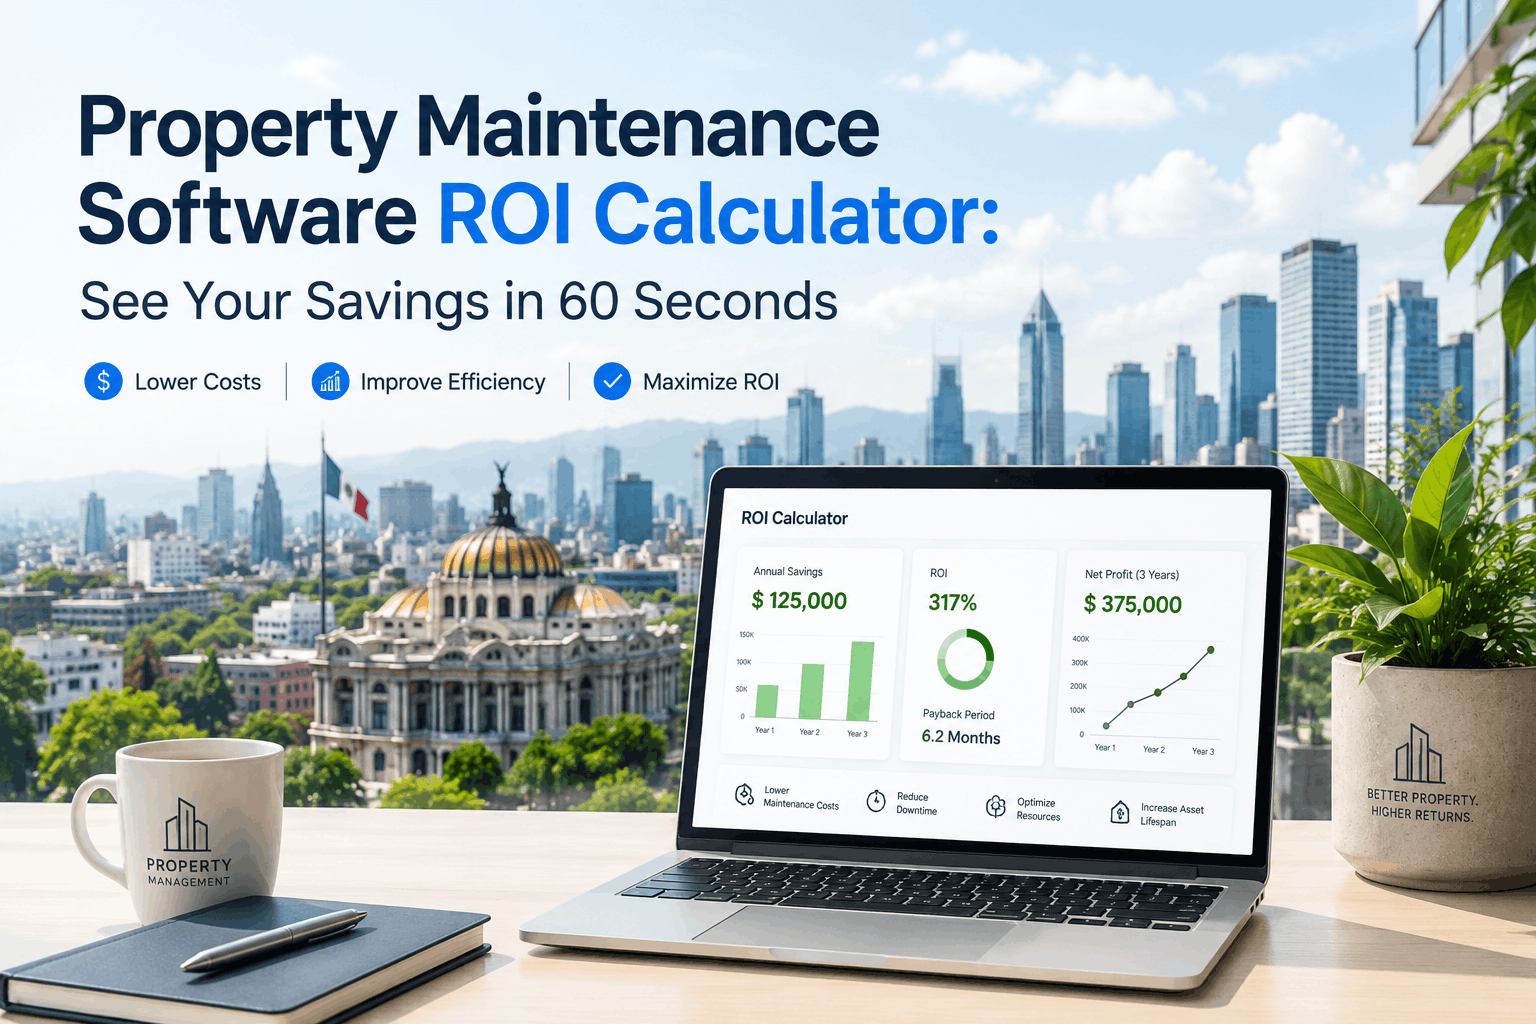
How much will maintenance software actually save you? Stop guessing. Enter your property data below and see exact savings — based on real USA property management benchmarks. Updated for 2026 cost data.
Property Maintenance Software ROI Calculator: See Your Savings in 60 Seconds
Enter your portfolio size, current annual maintenance spend, and emergency cost ratio. Instant ROI projection based on real property management data from 1,200+ USA properties.
How This Calculator Works
We analyzed maintenance spend data from 1,200+ property portfolios across the USA — from single buildings to 500-unit complexes. We identified eight specific cost drivers and benchmarked the savings each one produces when a CMMS is implemented correctly. Enter your data below, and we'll show you the specific savings you can expect.
What This Estimates:
- Emergency contractor cost reduction (typically 40–55% savings)
- Preventive maintenance savings (avoided equipment failures)
- Inventory optimization (8–12% parts cost reduction)
- Technician productivity gains (reduced idle time)
- Vendor cost benchmarking (3–8% negotiated savings)
- Tenant retention value (prevented lease loss)
What's NOT Included:
- One-time capital replacement (that's separate budgeting)
- Tenant rent increases from improved satisfaction (upside gain)
- Reduced liability from preventive maintenance (insurance benefit)
- Property value appreciation from better maintenance history (market gain)
ROI Scenarios: See Real Numbers
We've calculated exact ROI for six common property portfolio sizes, based on actual USA benchmarks. These are not best-case scenarios — they're median outcomes from 1,200+ properties. Scroll through to find your portfolio size.
Small multifamily or mixed-use building
Mid-sized multifamily or commercial office
Large multifamily or commercial campus
Large portfolio or multi-building complex
The Savings Breakdown: Where the ROI Actually Comes From
ROI isn't magic. It comes from eight specific operational improvements. Here's how much each contributes to your total savings across a typical 35-unit portfolio with $98,000 annual maintenance spend.
Emergency Contractor Cost Reduction
Today: $33,600/year. After CMMS: $15,900/year
Inventory & Parts Cost Optimization
Parts waste & expedited orders: 26% of current parts budget
Vendor Cost Benchmarking
Above-market vendor pricing discovered through CMMS analysis
Technician Productivity (Reduced Idle Time)
Manual dispatch, approval delays, unclear assignments eliminated
Preventive Maintenance Efficiencies
Planned PM vs. emergency repair cost differential
Reduced Tenant Turnover (Indirect)
Improved response time increases tenant satisfaction, reduces vacancy
Labor Efficiency (Dispatch Staff Reduction)
Manual dispatch, coordination tasks, work order entry automated
Warranty & Asset Tracking
Prevented warranty claims, extended equipment life through PM
Implementation Timeline & Cost Structure
ROI depends on implementation speed and depth. Here's the realistic timeline for reaching these savings numbers.
Risk Factors That Could Reduce Your ROI
These five issues can cut ROI in half if not addressed. We've listed what to watch for and how to prevent it.
Poor Technician Adoption
If technicians don't use the mobile app consistently, you lose productivity gains. Prevention: Invest 4–6 hours of training focused on their workflow, not system features.
No Preventive Maintenance Schedule
If PM doesn't get configured, you remain reactive. Prevention: Dedicate one week to defining PM frequency for your top 5 asset types based on failure history.
Incomplete Asset Inventory
If your CMMS doesn't know what equipment exists, PM scheduling and cost tracking fail. Prevention: Do a physical walk-through of each property and photograph all major assets during onboarding.
Lack of Vendor Cost Data
Without vendor history, you can't benchmark pricing or renegotiate. Prevention: Input last 12 months of vendor invoices into CMMS before launch; use this data for contract renegotiation in week 1.
Short Implementation Timeline
If you rush onboarding (< 2 weeks), data quality suffers and ROI is delayed. Prevention: Allow 4–6 weeks for full implementation; the slower 6-month payback beats the risk of doing it wrong in 2 weeks.
Frequently Asked Questions
Ready to Calculate Your Exact ROI?
OxMaint's ROI calculator shows real savings for your portfolio size and property type. Based on 1,200+ USA properties and 2026 cost data.





.png)