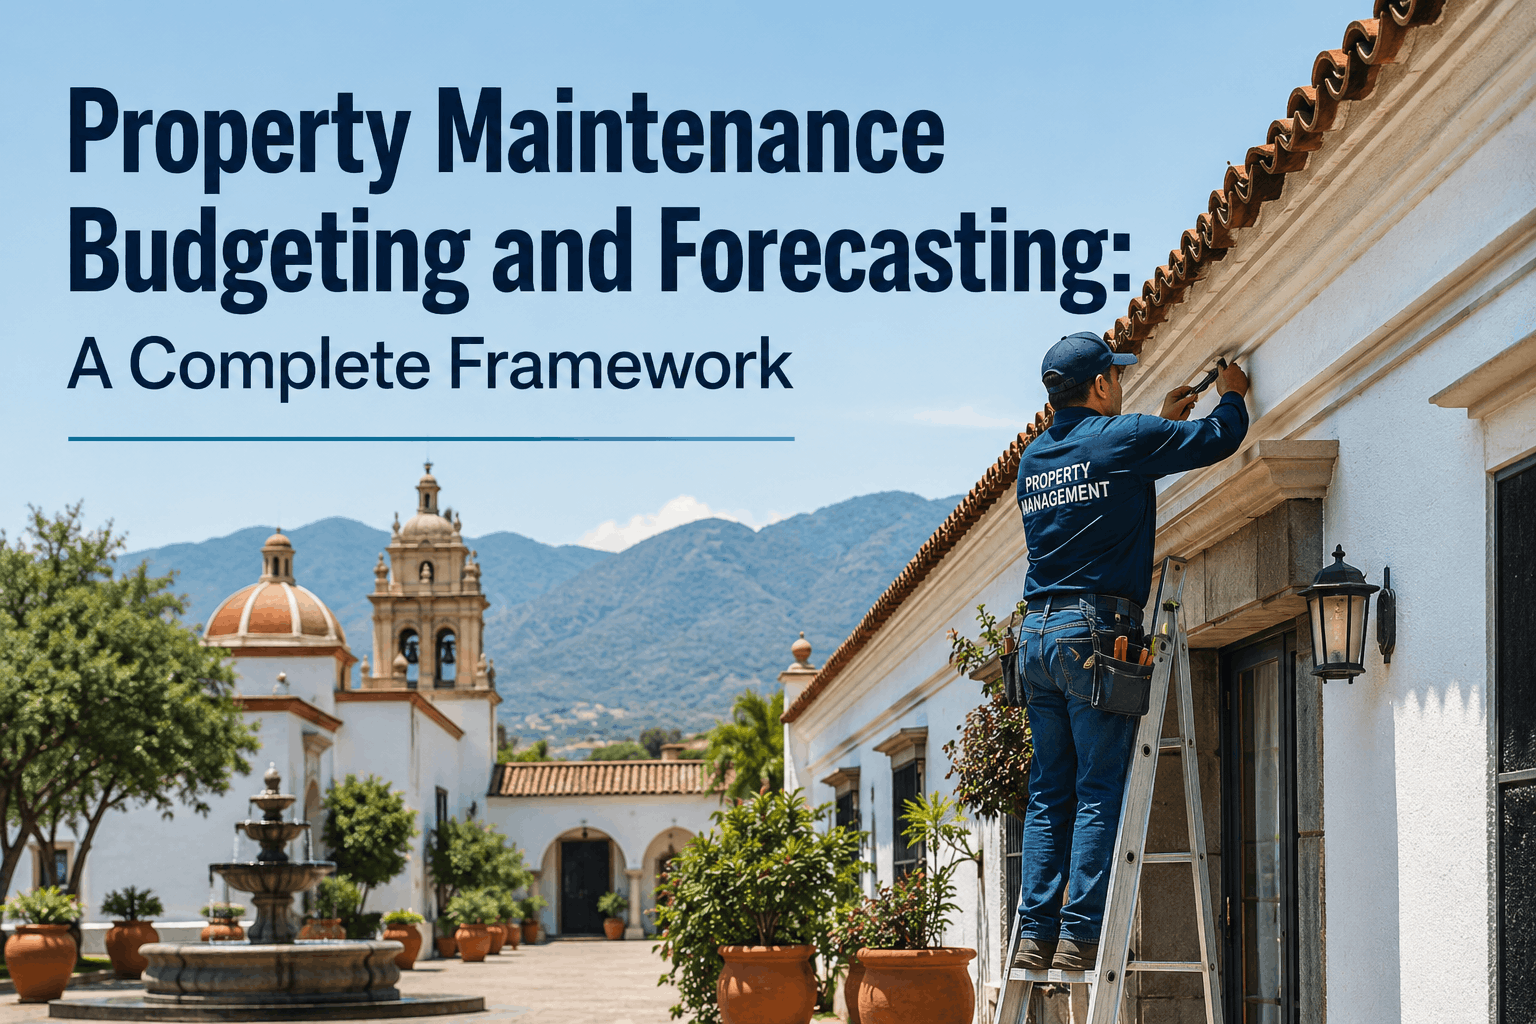
Property maintenance budgeting requires balancing three competing realities: historical spending patterns that often miss emerging asset degradation, forward-looking predictive models that require specialized training, and operational flexibility to handle unexpected failures. Most USA property management companies use hybrid budgeting frameworks combining zero-based activity analysis with historical trending and condition-based adjustments. Effective maintenance budgets allocate 8-12% of property value annually to preventive work, reserve 15-25% of annual maintenance spending for reactive repairs, and update forecasts quarterly based on actual asset condition trends. This guide provides step-by-step frameworks for annual budgeting, monthly forecasting, variance analysis, and capital planning used by property teams managing portfolios from 25 units to 500+ units. Learn to build defensible budgets that secure owner approval while maintaining flexibility for operational surprises. Start free — deploy integrated budgeting and forecasting today.
Property Maintenance Budgeting & Forecasting Framework: Build Accurate Annual & Monthly Budgets
Complete budgeting guide for property managers. Zero-based, activity-based, and historical budgeting methods explained. Capital vs operating budget allocation, reserve planning, variance tracking, and 12-month rolling forecasts for accuracy.
Three Budgeting Approaches — Zero-Based, Activity-Based, and Historical Trending
Property managers employ three primary budgeting methodologies, each with distinct advantages and limitations. Zero-based budgeting starts from $0 and justifies every expense from first principles: list every building system (HVAC, plumbing, electrical, roofing), research manufacturer PM recommendations, multiply by unit count and frequency, and add historical emergency costs. This method builds transparent, defensible budgets but requires significant time investment and detailed asset data. Activity-based budgeting focuses on maintenance activities (preventive inspections, seasonal tune-ups, annual certifications) and estimates labor/material costs per activity multiplied by frequency. This approach aligns tightly with operational execution but can miss cost drivers outside the activity framework. Historical budgeting projects prior-year spending forward with inflation adjustments and trend modifications, the fastest method but prone to perpetuating inefficiency and missing emerging issues. Best practice uses all three methods in parallel: zero-based analysis for new properties or after major capital work, activity-based for ongoing optimization, and historical comparison as a sanity check. The result is a nuanced budget that's defensible, executable, and flexible.
Capital vs. Operating Budgets — Separating Ongoing Maintenance from Asset Replacement
Effective property budgeting requires distinguishing between operating maintenance (ongoing upkeep extending asset life) and capital expenses (major replacements renewing assets). Operating maintenance includes preventive inspections, seasonal tune-ups, filter changes, minor repairs, and ongoing system monitoring — typically $1,500-$3,500 per unit annually depending on building age and complexity. Capital expenses include roof replacement ($15K-$45K per property), HVAC system replacement ($8K-$15K), parking lot resurfacing ($5K-$12K per acre), or interior system replacements. Most property owners expect property managers to stay within operating budgets (treated as ongoing expense reducing net income) while capital expenses require separate approval and may be funded through reserves, debt, or owner equity. The challenge: many items fall in a gray zone. Is repainting the entire common area interior ($8K) operating maintenance or capital improvement? Most accounting standards classify it as capital (expected to improve asset value beyond standard maintenance). However, compliance painting (lead remediation, hazmat abatement) stays operating because it's required safety work. Clear categorization prevents budget disputes and owner disputes. A property management CMMS should track both operating and capital work separately, with clear classification rules that align with property owner accounting practices.
| Maintenance Category | Operating Budget (Expensed) | Capital Budget (Capitalized) | Key Distinction |
|---|---|---|---|
| HVAC Systems | Annual filters, tune-ups ($400-600/yr) | System replacement ($8K-15K) | Operating maintains; capital replaces beyond expected life |
| Roof | Repairs, patching, gutter cleaning ($200-500/yr) | Roof replacement ($15K-45K) | Operating prevents leaks; capital replaces worn roof |
| Plumbing | Repairs, clearing, annual inspections ($300-700/yr) | Pipe replacement, reline ($5K-20K) | Operating fixes leaks; capital addresses degraded infrastructure |
| Flooring | Cleaning, waxing, minor repairs ($200-400/yr) | Replacement ($5K-15K per property) | Operating maintains appearance; capital replaces worn flooring |
| Painting | Touch-ups, maintenance (<$100/yr) | Full interior/exterior (<$15K if asset value increase) | Operating maintains; capital improves beyond standard condition |
| Electrical | Repairs, breaker resets ($200-400/yr) | Panel upgrade, rewiring ($8K-25K) | Operating fixes functionality; capital upgrades aging systems |
Building Your Annual Maintenance Budget — Step-by-Step Framework
Constructing a defensible annual maintenance budget follows a structured process that gathers data from multiple sources, applies industry benchmarks, and validates against historical trends. Step 1: Conduct a property asset inventory. Document every major system (HVAC, plumbing, electrical, roofing, structural, exterior, interior), its age, condition rating (1-5 scale), manufacturer specifications, and expected remaining life. Step 2: Research manufacturer PM recommendations. Major equipment manufacturers publish preventive maintenance schedules specifying inspection frequency, service intervals, and required procedures. HVAC units typically require annual tune-ups; roofs need inspections twice yearly; boilers require annual certification. Step 3: Calculate labor costs for each activity. Labor hours multiply by loaded hourly rates ($65-85 for property staff, $95-120 for skilled trades, $120-180 for specialized contractors). Material costs come from vendor quotes or historical data. Step 4: Determine activity frequency across your portfolio. Don't just budget annual tune-ups — segment by season (spring HVAC prep, fall gutter cleaning), by system criticality (essential systems get more frequent attention), and by building age (older properties need more frequent inspections). Step 5: Add reactive repair budgets. Historical data shows systems fail unexpectedly. Reserve 15-25% of your operating budget for emergency repairs, with reserves scaled to portfolio age and complexity. Step 6: Build capital replacement schedules. For major assets nearing end-of-life (roofs, HVAC, boilers), forecast replacement dates and budget accordingly. Step 7: Validate against benchmarks. USA property management industry standards suggest 8-12% of property value annually for maintenance across the full portfolio. If your budget is significantly above or below this range, investigate why before presenting to ownership.
| Budget Category | Cost Per Unit | Total Annual Cost | % of Total Budget | Notes |
|---|---|---|---|---|
| Preventive HVAC Maintenance | $380 | $19,000 | 16.2% | Fall/spring tune-ups, filter changes, inspections |
| Plumbing Preventive & Repairs | $220 | $11,000 | 9.4% | Annual inspections, small repairs, clearing |
| Roof Maintenance | $140 | $7,000 | 6.0% | Inspections, patching, gutter cleaning |
| Electrical Systems | $120 | $6,000 | 5.1% | Testing, repairs, panel maintenance |
| Exterior Maintenance | $180 | $9,000 | 7.7% | Parking lot sweeping, landscaping, pressure washing |
| Common Area Interior | $150 | $7,500 | 6.4% | Cleaning, minor repairs, decorative maintenance |
| Safety & Compliance | $110 | $5,500 | 4.7% | Fire system testing, inspections, certifications |
| Subtotal: Preventive Maintenance | $1,300 | $65,000 | 55.5% | All scheduled, planned work |
| Emergency Repair Reserve (20%) | $260 | $13,000 | 11.1% | Unplanned failures, urgent repairs |
| Vendor Management Overhead | $85 | $4,250 | 3.6% | Bidding, contractor coordination, insurance verification |
| CMMS Software & Tools | $65 | $3,250 | 2.8% | Maintenance management system, tracking software |
| Total Operating Maintenance Budget | $1,710 | $85,500 | 73.0% | Annual operating expense |
| Capital Reserve (HVAC replacement in year 3) | $520 | $26,000 | 22.2% | Roof (year 6), HVAC (year 3), boiler (year 4) |
| Total Annual Budget | $2,230 | $111,500 | 100% | Operating + capital allocations |
Monthly Forecasting & Variance Analysis — Tracking Actual vs. Budget
An excellent annual budget becomes ineffective without monthly tracking and real-time variance analysis. Property managers should track all maintenance spending monthly against budget, analyzing why actual differs from forecast and adjusting predictions accordingly. Healthy monthly variance runs 2-5% across the year; variances exceeding 10% suggest either budget errors or operational changes requiring investigation. A roofing repair not scheduled until August that occurs in May should trigger reforecasting of remaining monthly budgets — if you've already spent half the annual roofing budget by August, you need to adjust spending or reserves. Most CMMS systems allow you to tag each work order with cost category and budget period, automatically calculating variances. Variance analysis should distinguish controllable vs. uncontrollable variances. Uncontrollable variances reflect actual inflation in material costs, emergency events that couldn't be prevented, or unusual weather damage. Controllable variances reflect process improvements (achieving repairs at lower cost through better negotiation), efficiency gains (reduced emergency frequency), or scoping changes (deciding to repair vs. replace an HVAC component). Tracking this distinction helps property managers communicate confidently to ownership about where budget is being used and why.
Frequently Asked Questions — Property Maintenance Budgeting & Forecasting
Before implementing Oxmaint, our budgeting process was essentially throwing darts. We'd look at last year's spending, add 5% inflation, and call it a budget. Then every month would surprise us with unexpected repairs that blew through our contingency reserve. We'd end the year 18-22% over budget and have to explain overages to ownership. Implementing Oxmaint's budgeting framework changed everything. We started tracking each maintenance activity, researching manufacturer PM requirements, and building our budget from the ground up instead of backward from last year. We segmented emergency repairs into a separate 18% reserve and implemented quarterly variance reviews. Year one, we were only 6% over budget — mostly due to weather damage that was genuinely unpredictable. Year two, we hit our budget within 2.3% variance. Ownership stopped questioning our maintenance spend because we could now articulate exactly why each dollar was being spent. More importantly, we shifted from reactive emergency budgeting to strategic planning. We can now forecast capital expenses 4-5 years out, giving ownership time to plan for major replacements instead of emergency scrambles.
Build Your Accurate Maintenance Budget — CMMS-Integrated Financial Planning
Zero-based, activity-based, and historical budgeting frameworks. Capital vs. operating budget allocation. Monthly variance tracking and quarterly reforecasting for budget accuracy.

-template-library.png)
-request-template-for-building-owners.png)

