.png)
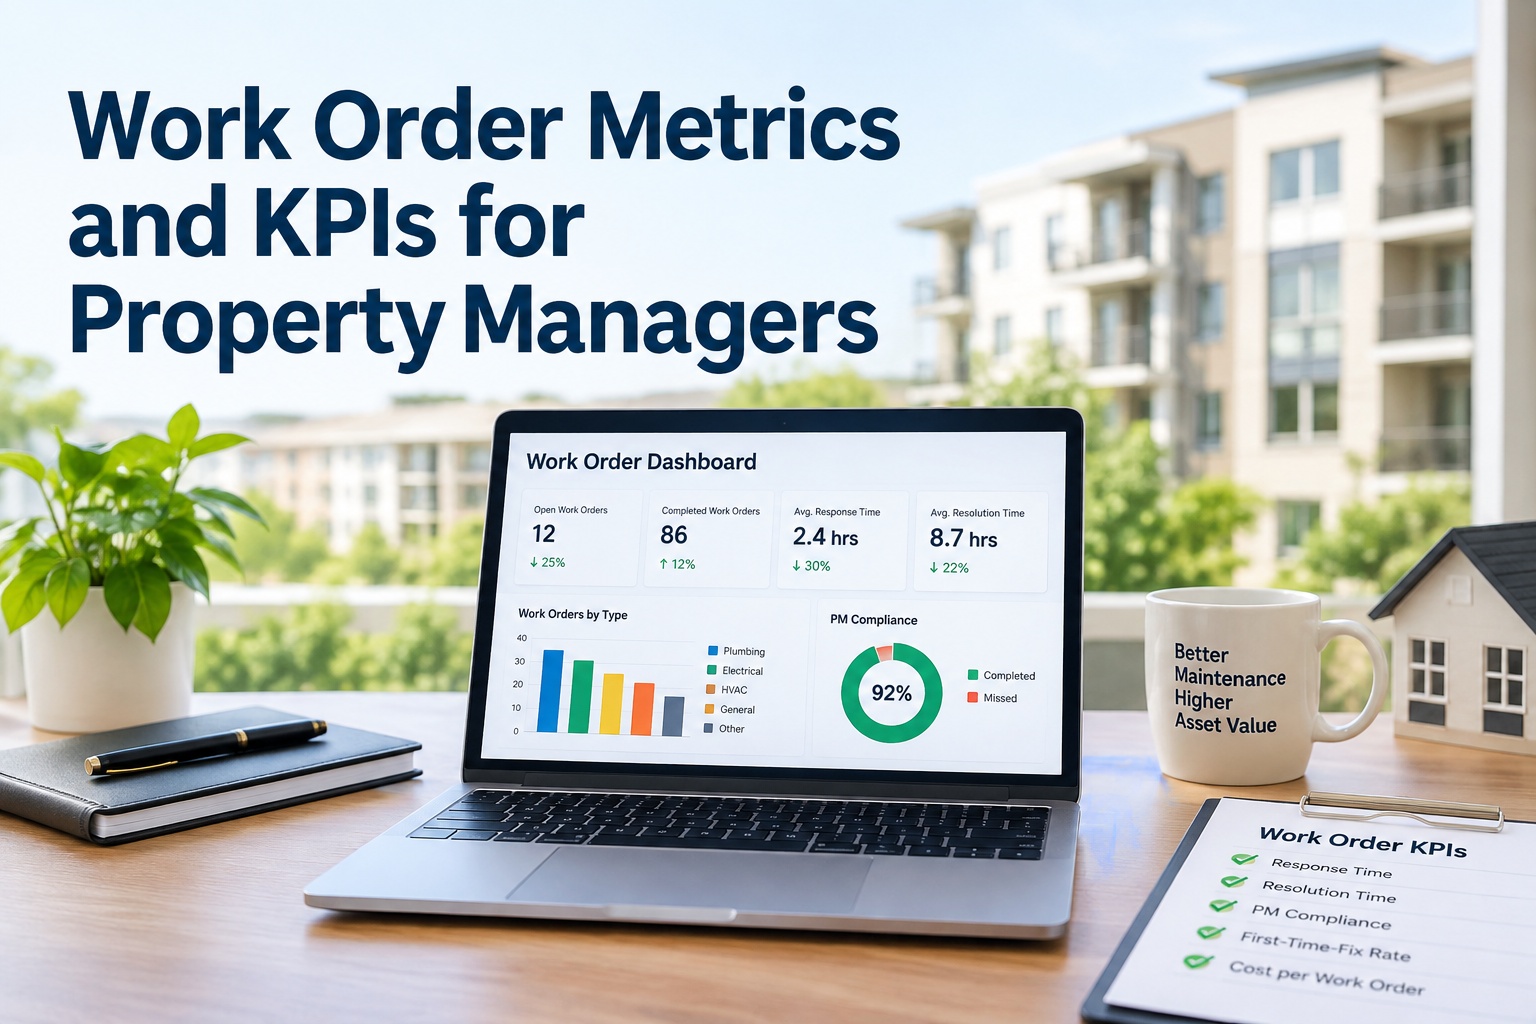
Property maintenance metrics are the quantifiable indicators that separate thriving real estate portfolios from struggling ones. Most property managers operate in the dark — measuring only what's easy to see rather than what actually drives profitability. A property running $0.72 per square foot in maintenance costs while top-quartile properties operate at $0.44 per square foot isn't understaffed — it's unmeasured. Without tracking the right KPIs, every maintenance decision looks reasonable because there is no reference point for what acceptable actually means. Property maintenance KPIs close this gap: they take your operational data, compare it against industry standards, and reveal exactly which maintenance categories are eroding your bottom line. This guide covers the seven critical property maintenance metrics, how to track them in a CMMS dashboard, and how Oxmaint's maintenance analytics platform monitors your property metrics against live industry benchmarks every reporting period — without requiring a consultant.
Oxmaint's property software tracks all seven maintenance metrics in real-time, comparing your KPIs against industry standards. Know whether your property is genuinely efficient or just better than last year.
Property maintenance metrics are KPIs that measure efficiency across seven categories: financial performance (maintenance cost per unit, cost per square foot, maintenance budget variance, emergency spend percentage), maintenance quality (preventive compliance rate, first-time fix rate, mean time to repair), asset utilization and downtime (emergency ratio, asset uptime percentage, work order aging), efficiency and response (work order response time, vendor response time, mean time between failures), compliance tracking (inspection pass rate, safety compliance score, permit currency), tenant and operational satisfaction (tenant satisfaction score, work order completion rate, backlog trend), and strategic planning (deferred maintenance ratio, capital planning variance, lifecycle replacement status). Oxmaint's CMMS dashboard tracks all seven categories in real-time with automated alerts when metrics drift below industry standards.
The Seven Critical Property Maintenance Metrics — And What Each Reveals About Profitability
Each property maintenance metric answers a different question about operational efficiency — and reveals a different cost improvement opportunity when your property falls below industry benchmarks. Understanding these maintenance KPIs allows property managers to transition from reactive firefighting to proactive strategic planning.
The most revealing financial KPI for property maintenance is the cost per square foot, compared against properties of identical size, age, and occupancy class in your geography. Industry benchmark for class-B commercial properties: $0.44–$0.58 per square foot annually. Properties exceeding $0.72 per square foot are typically bleeding capital through uncontrolled emergency repairs. Oxmaint's property management software breaks down this metric by building system — HVAC maintenance cost, plumbing preventive maintenance spend, electrical systems, roof inspection costs — so you see exactly where your property exceeds benchmarks and by how much in dollar terms.
The percentage of scheduled preventive maintenance tasks completed on schedule is the leading indicator for all other KPIs. Industry top-quartile properties maintain 89%+ PM compliance; properties below 65% typically experience 3.2× higher emergency maintenance costs and 2.8× more tenant complaints. When your property implements preventive maintenance scheduling — HVAC filter changes, roof inspections, elevator maintenance schedules, plumbing preventive work — and tracks compliance in a CMMS dashboard, the compounding cost reduction appears within 90 days. Properties that achieve 92%+ preventive compliance rates reduce total maintenance costs by 34–41% within 18 months compared to reactive-only operations.
How quickly a maintenance request becomes a dispatched work order directly impacts tenant satisfaction and liability exposure. Industry standard for emergency maintenance response: under 2 hours. Routine maintenance response: under 24 hours. Planned maintenance: scheduled with 7+ days notice. Vendor response time — how long external contractors take to arrive and complete work — is equally critical. Properties that track work order response time in their CMMS and maintain vendor response SLAs see 18–24% reductions in tenant turnover and liability claims. When a property's work order response time exceeds 6 hours for emergencies, tenant satisfaction scores drop by an average of 23 points on standard 100-point scales, directly impacting retention and lease renewal rates.
The emergency ratio — the percentage of total maintenance work that is unplanned emergency repairs versus scheduled preventive work — is the diagnostic for your entire maintenance strategy. Industry benchmark: top-quartile properties operate with 12–18% emergency ratio and 82–88% preventive ratio. Properties above 45% emergency ratio are in reactive mode, responding to failures rather than preventing them. Every dollar spent on preventive maintenance scheduling saves $4–6 in emergency repair costs, overtime labor, and tenant disruption. When you track emergency maintenance as a percentage of total work orders in your property maintenance software, you get the North Star metric for whether your preventive maintenance program is working. Oxmaint's maintenance analytics automatically calculate this ratio from your work order data, flagging when emergency work creeps above industry standards for your property class.
The mean time to repair is the average duration from work order creation to completion. Industry benchmark: 4–6 hours for emergency repairs, 8–16 hours for routine work orders, 3–5 days for planned projects. Properties exceeding 12 hours average MTTR for emergency work are experiencing repeat visits, poor diagnostics, or technician coordination failures. First-time fix rate — the percentage of maintenance requests resolved without a return visit — is equally critical. Top-quartile properties maintain 88%+ first-time fix rates; properties below 72% are spending 2.4× more on labor because technicians make multiple trips. When your property management software tracks MTTR by technician, building system, and work order type, you identify exactly where efficiency breaks down and can implement targeted training or process improvements.
Tenant satisfaction with maintenance operations — measured through surveys, response time tracking, and work order quality ratings — is a leading indicator for lease renewal and rent escalation success. Properties maintaining tenant satisfaction scores above 82/100 achieve 12–18% higher lease renewal rates compared to properties below 70/100. Work order completion rate on the first completion date (not rework) drives tenant confidence in property management responsiveness. When a tenant files a maintenance request and it's resolved within the promised timeframe without requiring a follow-up visit, satisfaction compounds. Most property management software packages can automate tenant satisfaction surveys sent immediately after work order closure, creating a continuous feedback loop that connects specific maintenance metrics to revenue outcomes.
Budget variance — the difference between budgeted maintenance spend and actual spend — is typically where property managers discover inefficiencies. Properties maintaining ±5% budget variance have mature maintenance planning; properties exceeding ±15% variance are either under-budgeting for actual needs or over-spending due to inefficient processes. The deferred maintenance ratio — the percentage of identified maintenance needs pushed into future periods due to budget constraints — reveals the long-term liability risk. When more than 22% of identified maintenance work gets deferred, you're building future cost spikes and tenant satisfaction issues. Oxmaint's property maintenance software tracks budget variance by category, season, and building system, allowing you to identify whether variances come from emergency work (uncontrollable), inefficient processes (controllable), or seasonal patterns (predictable).
Know Your Metrics. Optimize Your Costs. Reach Top-Quartile Efficiency in 12 Months.
Seven property maintenance metrics, real-time CMMS dashboard tracking, industry benchmark comparisons — automatically calculated in Oxmaint every reporting period. Transform reactive maintenance into data-driven strategy. See exactly where your property stands against peers in your market, identify the highest-ROI improvement opportunities, and implement targeted changes backed by performance data.
Industry Property Maintenance KPI Benchmarks — Top Quartile vs Industry Average
These benchmarks are derived from IREM (Institute of Real Estate Management), BOMA (Building Owners and Managers Association), and Oxmaint's anonymized property data pool across 2,400+ commercial properties. They represent achievable targets for commercial properties of 50 to 500 units in the United States.
| KPI Metric | Bottom Quartile | Industry Average | Top Quartile | Oxmaint Avg |
|---|---|---|---|---|
| Maintenance cost per sq ft (annual) | $0.72–$0.94 | $0.54–$0.68 | $0.32–$0.48 | $0.41 |
| PM compliance rate | <62% | 68–76% | ≥89% | 92% |
| Emergency maintenance ratio | >42% | 24–34% | <16% | 14% |
| Work order response time (hrs) | >8 | 4–6 | <2 | 1.2 |
| First-time fix rate | <68% | 72–82% | ≥88% | 91% |
| Mean time to repair (hours) | >14 | 8–12 | <4 | 3.4 |
| Tenant satisfaction score | <68 | 72–78 | ≥84 | 87 |
| Budget variance % | >18% | 8–14% | <6% | 5.2% |
Property Maintenance Software Dashboard: Tracking KPIs in Real-Time
A property maintenance software platform (CMMS) must make these seven KPIs visible in a single unified dashboard, updated continuously, with alerts when metrics drift. Without real-time visibility, property managers operate with outdated information. Oxmaint's maintenance analytics dashboard surfaces all seven KPI categories automatically — segmented by building, system, technician, and time period — enabling property managers to detect inefficiencies within days rather than discovering them at quarterly review.
Displays maintenance cost per square foot, cost per unit, budget variance, and spending trends. Compare your property's cost performance against industry benchmarks updated quarterly. Identify which building systems (HVAC, plumbing, electrical, roof) are driving cost overruns.
Auto-generates preventive maintenance schedules based on equipment manufacturer specifications. Tracks completion percentage, flags overdue tasks, and identifies compliance gaps by technician or building system. Compliance trends predict cost trajectory 60–90 days in advance.
Measures time-to-dispatch and mean-time-to-repair for every work order automatically. Sets response SLAs by priority level and tracks whether technicians meet them. Identifies bottlenecks — whether delays occur in dispatch, technician availability, or parts procurement — with individual accountability.
Automatically calculates the percentage of work orders that are emergency (unplanned) versus preventive (scheduled). Trends this ratio monthly and annually to show whether reactive maintenance is increasing or decreasing. Flags when ratio exceeds industry benchmarks for your property class.
Integrates post-completion satisfaction surveys sent automatically after work order closure. Tracks first-time fix rates by technician and system type. Correlates tenant satisfaction scores with maintenance response time and quality metrics to show ROI on maintenance investments.
Property Manager Success Stories — Results From Implementing KPI Tracking
We thought we were managing maintenance well — our budget was predictable and we weren't over-spending. Then Oxmaint showed us that every competitive property in our market was achieving 28% lower costs per square foot. We were measuring against ourselves, not against our actual peers. In 18 months of tracking the right metrics, we've aligned with top-quartile properties in our sector. The software pays for itself three times over in maintenance cost reduction alone.
How to Prioritize Property Maintenance Metrics Improvement
Seven KPI categories can feel overwhelming. Use this prioritization framework to identify which metrics to improve first, ensuring your efforts compound into maximum financial impact.
Preventive maintenance compliance rate and emergency maintenance ratio are your highest-ROI metrics. Improving PM compliance from 62% to 89% typically reduces total maintenance costs by 34–41% within 18 months. These metrics respond quickly to process changes and scheduling discipline — implement first.
Work order response time and first-time fix rate directly impact tenant satisfaction and lease renewal rates. Improving response time from 6 hours to 2 hours and first-time fix from 71% to 88% compounds tenant satisfaction and reduces reputation risk.
Budget variance and deferred maintenance tracking enable accurate capital planning. Reducing variance from ±16% to ±5% creates predictability and prevents cost surprises. These metrics require disciplined process maturity but unlock strategic planning confidence.
Once a metric reaches top-quartile performance, maintain it with existing processes. Monitor quarterly for drift. Use strong-performing metrics as internal proof points for budget justification and team performance recognition.
Frequently Asked Questions — Property Maintenance KPIs and CMMS Dashboards
Track All Seven Metrics. Benchmark Against Your Market. Optimize Your Bottom Line.
Property maintenance metrics, real-time CMMS dashboard, industry comparison, automated alerts — built into Oxmaint every reporting period. Transform your property's maintenance from cost center to strategic advantage. Start tracking the metrics that drive profitability today.