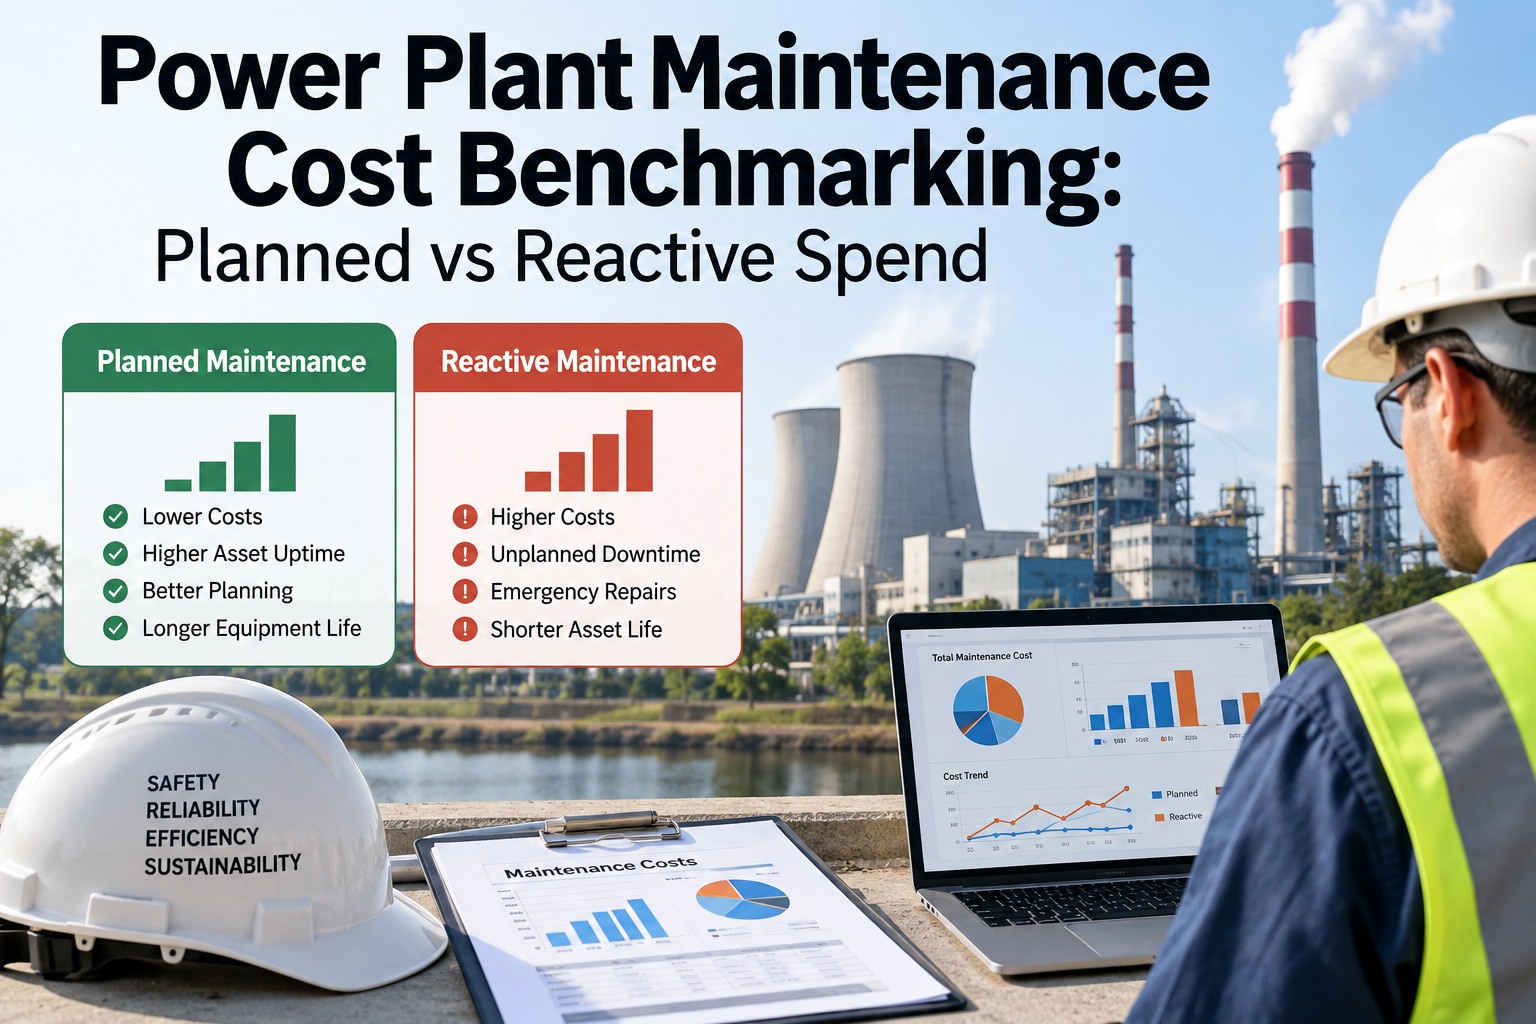
Most power plants can tell you their total maintenance budget down to the dollar. Far fewer can tell you what fraction of that budget went to work that was planned weeks in advance versus work that happened because something already failed. That single split — planned versus reactive spend — is one of the most diagnostic numbers in maintenance management, because reactive work doesn't just cost more per job, it compounds: rush parts, overtime labor, secondary damage, and the deferred maintenance it displaces while everyone's fighting the fire in front of them. This guide covers how to benchmark that ratio properly, where the reactive cost premium actually comes from, and how a CMMS turns work-order data into a number leadership can act on.
Power Plant Maintenance · Cost Benchmarking · Planned vs. Reactive · 2026
Find Out Where Your Maintenance Budget Is Actually Going
If nobody's classifying work orders as planned or reactive at the point of creation, the benchmark doesn't exist — it's a guess. OXMAINT AI tags cost, labor and parts to every work order automatically by type, so your planned-vs-reactive ratio, your cost-leakage sources, and your deferred maintenance backlog show up on a live dashboard instead of a quarterly spreadsheet exercise.
3–5×
widely cited cost multiple of reactive repair vs. the same job planned
>70%
commonly cited planned-spend target for a mature reliability program
2–5%
typical maintenance cost as a share of estimated replacement value (ERV)
1 metric
the planned/reactive ratio — the single most diagnostic number in the budget
Where the Reactive Premium Actually Comes From
"Reactive costs more" is easy to say and hard to act on without knowing which part of the premium is hitting your plant hardest. It's rarely just one thing — it's four separate cost drivers stacking on top of each other. Start free and start tagging these on every work order.
🔧
Parts Premium
Emergency sourcing, expedited shipping and premium distributors cost more than standard procurement lead times.
⏱️
Labor Premium
Overtime rates and contractor call-outs replace regular-shift labor that a planned job would have used instead.
⚡
Production Loss
An unplanned outage costs generation output a scheduled maintenance window during low-demand hours does not.
🧩
Secondary Damage
A failure caught late often takes an adjacent component with it — damage a planned repair would have prevented entirely.
Where Your Plant Sits on the Spectrum
The planned/reactive ratio isn't just a cost metric — it predicts where the ratio is headed next. A plant sliding toward reactive-heavy tends to keep sliding, because firefighting crowds out the planning time that would reverse it. Book a demo to see exactly where your ratio lands today.
Reactive-Heavy
<50% planned
Firefighting mode — emergency costs compound, backlog grows, budget overruns become routine.
Balanced
50–70% planned
Moderate program — planned work is the majority, but reactive spend still eats meaningfully into budget.
Proactive
>70% planned
Mature reliability program — reactive work is the exception, and cost per job trends down year over year.
The Benchmarking Metrics That Actually Matter
A useful benchmark set is short and specific — enough to diagnose the problem, not so much that nobody reviews it. Sign up free and get these calculated automatically from your work orders.
Deferred Maintenance: The Cost Reactive Work Hides
Every hour spent on an unplanned repair is an hour not spent on a scheduled PM that then slips to next week — and next week's PM slips again if another emergency lands first. That's how a deferred maintenance backlog forms quietly: not one bad decision, but reactive work continuously displacing planned work until the backlog itself starts generating the next emergency. Tracking backlog value alongside the planned/reactive ratio shows whether the plant is catching up or falling further behind. Book a demo to see your backlog trend calculated automatically.
Every Work Order Tagged. One Ratio, Trended Over Time.
OXMAINT AI classifies every work order as planned, preventive or reactive at creation, tracks the labor and parts cost against each, and rolls it into a live planned-vs-reactive ratio — so a slipping trend shows up on the dashboard, not in next quarter's budget review.
Run This Audit Before You Trust Your Ratio
A benchmark is only as good as the data behind it. Check these before drawing conclusions from your current planned/reactive split. Start free and run this audit against your own work order history.
✓
Every work order is classified at creation — planned, preventive or reactive — not reconstructed after the fact.
✓
Labor and parts cost are actually captured per work order, not estimated at month-end.
✓
Overtime and contractor premiums are tagged separately, so the reactive cost premium is visible, not buried.
✓
Deferred backlog is tracked as a running total, not just the current month's open work orders.
✓
Asset replacement values are current in the register, so cost-as-%-of-ERV is meaningful.
✓
Ratio is reviewed on a trend, month over month — a single snapshot hides whether things are improving or not.
Frequently Asked Questions
Why does reactive maintenance cost more than planned maintenance for the same repair?
Reactive work typically involves emergency parts sourcing at premium prices, overtime or contractor labor, unplanned production loss, and a higher chance of secondary damage from a fault that progressed further before it was addressed — all costs a scheduled repair avoids.
What's a realistic planned-vs-reactive target for a power plant?
Industry benchmarks commonly cite over 70% planned spend as the target for a mature reliability program, with plants below 50% planned generally considered to be in chronic firefighting mode. The right target for a specific plant depends on asset age, criticality and current baseline.
How is deferred maintenance different from reactive maintenance?
Reactive maintenance is work performed after something has already failed. Deferred maintenance is work that was identified and approved but pushed back — often because reactive work took priority. A growing deferred backlog is frequently a leading indicator that reactive spend is about to increase.
Can OXMAINT AI calculate our planned-vs-reactive ratio automatically?
Yes — work order type classification, labor cost, and parts cost are captured as part of the normal work order workflow, so the ratio and its trend are available on a live dashboard rather than requiring a manual quarterly reconciliation.
Where should we start if our ratio is worse than we'd like?
Start by identifying which asset classes generate the most reactive work orders and the highest cost premium per job — that's usually a small number of assets driving a disproportionate share of the reactive spend, and the best place to start shifting toward condition-based or scheduled preventive work.
Know Your Ratio Before It Shows Up in the Budget Review.
Tag every work order by type, track cost leakage as it happens, and watch your planned-vs-reactive ratio trend — instead of discovering it in a quarterly report.