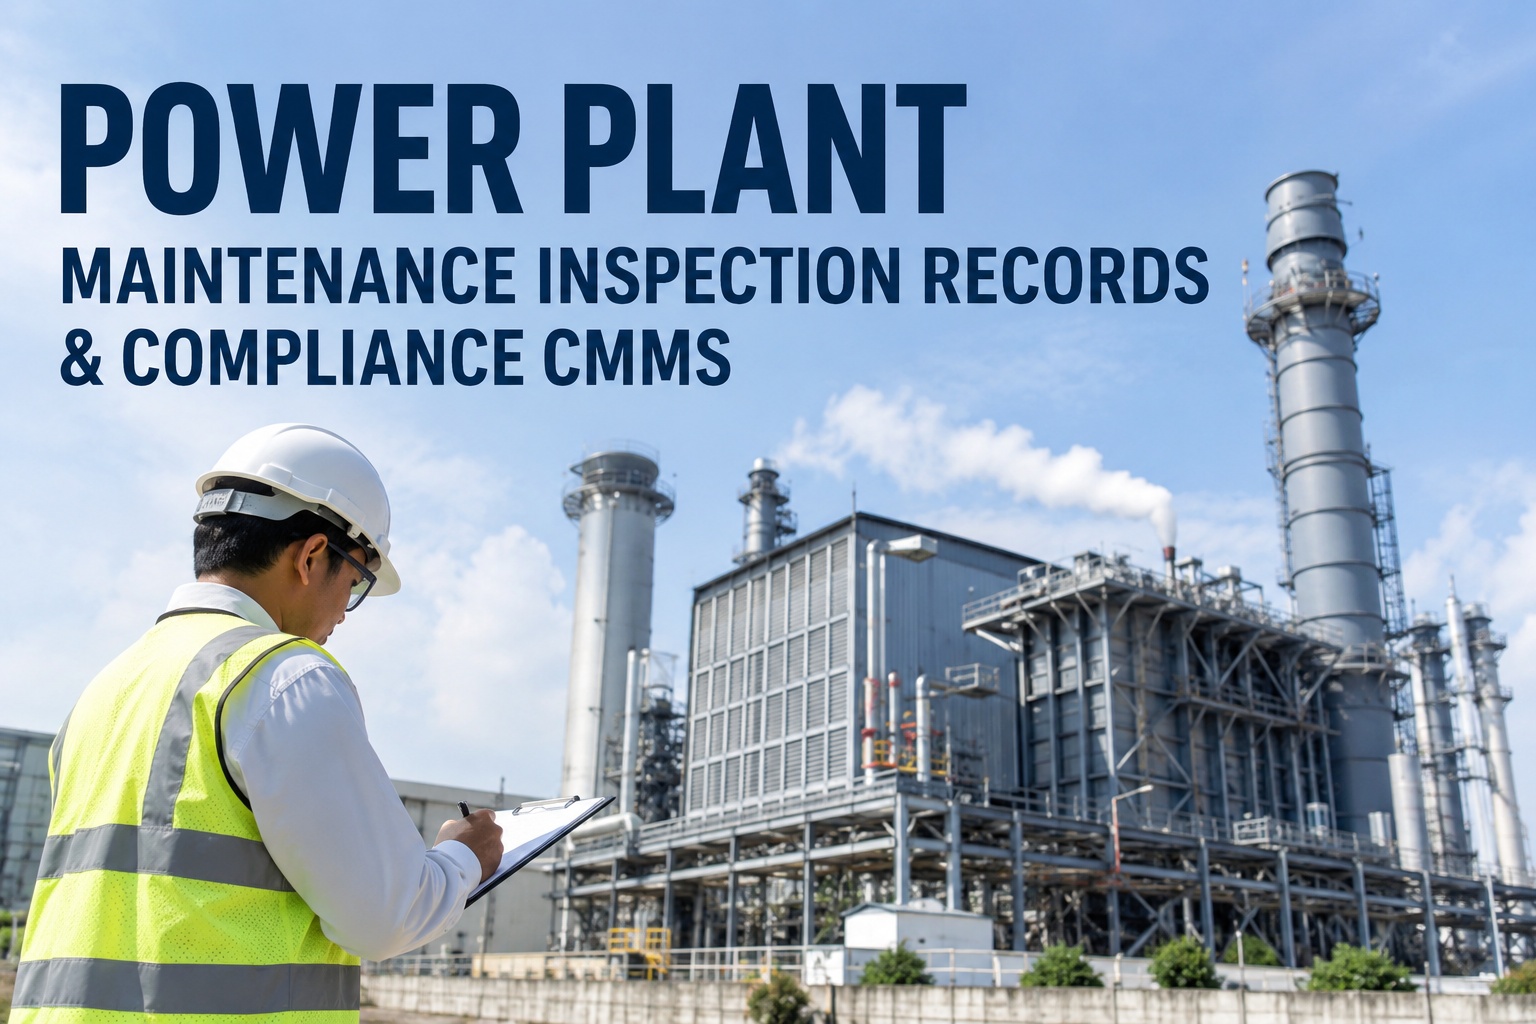
PM compliance is the single most predictive leading indicator of unplanned outage risk in a power plant, and 54% is the kind of number that keeps plant managers awake. World-class operations run at 90% or higher, critical-asset programs at 95%, and anything below 80% signals that reactive work has quietly taken over the maintenance function. The 410 MW combined-cycle plant in this case study sat at 54% for three years before a six-month mobile-first rollout, rugged tablets, offline-mode workflow, and asset-linked checklists pushed compliance to 95%. The trigger was simple. Paper work packs and a desktop-only CMMS were producing a 46-point execution gap. Mobile closed it, and you can start a free trial to see the same workflow.
Month 0
54%
PM compliance baseline
Month 6
95%
PM compliance at go-live close
Net gain
+41pts
Schedule attainment improvement
The starting line
Why 54% compliance is a structural failure, not a staffing one
When plant leadership first benchmarked their PM compliance, the instinct was the usual one, hire more technicians, add overtime, push harder. None of that would have worked because the problem was not effort. The maintenance team was completing roughly 720 hours of work each week. The problem was that almost half of every PM cycle never made it from "scheduled" to "executed" in time because of three structural barriers that had nothing to do with technician motivation.
42 min
Lost per shift walking back to a control room terminal to log work
11 days
Average gap between PM completion and work order close-out in CMMS
23%
Of paper work packs returned incomplete or unreadable on audit review
61%
Of dead-zone PMs deferred because techs could not access asset data
Where compliance was hemorrhaging
Compliance gap analysis by asset family
Aggregate compliance numbers hide where the actual risk sits. A 60-day audit broke the 54% baseline down by asset family and revealed an uncomfortable truth, the highest-criticality assets were also the ones with the worst PM execution. Switchgear inside concrete vaults, basement-level fire pumps, and turbine deck inspections all scored below 50% because they were in connectivity dead zones where a paper-only workflow guaranteed delay.
Switchgear and MV cabinets
Vault locations, zero signal, monthly PM frequency
HRSG and boiler tubes
Elevated catwalks, paper checklists, photo gaps
Fire pumps and emergency systems
Basement zones, weekly PM, audit-critical
Cooling tower and water systems
Outdoor exposure, daily logs, Legionella tracking
Lubrication and rotating equipment
Connected areas but heavy reactive interruption
Instrumentation and control
Indoor, accessible, but data entry bottleneck
The intervention
Four mobile-first changes that closed the 41-point gap
The rollout had four discrete pieces, each addressing one of the structural barriers identified in the baseline audit. The plant did not try to redesign its PM schedule, change technician headcount, or rebuild its asset register. The PM program was already good on paper. What changed was the execution layer, moving from desktop and paper to rugged tablets running an offline-capable mobile workflow.
Rugged tablets issued plant-wide
Every field technician received a ruggedized 10-inch tablet rated IP68 and MIL-STD-810G. Battery life rated for full 12-hour shifts. High-brightness screens readable in direct sunlight at turbine decks. Vehicle charging mounts in every maintenance truck. Hardware was deliberately standardized to remove device variation as an excuse.
Genuine offline mode with pre-loaded shifts
At shift start in the maintenance bay, OxMaint pre-loads every assigned work order, asset record, SOP, and checklist onto the device. Vault and basement work continues exactly as if connectivity existed. Field timestamps are preserved at the moment of action, not at the moment of sync, which preserved audit-trail integrity for compliance reviews.
QR-coded assets and one-tap workflow
Every tracked asset received a QR tag at the access point. Technicians scan to load the full asset history, current open work orders, and the relevant PM checklist in under two seconds. No typing. No navigation. The PM completion form was redesigned to require three taps maximum from open to close, which collapsed average per-PM execution time by 38%.
Real-time supervisor dashboard
Shift supervisors moved from end-of-week PM completion reports to a live dashboard showing every technician's active work order, completion progress, and overdue tasks. Overdue PMs trigger alerts within the shift window rather than after the fact, which made recovery possible rather than retroactive.
See your compliance baseline mapped
Bring your last 90 days of PM data and we will show you the structural gaps
A 30-minute session with the OxMaint reliability team uses your actual completion records, your asset criticality classes, and your connectivity dead-zone map to project a realistic 6-month compliance trajectory for your plant. No assumptions, no generic benchmarks.
Month by month
How compliance actually climbed from 54% to 95%
The gain was not linear. The first month showed a small drop as crews adjusted to new hardware, which is typical for any mobile rollout. By month two compliance crossed back through baseline. By month three the offline-mode benefit compounded as vault and basement PMs began closing on time for the first time in years. The final stretch from 88% to 95% required the supervisor dashboard, which caught the last category of overdue work before it became audit findings.
World-class threshold 90%
Industry average 80%
What changed in the field
Before and after, told through technician minutes
PM compliance moves when technician workflow improves. The cleanest way to show what changed is a side-by-side comparison of how a single field technician spent a typical shift before and after the rollout. The numbers below come from time-and-motion observation conducted by the maintenance director's office, two shifts pre-rollout and two shifts at month four.
Before rollout
8-hour shift breakdown
Wrench time on assets
3.4 hrs
Walking to terminal to log
1.8 hrs
Paper transcription and forms
1.4 hrs
Searching for asset history
0.9 hrs
Travel and breaks
0.5 hrs
After rollout
8-hour shift breakdown
Wrench time on assets
5.4 hrs
Tablet logging in place
0.8 hrs
QR scan and form taps
0.3 hrs
Reviewing asset history
0.5 hrs
Travel and breaks
1.0 hrs
Hard numbers for the CFO
The downstream operational metrics that moved with compliance
A compliance percentage in isolation is a vanity metric. What gave this case study credibility with corporate reliability and the CFO was the cluster of downstream operational metrics that improved alongside it. Below is what changed across the same six months, the leading indicator rising and the lagging indicators following predictably.
The rollout playbook
Six months, week by week, the exact deployment sequence
The deployment was paced deliberately. The most common reason mobile CMMS rollouts fail is rushing technician training before the underlying data is clean. This plant front-loaded preparation in weeks 1-6 and only began touching technician workflow in week 7. By the time crews picked up tablets, the underlying CMMS was already in a state to reward them.
Weeks 1-2
Baseline and zone mapping
Connectivity survey of every asset location. Identification of 217 dead zones requiring offline-first workflow.
Weeks 3-4
Asset register and QR tagging
3,800 assets validated, QR-coded, and physically tagged at access points. Asset hierarchy rebuilt by system.
Weeks 5-6
Tablet provisioning and pilot crew
Rugged tablets configured, MDM deployed, two senior technicians piloted the mobile workflow for two weeks.
Weeks 7-12
Phased crew rollout
Three crews onboarded per week through a two-hour hands-on training session each. Paper retired progressively.
Weeks 13-20
Dashboard and supervisor enablement
Real-time PM compliance dashboard rolled out to shift supervisors and plant manager. Weekly review cadence locked in.
Weeks 21-26
Stabilization and audit readiness
Compliance crossed 95%, first NERC audit completed with on-demand reports. Tablet adoption confirmed voluntary.
The five reasons mobile rollouts fail
What we avoided that derails most other plants
Mobile CMMS rollouts have a high failure rate, not because the technology fails but because the human change management goes wrong. The maintenance director on this project studied four prior CMMS implementations across the parent utility before designing this one. The five failure patterns below were anticipated and structurally prevented in the rollout plan.
F1
Bolt-on offline mode that loses data
Most CMMS apps treat offline as a limited fallback. The platform selected had offline as the primary mode, with full timestamp integrity and conflict-resolution sync, never a fallback experience.
F2
Consumer phones in industrial conditions
Consumer devices fail by 2 PM on a power plant shift. The plant issued ruggedized tablets at IP68 and MIL-STD-810G with extended batteries and high-brightness screens from day one.
F3
Overcomplicated work order forms
When mobile forms have 30 fields and three dropdowns, technicians abandon them. The PM completion form was capped at three taps and one optional photo, by deliberate design.
F4
No co-design with field technicians
Two senior technicians were embedded in the rollout team from week one. Their veto on any UX friction shaped the final mobile workflow more than any external consultant input.
F5
No executive air cover
The plant manager attended weekly status reviews and personally signed off on dead-zone scope. When operations pushed back on outage windows for training, the plant manager broke the tie.
Common questions
Frequently asked questions from maintenance leadership
Is going from 54% to 95% PM compliance in six months realistic for a power plant?
Yes, when the gap is structural rather than capacity-based. Most plants starting below 60% have execution friction, not technician shortage. Removing paper and dead-zone barriers typically yields 30-40 points within six months.
Book a baseline audit for a plant-specific projection.
Do we need rugged tablets, or will standard smartphones work for field technicians?
OxMaint runs on standard iOS and Android devices, no rugged hardware required. That said, power plants with vault, basement, and outdoor work zones see better long-term adoption with IP68 and MIL-STD-810G rated tablets. The mobile app is hardware-agnostic.
How does offline mode preserve audit-trail integrity for PM compliance records?
Every offline action is timestamped at the moment it occurs on the device, not at the moment of sync. Audit exports include device timestamp, sync timestamp, and technician identifier for every offline record, preserving the timeline regulators and incident investigations require.
How long until our technicians actually use the mobile app voluntarily?
Most plants see voluntary adoption above 80% within 30 days when the work order form is capped at three taps and field technicians help co-design the workflow. The case study plant reached 93% adoption by week 12.
Start a free trial to test the workflow.
What happens to our existing PM schedules and asset records during the rollout?
OxMaint supports CSV and Excel import for asset registers, PM schedules, work order history, and parts inventory. Migration typically completes in the first two weeks. Historical records remain searchable against each asset from day one of the deployment.
Move your PM compliance number
Most plants do not have a PM problem, they have an execution problem
If your PM compliance sits below 80%, the schedule is rarely the cause. The friction lives in paper, dead zones, and desktop-only CMMS workflows. A 30-minute conversation with OxMaint will map your specific friction points against this case study and project a realistic six-month trajectory for your plant. Bring your last 90 days of completion data and we will do the math live.