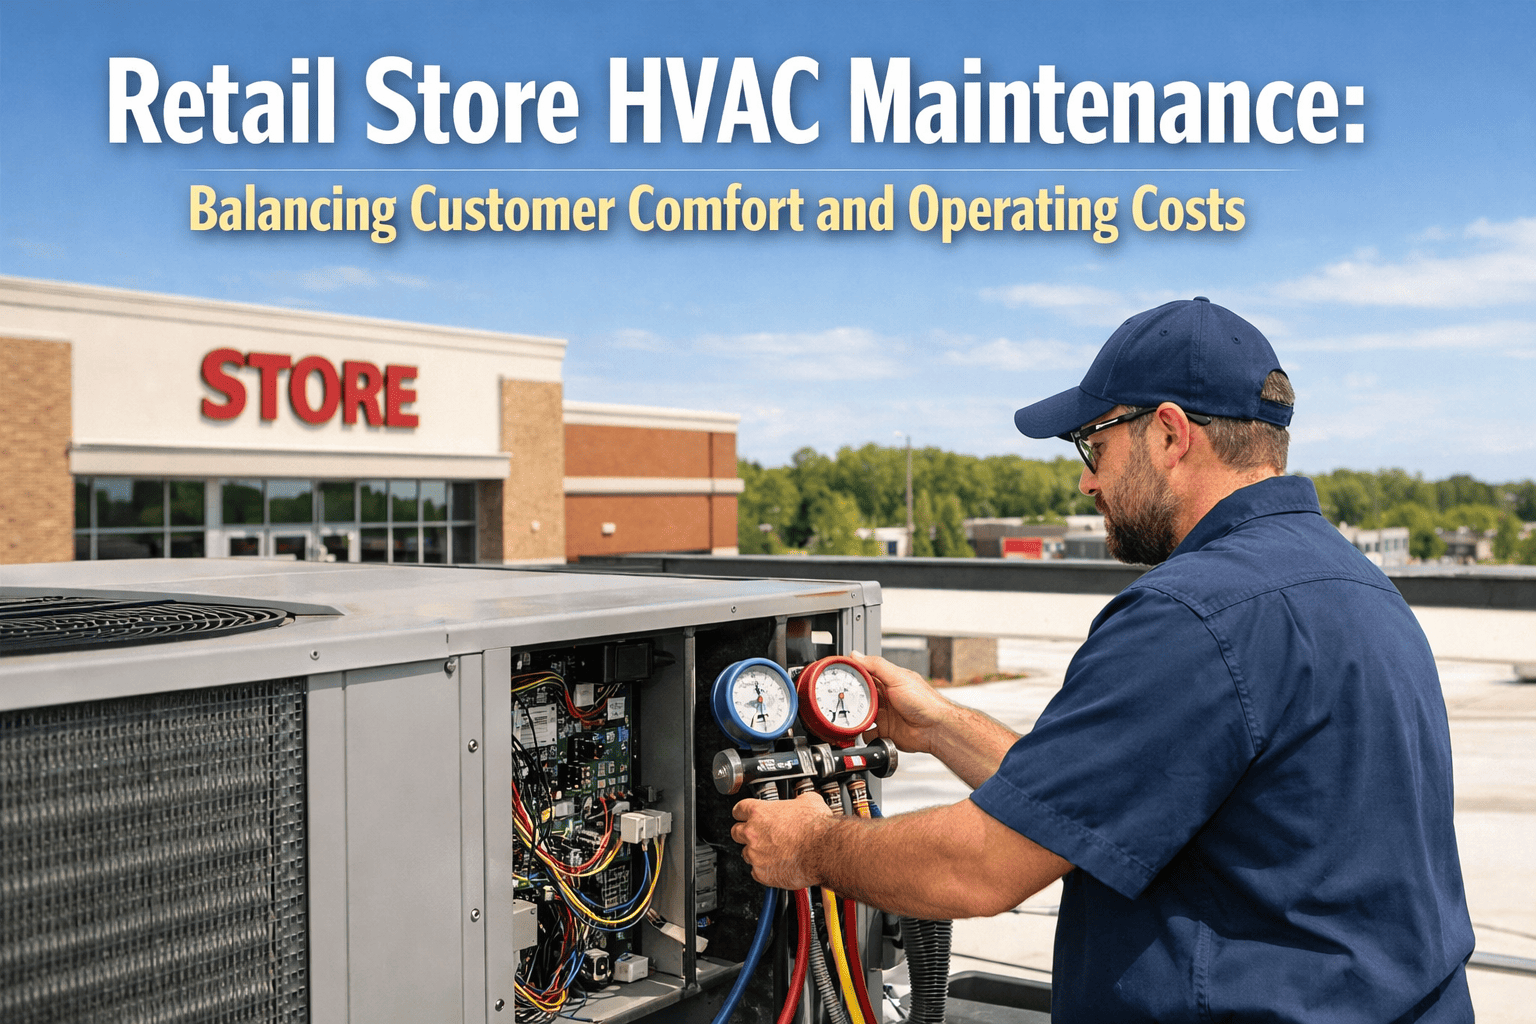
Retail HVAC is not a background system — it is an active driver of customer behaviour, transaction value, and energy cost. Studies consistently show that shoppers spend 15–20% longer in stores maintained at comfortable temperatures, and leave faster when the environment is too hot, too cold, or poorly ventilated. For a chain retailer operating 50 stores, the HVAC system is simultaneously the largest single energy cost, the most frequent source of unplanned maintenance spend, and the operational variable most directly connected to customer experience. Yet most retail portfolios still manage HVAC reactively — store by store, complaint by complaint — with no standardised PM programme, no multi-site visibility, and no ability to benchmark energy performance across the fleet. The retail chains consistently achieving the lowest energy cost per square foot and the highest comfort scores share one structural advantage: a centralised, data-driven maintenance programme that covers every store, every rooftop unit, and every dollar spent. Book a demo to see how Oxmaint manages multi-location retail HVAC maintenance from a single platform.
15–20%
Longer customer dwell time in stores maintained at comfortable temperatures versus poorly conditioned environments
40–60%
Of total retail store energy consumption attributed to HVAC — the single largest utility cost driver in retail operations
3–5x
Cost premium for reactive HVAC repairs versus planned maintenance interventions across retail store portfolios
25%
Average HVAC energy reduction achievable across retail portfolios with structured preventive maintenance and optimisation
Why Retail HVAC Directly Drives Revenue
Retail HVAC is unlike any other commercial building sector. Every equipment failure is simultaneously a maintenance problem and a sales floor problem — visible, immediate, and felt by every customer in the store.
DWELL
Customer Dwell Time
Temperature directly controls how long customers stay in the store. Shoppers in uncomfortable environments make faster decisions, buy fewer items, and are less likely to return. A 2°F deviation from comfort zone has measurable impact on basket size in grocery and apparel retail — environments where HVAC comfort is directly correlated to revenue per square foot.
ENERGY
Energy Cost at Portfolio Scale
HVAC accounts for 40–60% of retail store energy spend. For a 50-store chain, a 25% HVAC energy reduction represents $500,000–$1.5M in annual savings — achievable through structured PM, coil cleaning, and optimised setpoint management. Without a portfolio-level view, stores operating at degraded efficiency remain invisible.
BRAND
Brand Standard Consistency
Retail chains and franchise operators maintain brand standards across store environments. HVAC failures that create inconsistent temperature, humidity, or odour conditions in any location generate customer complaints, negative reviews, and brand standard violations — outcomes that affect the entire chain's reputation, not just the affected store.
MULTI
Multi-Site Management Challenge
Managing HVAC across 10, 50, or 500 retail locations with a small facilities team is operationally impossible without a centralised system. Most retail facility managers have no real-time visibility into which stores have overdue PM tasks, which RTUs are degrading, and which locations are consuming energy at above-average rates — until a complaint, a breakdown, or a utility bill forces their attention.
Retail HVAC Equipment: PM Requirements by System Type
Retail stores typically operate rooftop units as the primary HVAC platform — simpler than central plants but equally dependent on scheduled maintenance to maintain efficiency and reliability. See how Oxmaint standardises PM schedules across your full store fleet.
| Equipment Type |
Common Retail Location |
Key PM Interval |
Cost Impact if Neglected |
| Rooftop Units (RTUs) |
Standalone stores, strip malls, big-box retail |
Filter monthly, coil bi-annual, belt quarterly, refrigerant annual |
15–30% energy waste, early compressor failure ($3,000–$8,000 emergency replacement) |
| Split Systems |
Smaller format, kiosk, inline retail |
Filter monthly, coil annual, refrigerant check annual |
Capacity loss, comfort complaints, 20% energy efficiency drop |
| Packaged DX Units |
Mid-size stores, mall anchors |
Filter bi-monthly, coil semi-annual, economiser quarterly |
Economiser failure undetected — bypasses free cooling, adds $4,000–$10,000 annual energy cost per unit |
| Make-Up Air / Ventilation |
Food halls, grocery, stores with kitchen areas |
Filter monthly, heat exchanger annual, burner semi-annual |
IAQ complaints, negative pressure, energy waste, health code risk in food areas |
| BAS / EMS Controls |
Larger format retail with building automation |
Setpoint review quarterly, sensor calibration annual, sequence verification bi-annual |
Setpoint drift wastes energy across all controlled units — invisible without monitoring |
Four HVAC Problems Costing Retail Chains Revenue and Margin
The same failure patterns repeat across retail portfolios — regardless of store format, brand, or geography. Each one is preventable with a structured, portfolio-wide maintenance programme.
01
Store-by-Store Reactive Management
Without a centralised PM system, each store manages its own HVAC reactively — calling contractors when equipment fails, losing institutional knowledge at every manager turnover, and generating no data that headquarters can use to benchmark performance, plan capital, or identify underperforming locations. Reactive costs accumulate invisibly across the portfolio.
02
No Energy Performance Visibility
A dirty RTU coil increases energy consumption by 15–30% per unit. Across a 50-store portfolio, 20 stores with degraded coils represent $200,000–$600,000 in avoidable annual energy spend — invisible without portfolio-level energy tracking. Stores with above-average consumption are not identified until the utility bill is already paid.
03
Peak Season Failures
RTUs deferred on maintenance consistently fail during peak summer and winter trading periods — when thermal loads are highest, stores are fully staffed, and the financial cost of comfort failures is greatest. Emergency HVAC contractors during peak periods carry 1.5–2.5x labour premiums, and store closures or reduced trading during a retail peak can cost more than an entire year of preventive maintenance.
04
CapEx Surprises on Ageing Equipment
Retail RTUs have a typical service life of 12–18 years. Most retail portfolios have no visibility into fleet age distribution or condition status — so capital replacement requests arrive as emergency submissions rather than planned budget line items. Without lifecycle data, district managers cannot justify replacement programmes to finance until after a failure forces the issue.
One Platform. Every Store. Real-Time HVAC Visibility Across Your Entire Retail Portfolio.
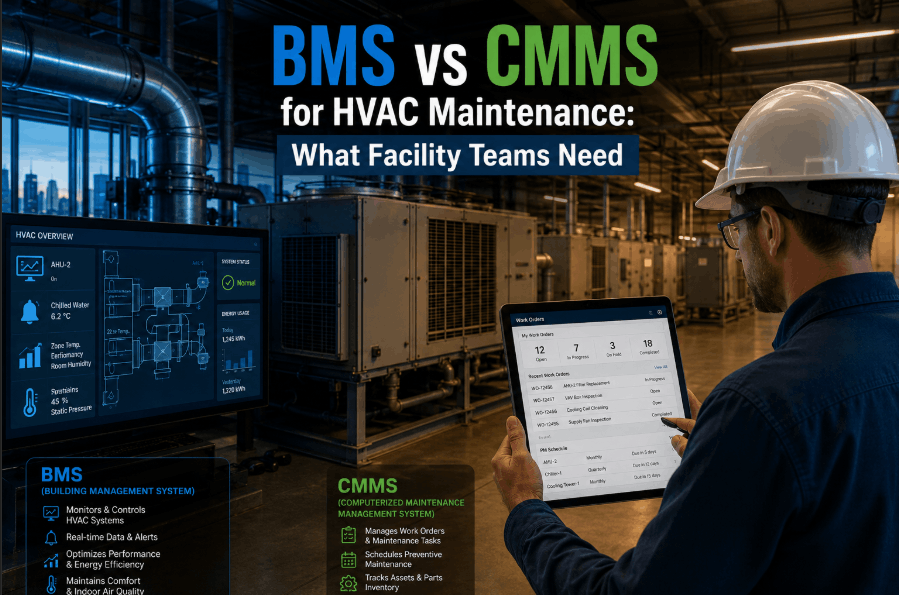
Oxmaint gives retail facility managers centralised PM scheduling, energy performance tracking, contractor management, and CapEx planning across every store — without visiting each location or chasing individual contractors for service confirmation.
Reactive vs. Structured Retail HVAC Management
The performance gap between reactive and structured retail HVAC maintenance compounds across a portfolio — in energy costs, equipment lifespan, emergency spend, and customer experience.
PM Scheduling and Execution
Reactive Management
PM tasks tracked by individual store managers via spreadsheet or paper calendars. Task completion inconsistent. No headquarters visibility into which stores are compliant and which are overdue. Contractors managed separately at each location with no standard scope or pricing.
With Oxmaint Multi-Site
Standardised PM schedules deployed across every store simultaneously from a single platform. Completion tracked centrally. District managers see compliance status across the full portfolio. Preferred contractors receive work orders digitally with standard scope and pricing.
Energy Performance Tracking
Reactive Management
Energy consumption tracked at portfolio level only as aggregate utility spend. Individual store outliers not identified until bills are reviewed quarterly or annually. Degraded equipment runs at above-normal consumption for months undetected.
With Oxmaint Multi-Site
Energy performance tracked per store and per unit. Stores consuming above portfolio average flagged automatically. Maintenance events — coil cleaning, filter replacement, refrigerant top-up — mapped against energy readings to quantify each PM task's energy impact.
Peak Season Readiness
Reactive Management
No pre-season maintenance programme. RTUs that received no service since last peak season fail at maximum load. Emergency callouts concentrated in July and January — when labour premiums are highest and customer impact is greatest.
With Oxmaint Multi-Site
Pre-season maintenance work orders generated automatically across the full portfolio 6–8 weeks before peak. Coil cleaning, refrigerant checks, and belt inspections completed before thermal load peaks. Emergency callout frequency drops 40–60% in the first peak season after programme activation.
CapEx Planning and RTU Replacement
Reactive Management
RTU replacement driven by failure events. No fleet age data, no condition scores, no replacement schedule. Finance teams approve emergency CapEx based on failure urgency rather than lifecycle data. Average replacement cost 35% higher than planned procurement.
With Oxmaint Multi-Site
RTU fleet age and condition tracked across all stores. Units approaching end-of-life flagged 18–24 months ahead. Replacement programmes planned, budgeted, and procured at standard pricing — not emergency rates after equipment failure during trading hours.
How Oxmaint Manages Multi-Location Retail HVAC
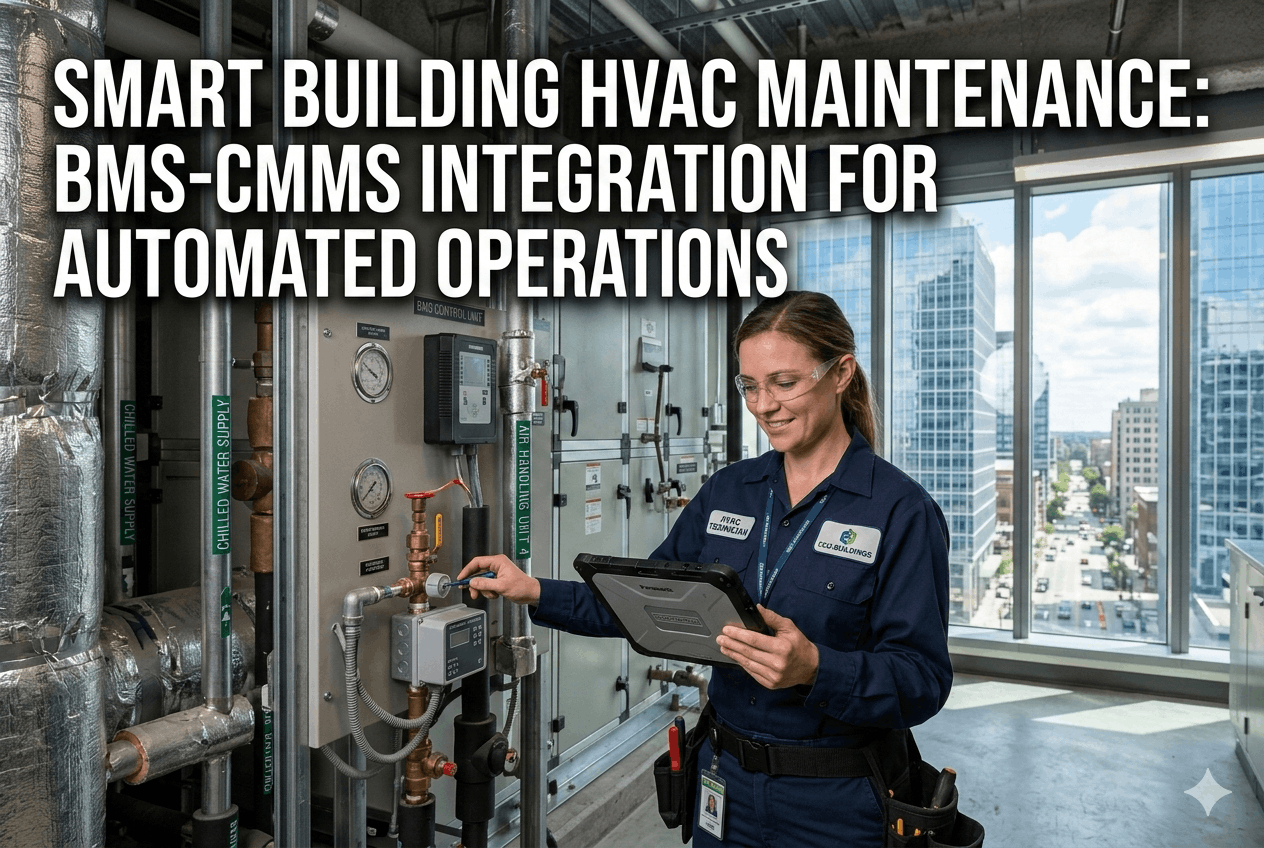
Managing HVAC across a retail portfolio requires more than work orders — it requires a system built for distributed teams, centralised reporting, and portfolio-scale energy tracking. Book a demo to see Oxmaint running on a live retail store portfolio.
01
Fleet-Wide Asset Registry — Every RTU, Every Store
Every rooftop unit, split system, and BAS controller is registered with installation date, model, warranty status, and condition score. Fleet age distribution is visible at portfolio level — showing which stores have the oldest equipment, highest repair frequency, and largest energy deviation from the portfolio average. QR codes on each unit give contractors instant mobile access to the complete service record.
02
Standardised PM Schedules Deployed Across All Stores
PM schedules are built once and deployed across every store simultaneously — monthly filter changes, quarterly belt checks, bi-annual coil cleaning, annual refrigerant inspections. Work orders generate automatically at the correct interval, are assigned to the preferred contractor for each region, and require photographic completion evidence before closure. No manual calendar tracking at store level.
03
Energy Performance Dashboard by Store and Region
Energy consumption is tracked per store and benchmarked against portfolio averages. Stores consuming above-average energy per square foot are flagged for investigation — typically revealing dirty coils, refrigerant undercharge, or setpoint drift that have been consuming excess energy for months undetected. Maintenance events are logged against energy readings to track recovery.
04
Fleet CapEx Forecasting for Finance Teams
RTU age, condition scores, and total maintenance cost per unit feed directly into rolling 3–5 year CapEx forecasts. Finance and operations teams see exactly which stores require RTU replacement in each budget year — with procurement lead time built into every alert. Replacement programmes planned and priced before failure, not after.
Retail HVAC Maintenance: Energy Optimisation at Portfolio Scale
Energy savings from RTU coil cleaning (per unit per year)8–12%
Energy recovery from filter change compliance (per unit)6–10%
Emergency callout reduction after first structured PM cycle45–60%
Increase in RTU service life with quarterly PM vs. reactive management35–45%
PM compliance rate achievable within 90 days of Oxmaint deployment65%+
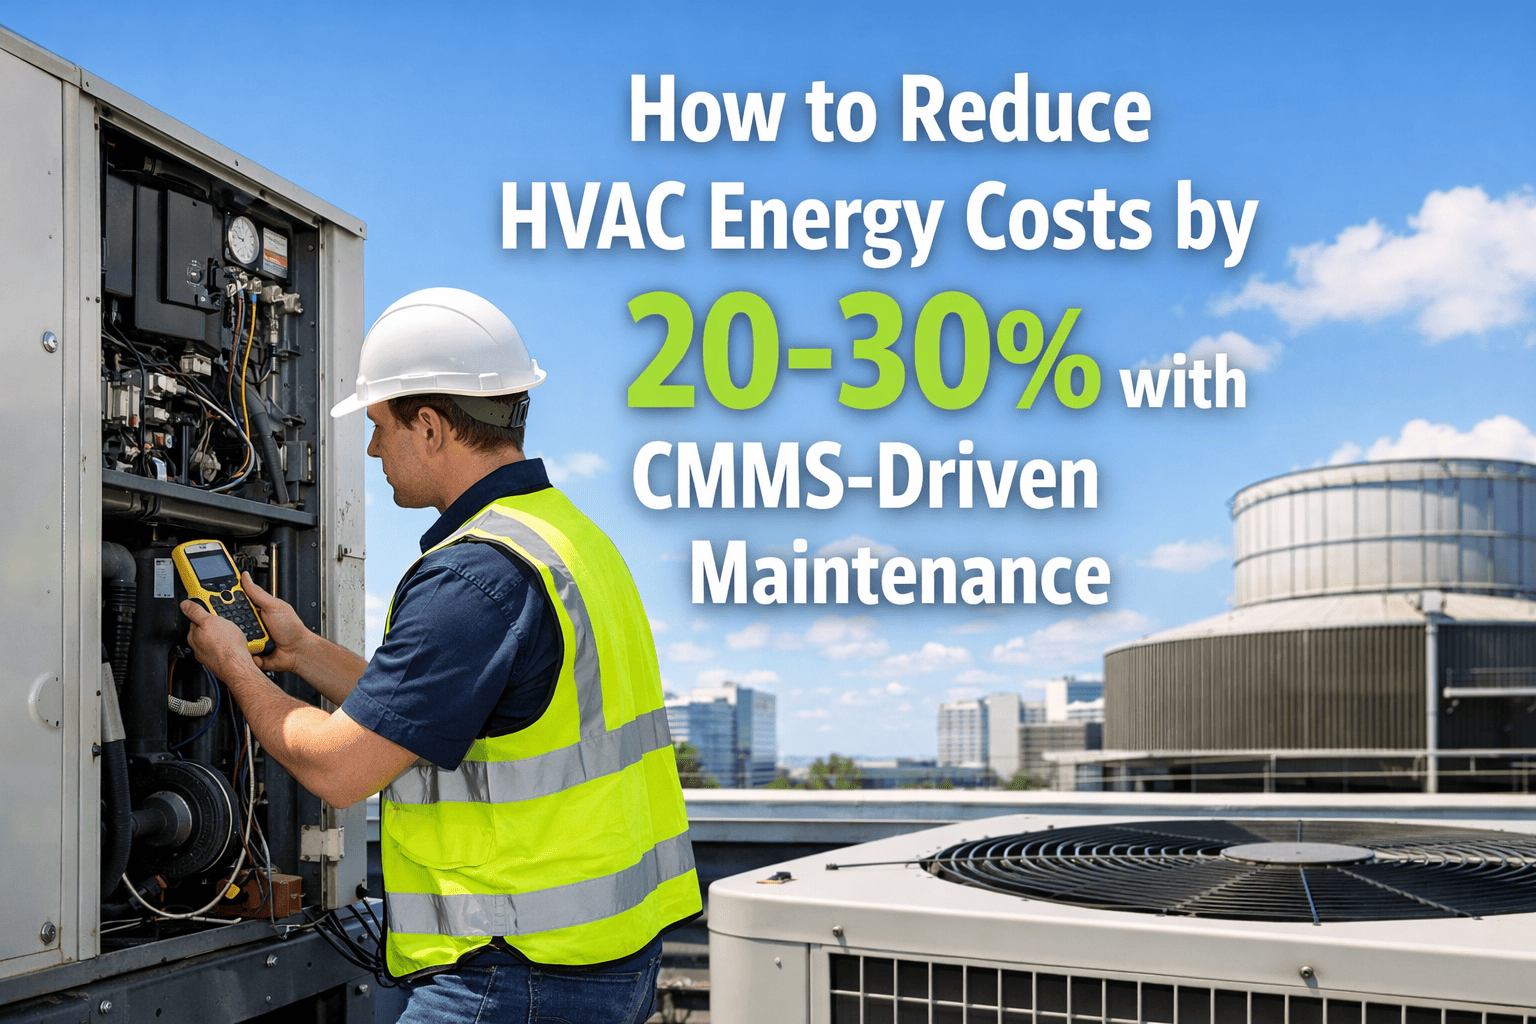
Average portfolio energy cost reduction in year one18–25%
Performance benchmarks for retail HVAC portfolios transitioning from reactive to structured multi-site maintenance programmes
25% Less Energy Spend. 60% Fewer Emergency Callouts. Same Store Count.
These are not projections — they are averages from retail portfolios that activated structured PM programmes within 90 days of Oxmaint deployment. For a 50-store chain spending $2M annually on HVAC energy and maintenance, that represents $500,000 in year-one savings without adding a single headcount.
25%
Average portfolio HVAC energy reduction in year one of structured PM
60%
Emergency callout reduction after the first structured PM cycle across the fleet
5 Yrs
Additional RTU service life with quarterly PM versus reactive run-to-failure management
60 Days
To active PM schedules across every store in your portfolio — no implementation fees
The ROI of Structured Retail HVAC Maintenance
$500K+
Annual HVAC energy and maintenance savings for a 50-store chain with structured PM versus reactive management
35%
Lower RTU procurement cost when replacements are planned and procured ahead of failure versus emergency capital
5 Yrs
Additional RTU fleet service life with structured quarterly PM versus reactive run-to-failure across the portfolio
90 Days
To PM compliance across all store HVAC equipment with Oxmaint multi-site deployment
Frequently Asked Questions: Retail Store HVAC Maintenance
QHow often should retail rooftop units be serviced?
Retail RTUs should have monthly filter inspections, quarterly belt and bearing checks, bi-annual coil cleaning (spring and autumn for pre-season readiness), and annual refrigerant charge verification and comprehensive inspection. For stores in coastal, dusty, or high-humidity environments, filter servicing frequency should increase to bi-weekly or weekly. Stores with restaurant or food service tenants often require more frequent coil cleaning due to grease and particulate loading. Oxmaint schedules all intervals by store type and environment automatically.
What is the typical ROI on retail HVAC preventive maintenance?
For most retail portfolios, structured HVAC PM delivers 18–25% energy cost reduction in the first year — primarily through coil cleaning, filter compliance, and refrigerant optimisation. Combined with the elimination of emergency repair premiums and the extension of RTU service life, the total programme ROI typically exceeds 300% in year one for portfolios previously managed reactively. For a 50-store chain with $40,000 per year in HVAC energy spend per location, this represents $400,000–$500,000 in annual savings at the portfolio level.
How does Oxmaint manage HVAC across multiple store locations?
Oxmaint provides a single portfolio-level dashboard showing PM compliance status, overdue work orders, energy performance benchmarks, and RTU fleet condition across every store. PM schedules are built once and deployed across all locations simultaneously. Preferred contractors receive work orders digitally with standard scope and pricing. District managers and facilities directors see aggregate and individual store performance without visiting each location. Compliance reports export per store or per region in under 2 minutes for ownership and operations reviews.
What is the average retail RTU service life and when should replacement be planned?
Retail rooftop units have a rated service life of 12–18 years. Units managed reactively typically reach 8–12 years before failure. Units on structured quarterly PM consistently reach 15–20 years of service life. Oxmaint tracks installation date, cumulative maintenance spend, and condition score for every unit in the fleet — generating replacement alerts 18–24 months before projected end-of-life. This gives procurement teams the lead time to plan replacements at standard pricing rather than emergency capital events during trading periods.
How does HVAC condition affect customer dwell time and sales?
Retail research consistently shows that store temperature is among the top three environmental factors influencing customer comfort and purchase behaviour. Shoppers in uncomfortable stores — too hot, too cold, or poorly ventilated — make faster purchase decisions, buy fewer items per visit, and are significantly less likely to return. The revenue impact of comfort failures is particularly acute in grocery, apparel, and food service retail where the browsing experience is central to transaction value. Maintaining consistent temperature across every store in the portfolio is therefore a revenue objective, not just a facilities management task.
Every Store Comfortable. Every RTU Maintained. Every Energy Dollar Tracked.
Oxmaint gives retail facility teams fleet-wide RTU asset management, standardised multi-store PM scheduling, energy performance benchmarking, contractor work order management, and CapEx forecasting — all in one platform, live across your full store portfolio in 60 days, with no implementation fees.
Multi-Store PM Scheduling
RTU Fleet Age Tracking
Energy Performance Dashboard
Contractor Work Order Management