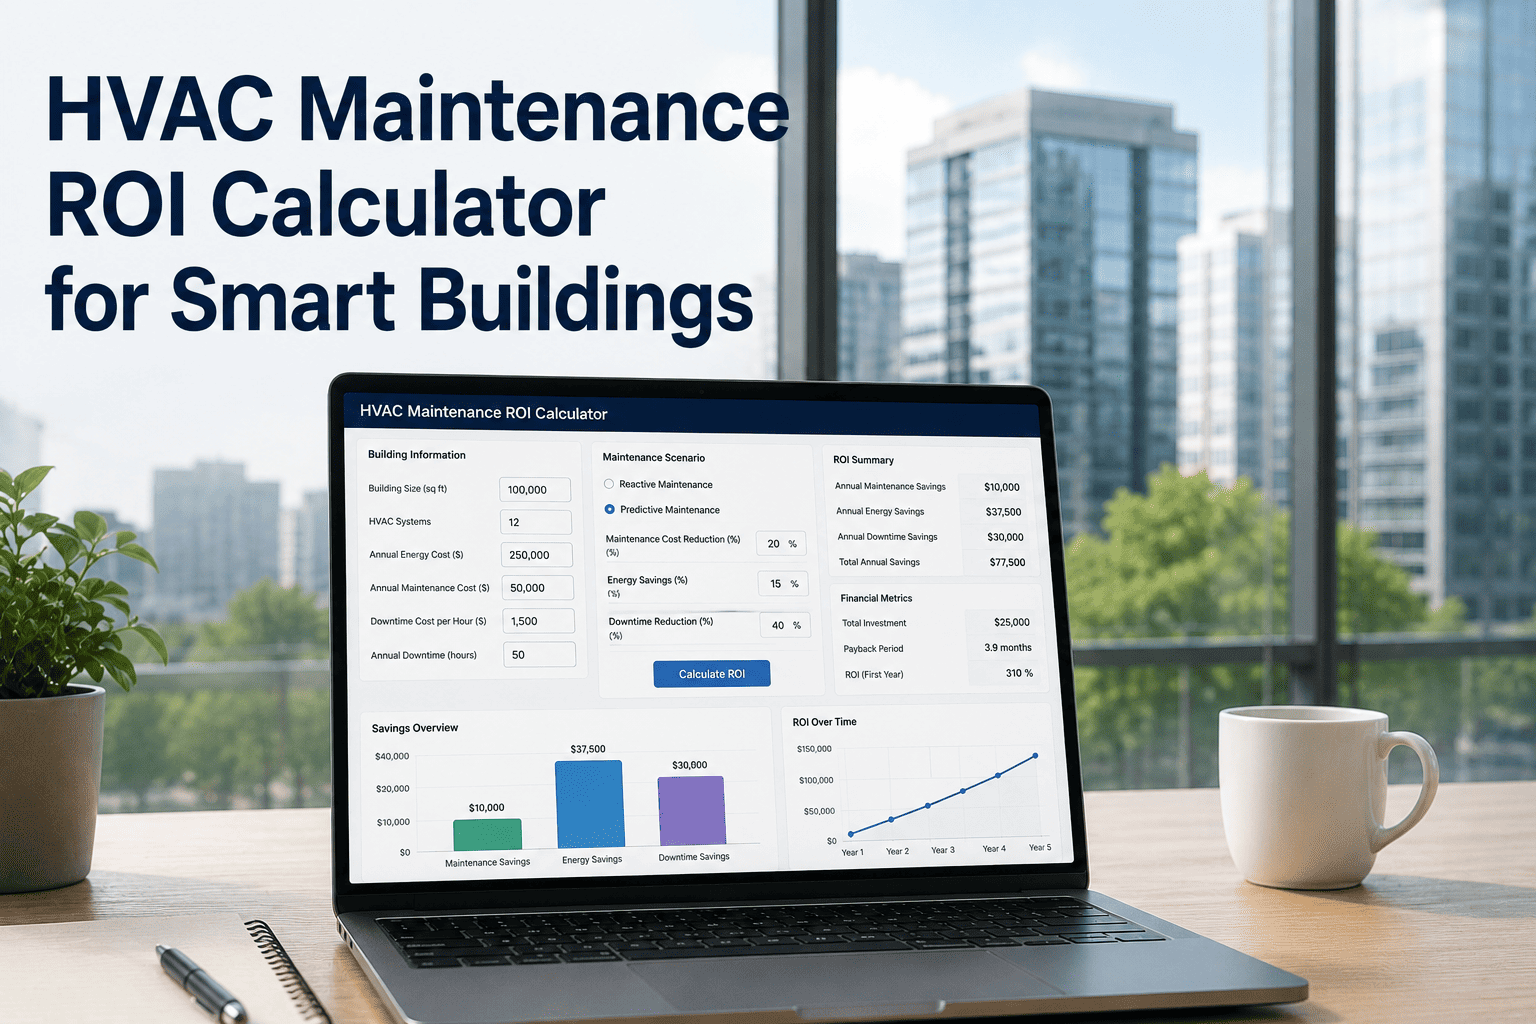
Every CFO and facility director eventually faces the same question: what is the return on investing in better HVAC maintenance? The answer exists — it is just buried across four separate value streams that most teams never calculate together. Avoided emergency repairs, recovered energy waste, extended asset life, and eliminated reactive overtime each deliver measurable, quantifiable savings. OxMaint's Analytics and Reporting platform tracks all four value streams in a single dashboard — so the ROI case stays visible to ownership throughout the year, not just at budget time.
HVAC Maintenance ROI: The Four Calculation Models
Each value stream below includes the formula, real industry data inputs, and benchmark outcomes from facilities that have documented their results. Use these to build your own ROI case for ownership or procurement.
Combined ROI Summary — Mid-Size Commercial Portfolio
| ROI Category | Annual Value | Measurement Method | Confidence |
|---|---|---|---|
| Emergency Repair Avoidance | $140,000 | Reactive work order count × avg. emergency cost | High |
| Energy Savings | $32,000 | Utility bill vs. baseline after PM improvement | High |
| CapEx Deferral (Asset Life) | $168,000 | Replacement cost × life extension ÷ total life | Medium |
| Labor Efficiency | $59,000 | Hours saved × blended rate + OT eliminated | High |
| Total Annual ROI | $399,000 | Combined across all four value streams | High |
Get a Site-Specific ROI Estimate for Your Portfolio
OxMaint's team builds a custom ROI model based on your portfolio size, asset count, current reactive work ratio, and energy spend. Book a 30-minute demo and leave with numbers your CFO will act on.
Payback Period by Building Type
ROI realization speed varies by building type, asset density, and current reactive work ratio. These ranges reflect OxMaint customer data across facility categories.
Expert Review
The most common error I see in HVAC maintenance ROI presentations to ownership is undervaluing the CapEx deferral component. A maintenance program that extends a chiller's operating life from 20 to 23 years does not just save $280,000 — it defers that capital outlay by three years, which has a present value calculation that typically adds 15–20% to the stated savings when discounted at the portfolio's hurdle rate. The second error is presenting the ROI calculation once at budget time and never updating it. The facilities teams that get sustained investment in their maintenance programs are the ones showing a live dashboard — updated monthly — that tracks actual avoided costs against the modelled projection. When ownership sees $84,000 in avoided emergency repairs in a single quarter displayed as a real number from real work orders, the maintenance budget conversation changes permanently.
Make the ROI Case With Live Data, Not Projections
OxMaint tracks avoided costs, energy savings, and labor efficiency in real time — so every number in your ROI presentation comes from actual work orders, not estimates. Start free and have your first ROI report ready in 30 days.
Frequently Asked Questions
What is a realistic ROI expectation for HVAC preventive maintenance investment?
For commercial facilities with a current reactive work ratio above 30%, ROI from a structured PM program typically ranges from 3x to 8x annual investment within the first 12 months, with the primary value driver being avoided emergency repair costs. The U.S. Department of Energy cites 5–20% annual energy savings from maintenance-driven efficiency recovery, and industry data consistently shows 40–50% lower total maintenance cost per square foot at facilities with 80%+ PM compliance. OxMaint's analytics dashboard tracks all four ROI categories — repair avoidance, energy, asset life, and labor — as actual dollar values from real work order data, not projections.
How do you calculate the cost of HVAC downtime for an ROI model?
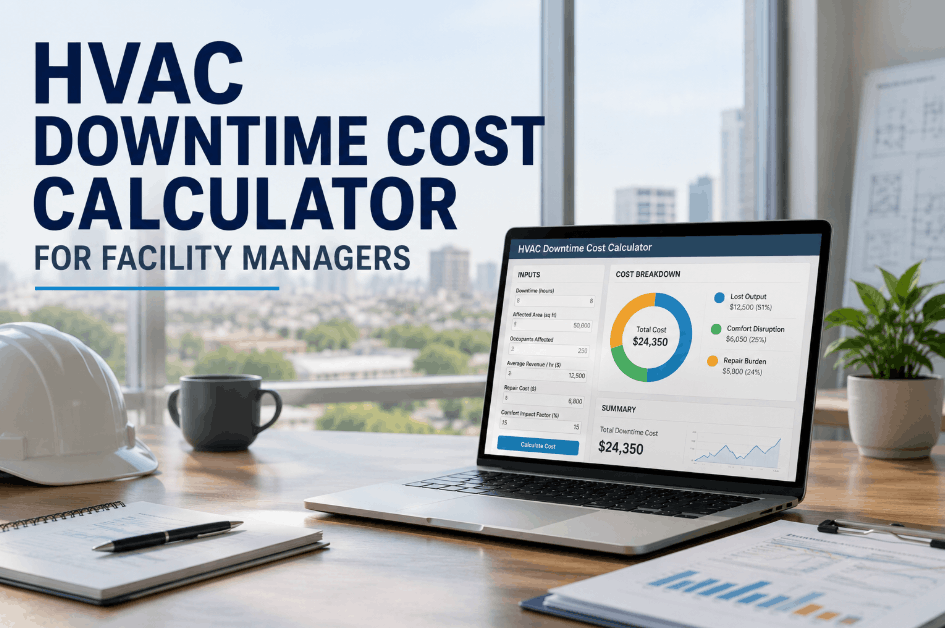
HVAC downtime cost calculation requires four inputs: lost productivity cost per hour of occupant disruption (typically $18–$45 per occupant for office space), emergency contractor rates and overtime premium (typically 1.5–2.5x standard rates), any lease penalty or tenant credit exposure, and reputational cost estimated as a percentage of lease renewal probability impact. For a 200-person office with a 4-hour HVAC failure, total downtime cost often reaches $28,000–$65,000 per event when all four components are included. Book a demo to see how OxMaint's ROI model calculates this for your specific facility type and occupancy profile.
How long does it take to see measurable HVAC maintenance ROI after implementing a CMMS?
Most facilities see measurable results within 60–90 days of CMMS implementation — specifically in reduced reactive work volume and improved PM compliance rate, which are the two metrics that drive the largest share of ROI. Energy savings take 3–6 months to appear in utility data because they require consistent PM execution over one or two seasonal cycles to accumulate. Full ROI across all four value streams is typically demonstrable at the 12-month mark, when before-and-after maintenance cost, energy cost, and emergency repair frequency can be compared against the prior year baseline with statistical confidence.
Can OxMaint generate an HVAC maintenance ROI report for ownership or board presentations?
Yes. OxMaint's analytics module generates exportable ROI summary reports that show avoided emergency repair costs (calculated from work order data), energy deviation reduction (calculated from meter data or manually entered utility bills), PM compliance improvement trends, and labor efficiency metrics — all in a format designed for executive or ownership presentation. Reports can be filtered by building, asset class, or date range and exported as PDF with summary KPIs on the cover page. Most customers generate their first ROI report within 30 days of going live with OxMaint's full analytics module.