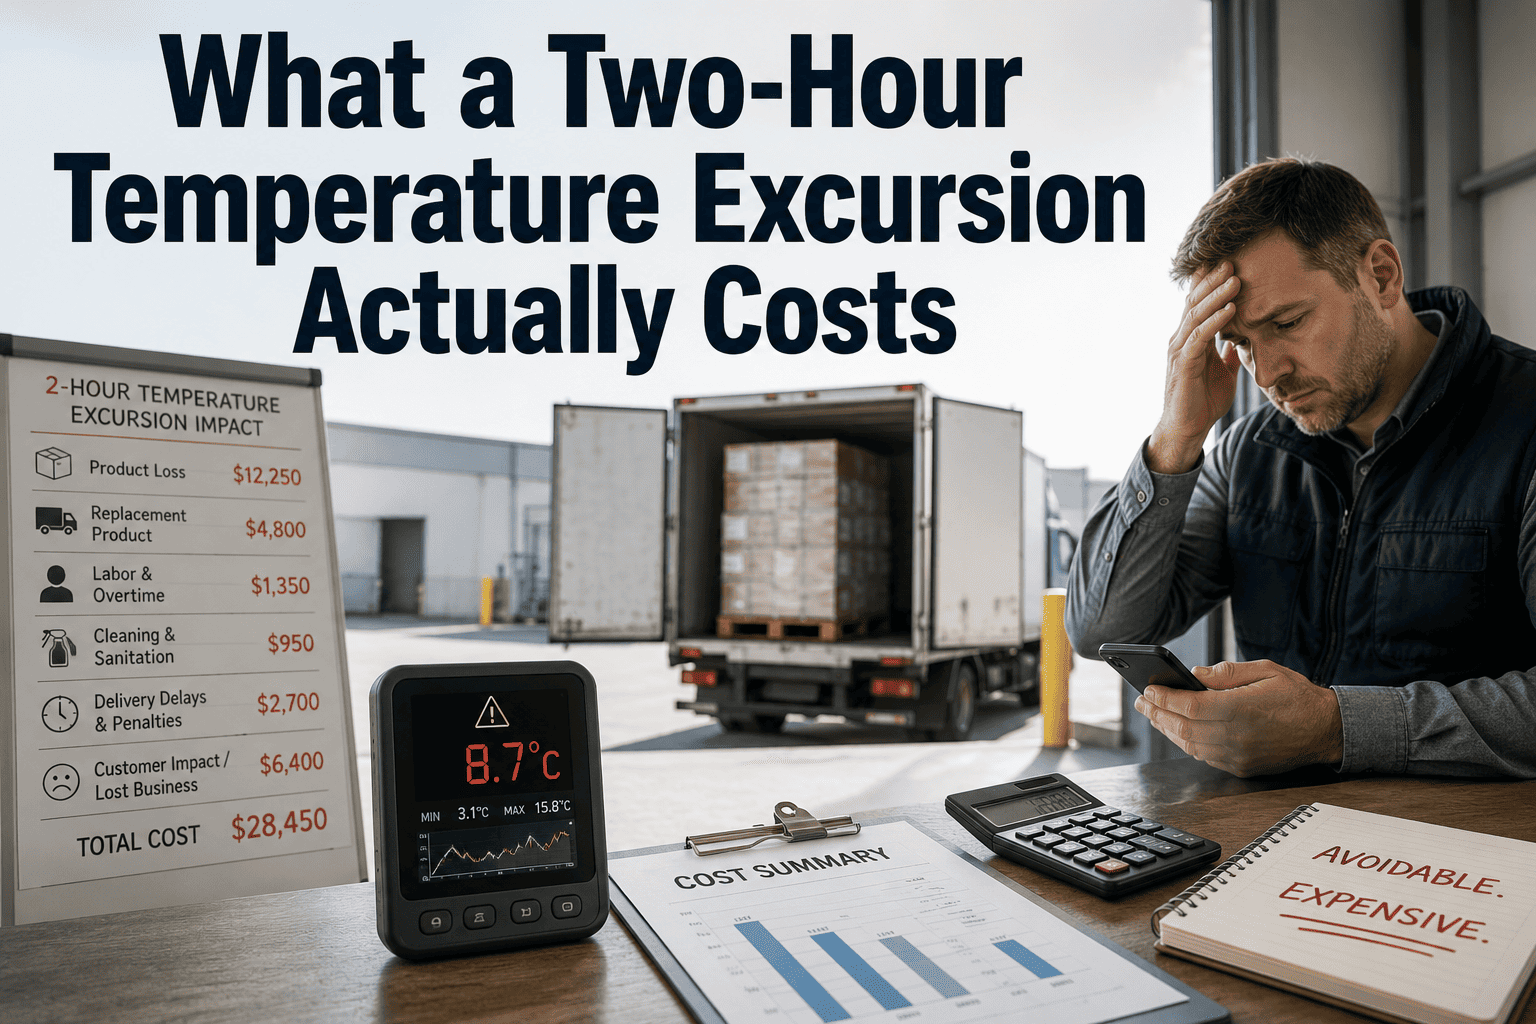
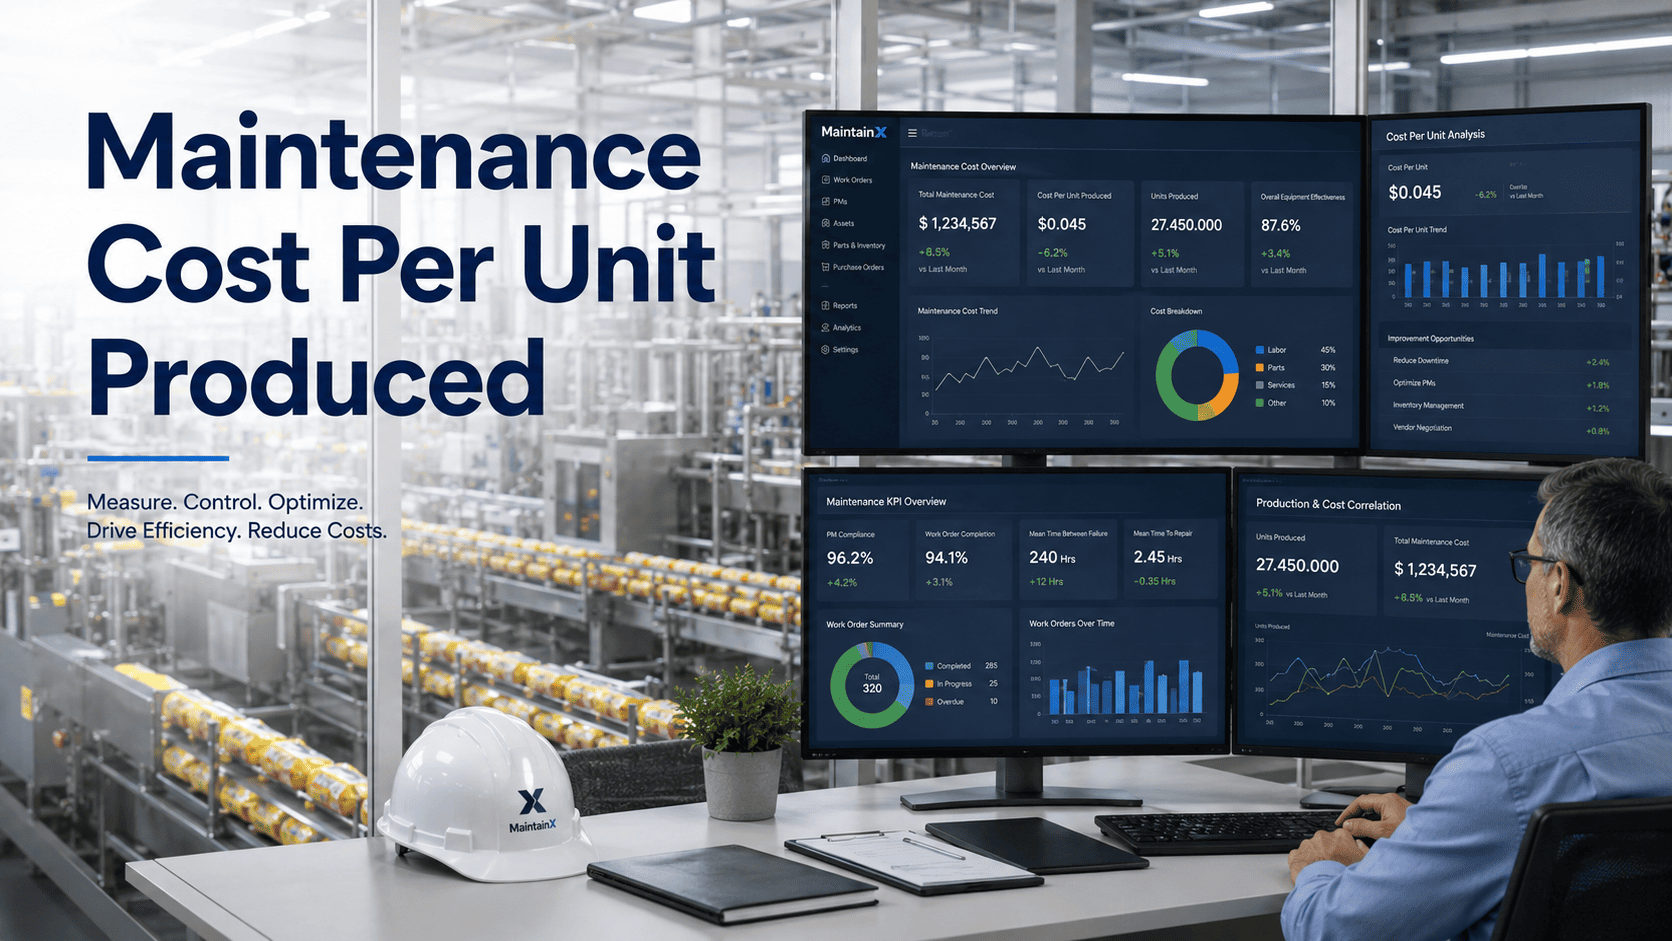
Most food plant managers know downtime is expensive. What they don't know is that the number on the maintenance report captures only a fraction of what was actually lost. Research shows food and beverage manufacturers can lose between $4,000 and $30,000 every single hour of unplanned stoppage — and that's before counting scrapped product, regulatory exposure, overtime wages, and customer attrition. This guide helps you calculate the real number, understand where the money disappears, and shows exactly what AI-powered maintenance does to stop it. Get started free with Oxmaint and see your plant's true downtime exposure today.
Maintenance ROI · Cost Analysis · 2026 Guide
The Real Cost of Downtime in Food Manufacturing Is 3–5× What You Think
82% of food manufacturers experienced unplanned downtime in the past 3 years. Of those, most significantly underestimated what each incident truly cost them. The visible production loss is only the beginning.
$30,000
Cost per hour in food processing (Processing Mag)
×
800 hrs
Average annual machine downtime per plant (Aberdeen Research)
=
$24M+
Annual exposure — before hidden multipliers
What You're Missing
The 6 Cost Layers Most Plants Never Count
When a line stops, the maintenance report logs the production loss. But five other financial wounds open simultaneously — and most of them never appear on any report.
[ VISIBLE ]
Direct Production Loss
~35% of total
Revenue not generated while the line is stopped. This is the only cost most plants record. At $30,000/hr, a 4-hour incident = $120,000 in production loss alone.
[ HIDDEN ]
Scrapped Product & Raw Material Waste
~20% of total
Perishable food in-process during stoppage is often unrecoverable. Dairy, meat, and bakery lines can scrap $20,000–$80,000 of product in a single incident, depending on the batch size and temperature sensitivity.
[ HIDDEN ]
Emergency Repair Premium
~15% of total
Rush-ordering parts during a crisis costs 40–300% more than planned procurement. After-hours technician callouts run at 1.5–2× normal rates. A planned repair that costs $3,000 becomes a $9,000 emergency.
[ HIDDEN ]
Idle Workforce & Overtime Wages
~12% of total
Your workers get paid whether the line runs or not. With 200 employees at $60/hr and 60% productivity loss, idle labour costs reach $7,200/hr. Add makeup overtime after recovery and costs compound further.
[ HIDDEN ]
Regulatory & Compliance Risk
~12% of total
Cold chain breaks and CCP failures trigger FDA documentation requirements. A single enforcement action costs $500K–$10M. Even smaller compliance gaps create audit findings that consume weeks of remediation time.
[ HIDDEN ]
Customer Attrition & Brand Damage
~6% of total
Repeated delivery failures erode retailer confidence. Late or partial orders damage shelf presence and open the door to competitors. This cost is invisible in the short term and devastating in the long term.
Your Numbers
Calculate Your Plant's True Annual Downtime Cost
Adjust the inputs below to match your plant profile. Results update instantly and include the hidden cost multiplier based on industry averages.
[ i ] A 2.4× hidden cost multiplier is applied based on ABB and Aberdeen Research industry data. This accounts for scrapped product, emergency repair premiums, idle labour, compliance risk, and customer attrition.
Visible production loss / year
$8,640,000
Hidden costs added (1.4×)
+$12,096,000
TRUE Annual Cost
$20,736,000
Potential savings with AI maintenance
$8,294,400
40% reduction — LLumin 2024 real-world data
Get Started Free — Start Recovering This
74% of Your Downtime Is Preventable
Start Eliminating It in 48 Hours
Oxmaint customers reduce unplanned downtime by 40% in the first 12 months — recovering millions in previously invisible losses from the same operations they ran before.
Root Cause Data
What Actually Causes Unplanned Downtime in Food Plants
Industry study data from Advanced Technology Services across food and beverage manufacturing plants reveals the true culprits — and all three are directly preventable with modern maintenance management.
Aging equipment & missed maintenance
[ FIX ] Predictive & preventive maintenance
Operator error & insufficient training
[ FIX ] Digital SOPs & mobile checklists
Lack of time for necessary maintenance
[ FIX ] Automated PM scheduling
Supply chain & parts unavailability
[ FIX ] Smart parts inventory management
Other / regulatory & compliance failures
[ FIX ] HACCP-linked digital records
Source: Advanced Technology Services industry study — food & beverage manufacturing plants
The key insight
74%
of all food plant downtime is caused by factors that are directly preventable with a modern AI-powered maintenance management system.
Aging equipment failures (42%) + maintenance time gaps (13%) + operator errors (19%) = 74% preventable with Oxmaint.
The ROI Case
The Financial Case for AI Maintenance — By the Numbers
WITHOUT AI Maintenance
Annual downtime cost
$20.7M
PM compliance rate
52%
Audit prep time
3–4 hours
Emergency repair ratio
60–70%
Mean time to repair (MTTR)
81 min avg
Product loss per year
5–20% of capacity
VS
WITH Oxmaint AI Maintenance
Annual downtime cost
$12.4M (-40%)
PM compliance rate
94%+
Audit prep time
Under 60 seconds
Emergency repair ratio
Below 20%
Mean time to repair (MTTR)
20% faster
Product loss per year
Near zero from equipment
VERDICT
At a software investment of $15K–$80K/year, the ROI from a single avoided major incident is 6–10×. Most food plants reach positive ROI within 60–90 days of going live.
Common Questions
What Food Plant Managers Ask About Downtime Costs
How do I accurately calculate my hourly downtime cost?
Calculate your hourly production revenue first: take your daily output value and divide by production hours. Then add idle labour cost (employees on payroll during stoppage × hourly rate). Finally, apply a 2.0–2.5× multiplier to account for hidden costs including scrapped product, emergency repair premiums, compliance exposure, and customer impact. The calculator on this page uses a 2.4× multiplier based on ABB and Aberdeen Research benchmarks for food and beverage facilities.
Is downtime getting more expensive, or does it just feel that way?
It is genuinely escalating. Siemens 2024 data found the world's 500 largest manufacturers now lose $1.4 trillion annually to unscheduled downtime — up sharply from previous years. For food manufacturers specifically, higher energy costs, labour shortages, tighter food safety regulations, and more complex supply chains all amplify the per-hour cost of every stoppage. The $30,000/hr figure cited by Processing Magazine understates the full picture for larger or more complex plants.
What percentage of our downtime is actually preventable?
Based on industry study data, approximately 74% of food manufacturing downtime is preventable. This breaks down as 42% from aging equipment and missed maintenance (prevented by predictive and preventive maintenance programs), 19% from operator error (prevented by digital SOPs and training tools), and 13% from lack of time to perform maintenance (prevented by automated PM scheduling). Only the remaining 26% comes from truly unpredictable causes.
How long until we see ROI from a maintenance software investment?
Most food plants hit positive ROI within 60–90 days of going live. This is because the software investment ($15K–$80K/year for most plant sizes) is recovered the moment a single major incident is avoided — and at $30,000/hr and an average incident duration of 4 hours, one avoided breakdown is worth $120,000 in visible costs alone, before hidden cost multipliers. After that threshold, every avoided failure is pure savings that compounds over time.
Your Downtime Bill Is Arriving Every Single Shift
Every Day Without Predictive Maintenance Is a Day You're Paying Full Price
Food manufacturers using Oxmaint reduce unplanned downtime by 40%, hit 94%+ PM compliance, and walk into any audit fully prepared — all within the first year. The cost of the software is recovered from a single avoided breakdown.
40%
Downtime reduction year 1
6–10×
First-year ROI typical
60–90
Days to positive ROI