A fleet truck sitting in the shop because a $14 filter is out of stock costs more per hour than the part costs per year. Parts stockouts are the hidden downtime multiplier that most fleet maintenance dashboards either measure too late or do not measure at all — because the parts inventory screen is separate from the work order screen, and nobody calculated the delay cost until the dispatcher was already on the phone explaining why the truck is not on the job. The right fleet parts stockout dashboard connects parts availability to vehicle uptime, flags reorder thresholds before they are missed, and gives fleet managers the analytics to eliminate the stockout pattern permanently rather than just reacting to it one at a time. If you want to see how OxMaint's parts analytics dashboard works, start a free trial or book a demo with your fleet size in mind.
Parts Inventory · Analytics Dashboard · Fleet Maintenance 2026
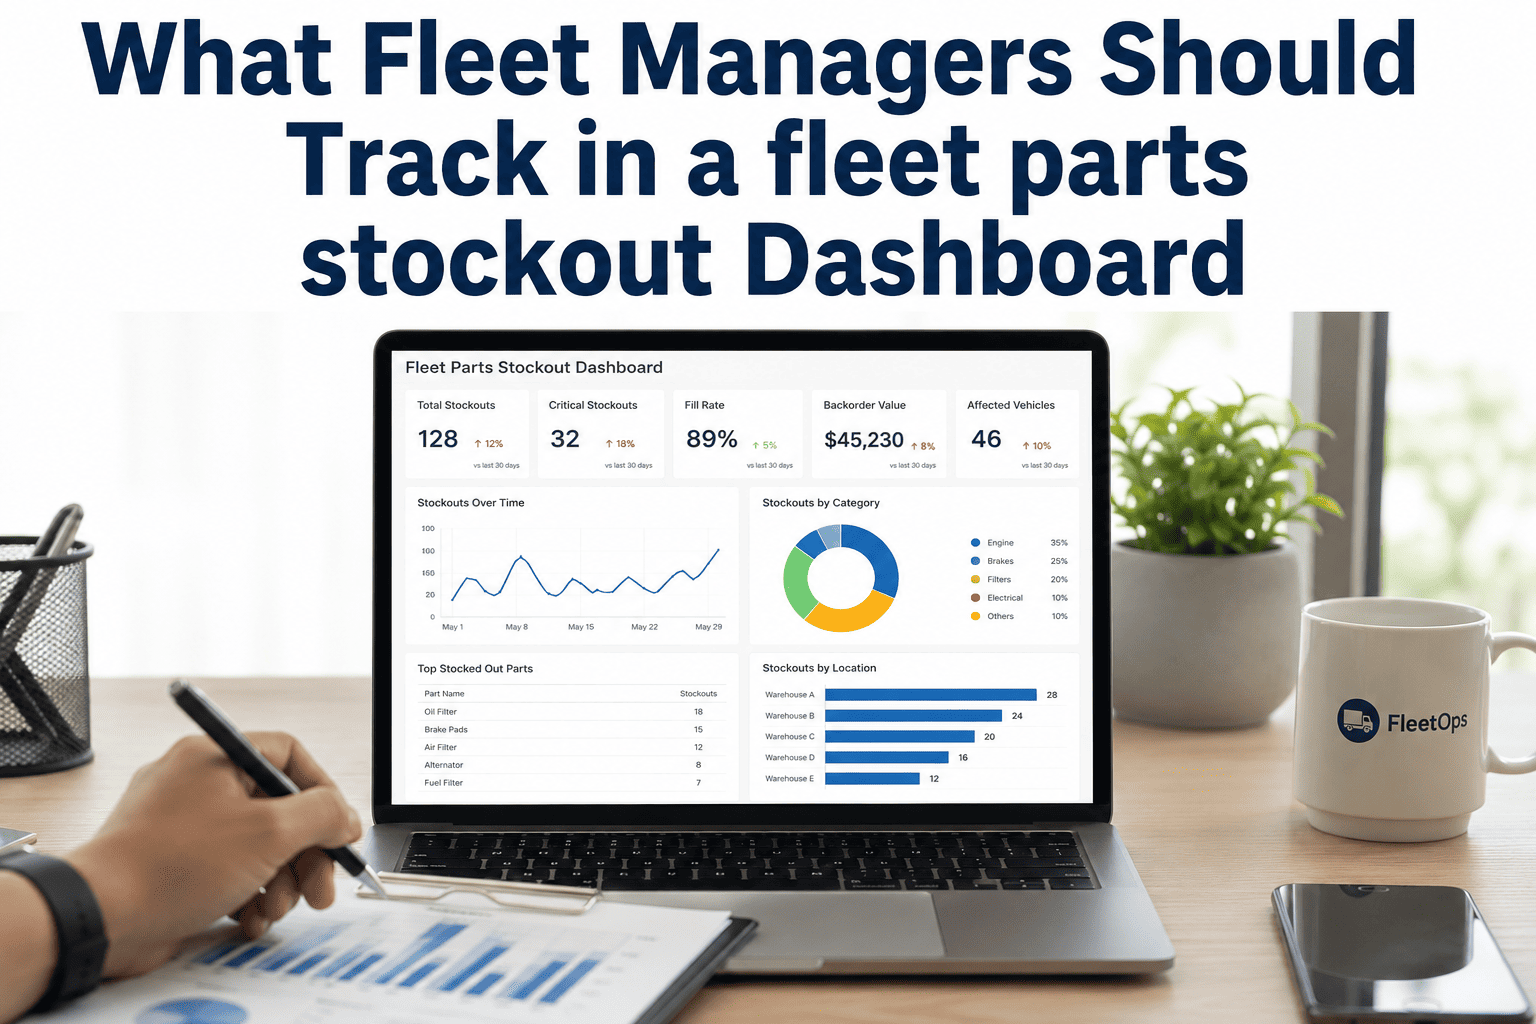
What Fleet Managers Should Track in a Fleet Parts Stockout Dashboard
The metrics, alerts, and reporting fields that turn a reactive parts room into a proactive uptime engine — and the analytics that prevent the same stockout from grounding the same vehicle twice.
The Real Cost of Stockouts
What Parts Stockouts Actually Cost — Beyond the Part Price
D
Direct Downtime Cost
$680–$2,400/day
Revenue lost per grounded commercial vehicle while waiting for a part. Varies by fleet type but the range is consistent across service, construction, and delivery operations.
E
Emergency Procurement Premium
18–35% markup
The price premium paid when parts are ordered urgently from a non-preferred supplier or expedited from a distributor — versus planned purchases at negotiated rates.
L
Labor Idle Time
2.3 hrs average
The average time a mechanic spends waiting, sourcing alternatives, or on administrative tasks when a required part is not in stock at the time of repair.
R
Repeat Stockout Rate
61% recurrence
Without analytical dashboards, the same part stocks out on the same vehicle class within 6 months of the first incident — because nobody updated the reorder threshold after the event.
Dashboard Tracking Framework
The 8 Metrics Every Fleet Parts Stockout Dashboard Must Display
Real-Time
Current Stock Level vs Minimum Threshold
Not just "how many do we have" but "how many until we hit the reorder point" — displayed as a visual indicator per part, per location, updated every time a part is consumed on a work order.
Why it matters
Stockouts happen when the gap between current stock and minimum threshold is invisible. Visual dashboards with color-coded thresholds reduce stockout incidents by catching the gap before the last unit is consumed.
Predictive
Days-to-Stockout Projection
Based on current consumption rate and open work orders, the dashboard calculates how many days until each tracked part reaches zero — giving purchasing a lead time buffer instead of a surprise.
Why it matters
Supplier lead times for fleet parts average 3–7 business days. A dashboard that only shows current stock — not projected stock — gives managers no operational window to act before the stockout occurs.
Historical
Consumption Rate by Part and Vehicle Class
How fast each part is consumed across the fleet, broken down by vehicle type, age bracket, and operating environment — so reorder quantities are based on data, not on what the last manager ordered.
Why it matters
Static reorder quantities set once and never updated are the primary driver of repeat stockouts. Dynamic consumption tracking automatically adjusts reorder recommendations as fleet composition and usage patterns change.
Operational
Open Work Orders Awaiting Parts
A real-time count of work orders currently blocked by parts unavailability — with vehicle ID, repair type, and estimated downtime cost per day visible at a glance without drilling into individual records.
Why it matters
Fleet managers need to prioritize emergency procurement decisions. Knowing that three work orders are blocked and that two of those vehicles are revenue-generating routes changes the urgency calculation immediately.
Financial
Stockout Cost Accumulator
The running dollar cost of all current and historical stockout events — including direct downtime cost, emergency procurement premium, and mechanic idle time — calculated automatically and reported monthly.
Why it matters
Without a dollar figure, stockouts remain an operations problem rather than a finance conversation. When the analytics dashboard shows $43,000 in annual stockout cost, inventory investment decisions become straightforward to justify.
Supplier
Supplier Lead Time by Part Category
Average fulfillment time from each approved supplier for each part category — so reorder triggers can be set based on actual lead times rather than optimistic assumptions that do not match supplier performance.
Why it matters
A reorder threshold of 5 units might be safe with a 2-day supplier but dangerously low with a 7-day supplier. Lead time data in the dashboard makes this distinction automatic and fleet-specific.
Analytics
Top 10 Stockout Offenders Report
A ranked list of the parts that have caused the most stockout events, the most downtime hours, and the highest emergency procurement spend over any selected time period — exportable for budget planning cycles.
Why it matters
In most fleets, 80% of stockout-related downtime comes from fewer than 15 part numbers. The top-10 report lets managers eliminate the worst offenders with targeted safety stock increases rather than across-the-board inventory expansion.
Preventive
Upcoming PM Parts Demand Forecast
Parts that will be needed for scheduled preventive maintenance in the next 30, 60, and 90 days — calculated from the PM schedule so purchasing can consolidate orders and negotiate volume pricing in advance.
Why it matters
PM stockouts are the most preventable form of downtime because the demand is known in advance. A dashboard that does not connect the PM schedule to parts forecasting is missing the most predictable demand signal available.
OxMaint Analytics Dashboard
All 8 metrics above are live in OxMaint — with automatic reorder alerts and PM demand forecasting built in from day one.
Dashboard Comparison
Reactive Parts Management vs Analytics-Driven Stockout Prevention
Reactive Parts Room
Parts ordered when the last unit is consumed
Reorder quantities set manually, reviewed annually
Stockout discovered when mechanic opens the bin
Emergency procurement at 20–35% premium
PM parts ordered same week the PM is due
Supplier lead times tracked in a separate spreadsheet
Analytics-Driven Dashboard
Reorder alert fires 7–14 days before minimum threshold
Consumption-rate engine adjusts reorder quantities monthly
Dashboard flags projected stockout before any part is consumed
Planned procurement at negotiated pricing on preferred supplier contract
PM parts forecasted 90 days out and ordered in consolidated batches
Lead times tracked per supplier and factored into reorder triggers automatically
Reporting That Drives Decisions
The 4 Analytics Reports That Change How Fleet Managers Budget Parts
01
Monthly Stockout Impact Report
Total downtime hours, downtime cost, emergency procurement spend, and labor idle time attributed to stockouts in the month — compared to the prior 3-month average to show trend direction.
02
Part-Level Consumption vs Forecast Variance
How close the consumption forecast was to actual usage for each tracked part — the core accuracy metric that tells you whether your reorder model needs calibration or is performing reliably.
03
Supplier Performance Scorecard
On-time delivery rate, order accuracy, and lead time consistency per supplier — the data that drives renegotiation conversations and supplier consolidation decisions grounded in operational evidence.
04
Safety Stock Optimization Recommendations
Analytics-generated recommended safety stock levels per part based on consumption rate variability, supplier lead time, and historical stockout frequency — reviewed and adjusted quarterly with one click to apply changes.
Common Questions
Fleet Parts Stockout Dashboard — What Managers Ask Before Switching
How does OxMaint connect parts inventory to active work orders?+
When a mechanic creates or updates a work order in OxMaint, parts used are logged directly against that work order. The inventory module deducts consumed parts in real time, updates current stock levels, and recalculates the days-to-stockout projection automatically.
Try the full workflow free.
Can the dashboard manage parts across multiple shop locations?+
Yes. OxMaint supports multi-location inventory with separate stock levels, reorder thresholds, and supplier assignments per location — while a central analytics view aggregates data across all sites for reporting.
Book a demo to see the multi-site configuration.
How does the PM demand forecast work for parts?+
OxMaint reads the scheduled preventive maintenance calendar, identifies the parts required for each upcoming PM based on the service template, and aggregates demand by part number across the 30, 60, and 90-day horizon. The forecast exports as a purchase recommendation list that purchasing can send directly to suppliers.
Does OxMaint integrate with existing parts suppliers or procurement systems?+
OxMaint supports purchase order creation within the platform and exports parts requests in standard formats compatible with major fleet parts suppliers.
Start a free trial to test the procurement workflow with your current supplier list.
What is the minimum parts catalog size that benefits from analytics dashboards?+
Fleets with as few as 50 tracked part numbers see measurable stockout reduction within the first 90 days of using analytics-driven reorder thresholds. The ROI accelerates with catalog size, but even small fleets managing critical high-turn parts benefit significantly from days-to-stockout projections alone.
OxMaint · Fleet Parts Analytics
Stop Discovering Stockouts at the Bin. Start Preventing Them at the Dashboard.
OxMaint tracks current stock, consumption rates, supplier lead times, and PM demand in one connected analytics layer — so the parts your mechanics need are always available before the work order is written. Setup in 30 minutes. First stockout alert in the first week.