A transportation company in Ohio had a driver who had been with them for nine years without a single formal accident report. What they did not know — because they had no safety scorecard system — was that this driver was averaging 14.3 harsh braking events per 100 miles, 22% over-speed incidents on every shift, and had accumulated six minor incidents in the prior 18 months that were individually below the reporting threshold but collectively painted a clear picture of deteriorating driving behaviour. The accident that finally appeared in the insurance record cost $84,000 in direct costs and triggered a 28% premium increase at renewal. A safety scorecard would have flagged this driver for coaching six months earlier. OxMaint's fleet safety scorecard system tracks every driver's behaviour metrics continuously — harsh braking, acceleration, cornering, speeding, and seat belt compliance — and generates coaching alerts before the behaviour becomes a claim. Book a demo to see your fleet's safety dashboard.
Know Every Driver's Safety Score — Before It Becomes a Claim
Real-time behaviour tracking, automated coaching alerts, and safety dashboards — all in OxMaint
Average cost of a single preventable commercial vehicle accident — plus 28% insurance premium increase at renewal
42%
Accident rate reduction in fleets using active safety scorecards with driver coaching programmes
12%
Typical insurance premium discount for fleets with documented safety scorecard and coaching programmes
The 6 Safety Metrics OxMaint Scores Every Driver On
A driver safety score means nothing unless it measures the right behaviours. OxMaint scores each driver across six proven accident-predictive metrics — sourced from OBD telematics and verified against FMCSA and NHTSA crash causation data. Configure your fleet's safety scorecard thresholds to reflect your routes, vehicle types, and risk tolerance.
1
Harsh Braking Events
Highest accident-predictive metric — NHTSA data
Events per 100 miles above 0.4g deceleration threshold. Drivers averaging more than 8 harsh braking events per 100 miles are 3.1× more likely to be involved in a rear-end collision within 12 months.
2
Speeding Incidents
Speed >10 mph over posted limit — per shift
Percentage of driving time above posted speed limits. Every 1 mph increase above the speed limit raises fatal accident probability by 8%. Drivers above 15% over-speed frequency trigger automatic coaching alerts in OxMaint.
3
Harsh Acceleration
Events above 0.35g threshold — fuel and wear indicator
Aggressive acceleration damages drivetrain components, burns fuel at premium rates, and predicts following-distance management problems. A 30% reduction in harsh acceleration events typically reduces fuel cost by $0.04–$0.07/mi.
4
Cornering Events
Lateral G-force above 0.4g — rollover and tyre risk
High cornering G-forces predict tyre sidewall damage, suspension wear, and — for high-CG vehicles — rollover risk. Most significant for Class 6–8 trucks, bus, and van operations.
5
Seat Belt Compliance
% of trips with seatbelt engaged at ignition
Unbelted drivers are 30× more likely to be ejected in a crash. OxMaint tracks seatbelt engagement at trip start via OBD — non-compliance generates an immediate manager notification, not an end-of-month report.
6
Distraction & Idling
Phone use events + idle time per shift
Excessive idling indicates poor route discipline and predicts distracted driving patterns. AI camera vision can detect phone use during operation — events are timestamped and linked to the driver's safety record automatically.
Safety Analytics — OxMaint
Score Every Driver. Coach the Right Ones. Reduce Claims.
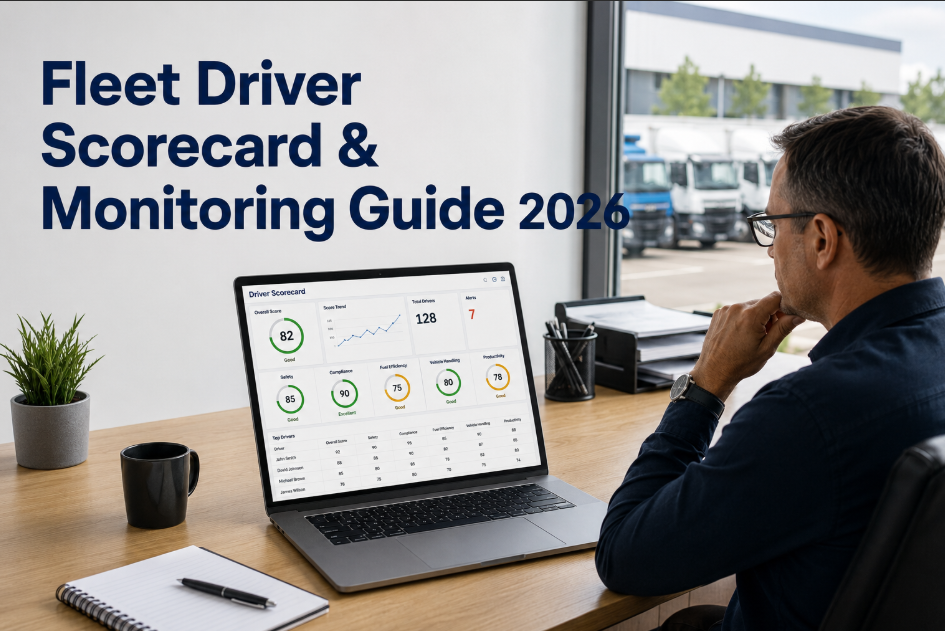
OxMaint safety scorecards give every driver a real-time score and every manager a ranked list of who needs coaching — before the accident shows up on the insurance record.
How the Safety Scorecard Triggers Coaching — From Data to Action
A safety score is only valuable if it triggers a response. OxMaint's coaching workflow connects the score to the conversation — automatically, before the behaviour becomes a pattern that affects insurance. Every driver's coaching history is tracked in OxMaint alongside their safety score trend.
Day 1
Telematics Data Collected
OBD records every harsh braking, speeding, and cornering event per trip — timestamped and linked to driver ID and vehicle automatically
Daily
Score Calculated
OxMaint calculates a rolling 30-day safety score for every driver — updated after each shift, visible to the driver and their manager
Alert
Coaching Trigger Fired
When a score drops below the configured threshold or a specific event frequency exceeds the limit, an automated coaching alert is sent to the manager with the specific events and dates
Action
Coaching Session Logged
Manager conducts coaching conversation — session logged in OxMaint with date, topics covered, and driver acknowledgement. Documented evidence for insurance and HR purposes
Result
Score Trend Monitored
OxMaint tracks score trend post-coaching — escalates to formal disciplinary process if no improvement within 30 days, or recognises top-quartile scores in the fleet leaderboard
Safety Score Benchmarks — Where Does Your Fleet Sit?
Industry-wide safety score benchmarks from FMCSA carrier data and telematics platform aggregates — showing where top-quartile US fleets perform across all six metrics.
Safety Metric
Industry Median
Top Quartile
OxMaint Alert Threshold
Coaching Trigger
Harsh Braking
12.4 / 100 mi
4.8 / 100 mi
>10 / 100 mi
3 consecutive shifts
Speeding Incidents
18% of drive time
4% of drive time
>15% of drive time
2 consecutive shifts
Harsh Acceleration
9.2 / 100 mi
3.1 / 100 mi
>8 / 100 mi
5-event single shift
Cornering Events
6.8 / 100 mi
2.2 / 100 mi
>6 / 100 mi
Sustained over 2 weeks
Seatbelt Compliance
84% of trips
99% of trips
<95% of trips
Any non-compliance event
Overall Safety Score
62 / 100
88 / 100
<70 / 100
Score drops 10+ points
The Insurance Case — Safety Scores That Reduce Your Premium
Commercial vehicle insurers now price fleets on safety programme quality, not just claims history. OxMaint's safety documentation is exactly what underwriters ask for at renewal — and what defence attorneys need when a claim goes to litigation.
Premium Discount
Documented safety programme
Typical discount range
8–15%
Required documentation
Scorecard records + coaching logs
Annual saving (50-vehicle fleet)
$18,000–$42,000
OxMaint generates
In 15 min
Claims Reduction
Active coaching programme
Accident rate reduction
38–52%
Average claim value saved
$84,000 per incident
Time to measurable improvement
60–90 days of coaching
ROI on safety programme
12–28×
Litigation Defence
Documentation that protects the company
OxMaint evidence produced
Timestamped safety scores
Coaching records
Dated, signed, issue-specific
Telematics data
Event log per driver per trip
Negligent entrustment defence
Fully documented
In our first year with OxMaint safety scorecards we went from 11 recordable incidents to 4. Our insurer gave us a 12% premium discount at renewal because we could show them 12 months of documented coaching sessions and score improvement trends. The premium saving alone covered the cost of the system twice over.
— VP of Safety, 280-vehicle LTL Fleet, Atlanta GA, OxMaint customer
Frequently Asked Questions
What telematics hardware does OxMaint safety scoring require?
OxMaint integrates with major telematics platforms including Samsara, Geotab, Verizon Connect, and Motive via API — if your fleet already has telematics, safety scoring activates within days without additional hardware.
Can drivers see their own safety scores in OxMaint?
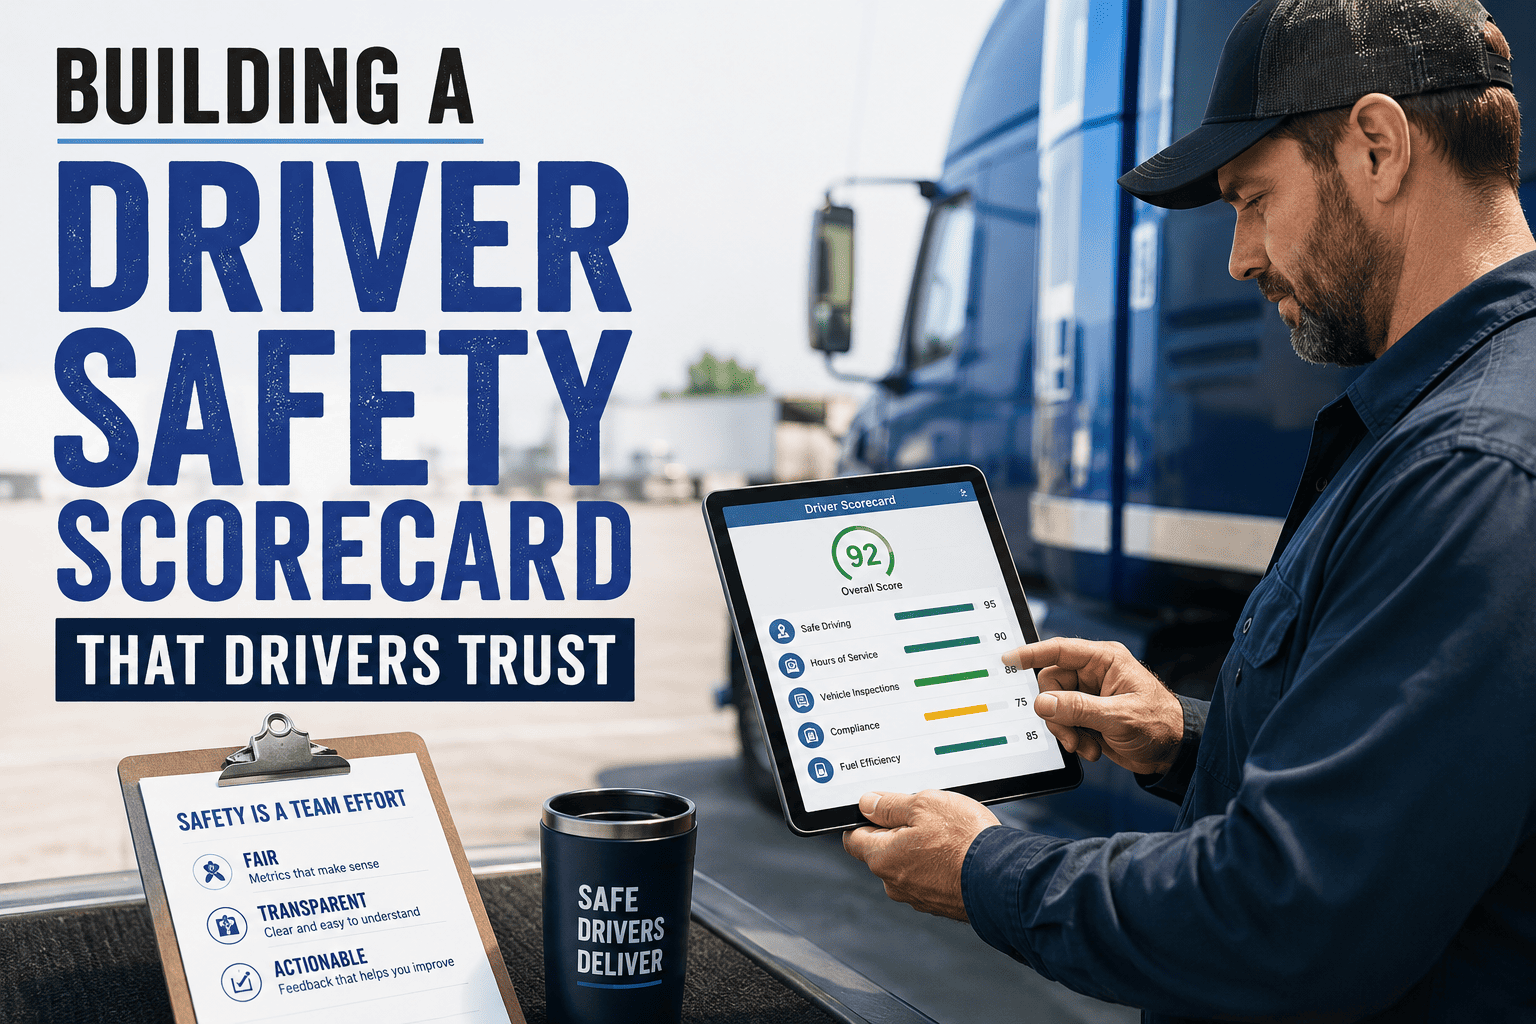
Yes — OxMaint includes a driver-facing app that shows each driver their current score, weekly trend, and specific events that affected their score. Transparent scoring is the single most effective behaviour change lever.
How does OxMaint document coaching sessions for insurance and legal purposes?
Coaching sessions are logged in OxMaint with date, manager ID, driver ID, specific events discussed, and driver acknowledgement — exportable as a signed record in under 2 minutes for any compliance or legal need.
What is a good overall safety score target for a commercial fleet?
Top-quartile US commercial fleets maintain fleet average scores of 85–92 out of 100. A score below 70 on any individual driver warrants immediate coaching intervention. Fleet-wide averages below 75 indicate a systemic programme gap.
How quickly do safety scores improve after starting a coaching programme?
Most fleets see measurable individual score improvement within 30–45 days of the first coaching session. Fleet-wide accident rate reductions typically materialise within 90–180 days as coaching becomes consistent.



.png)