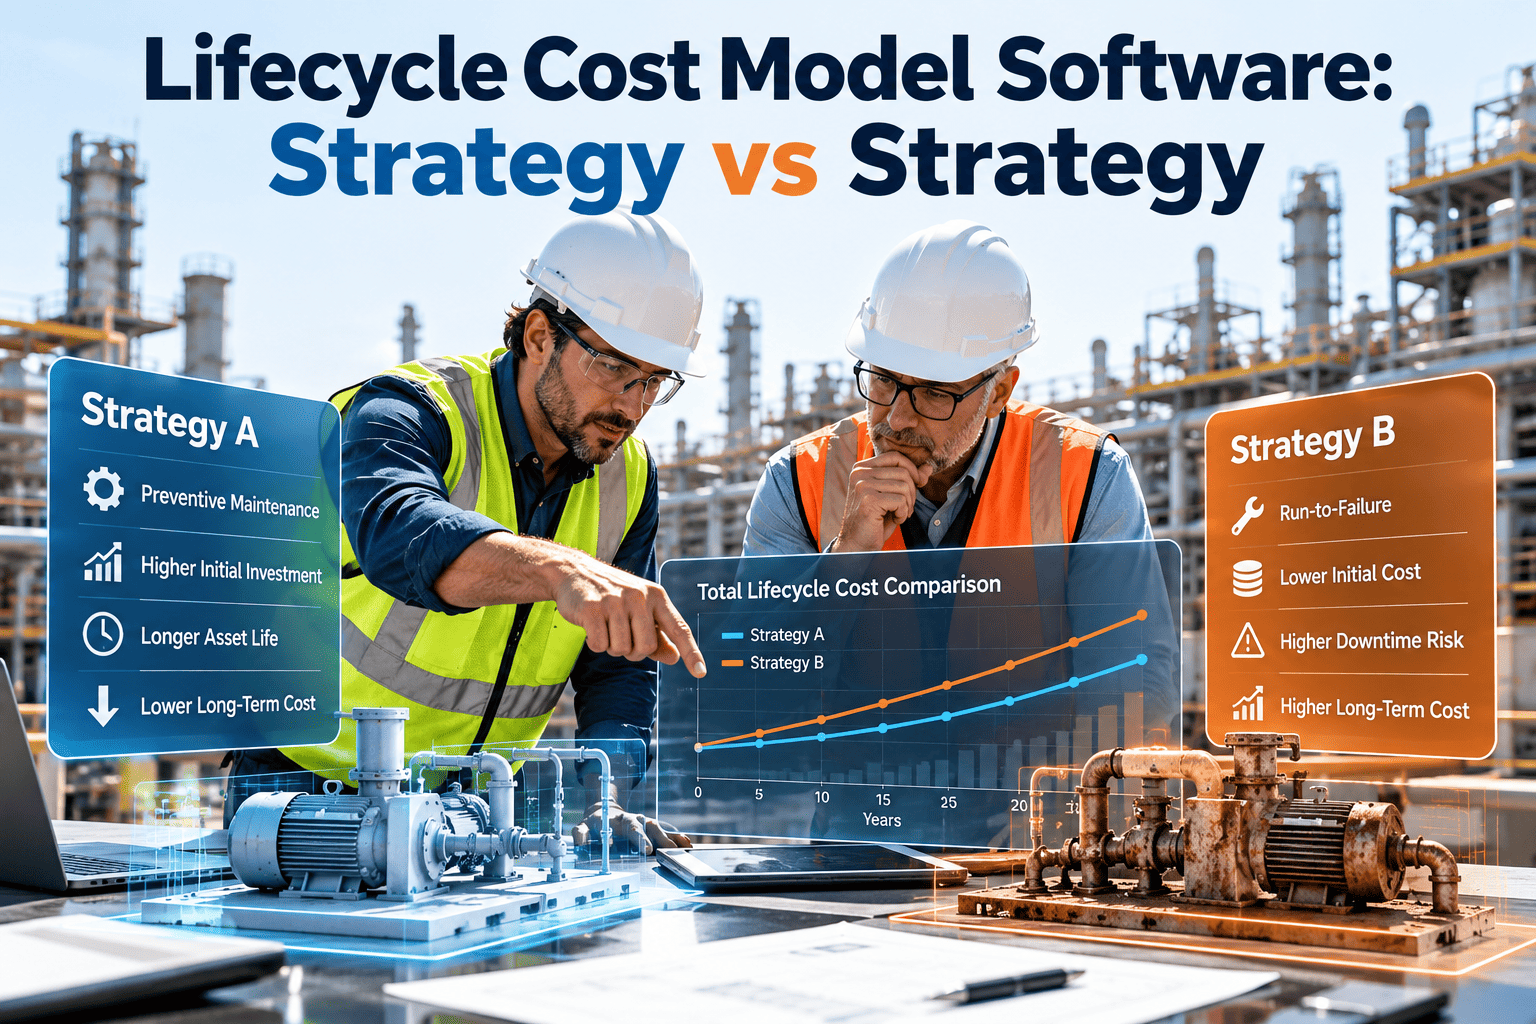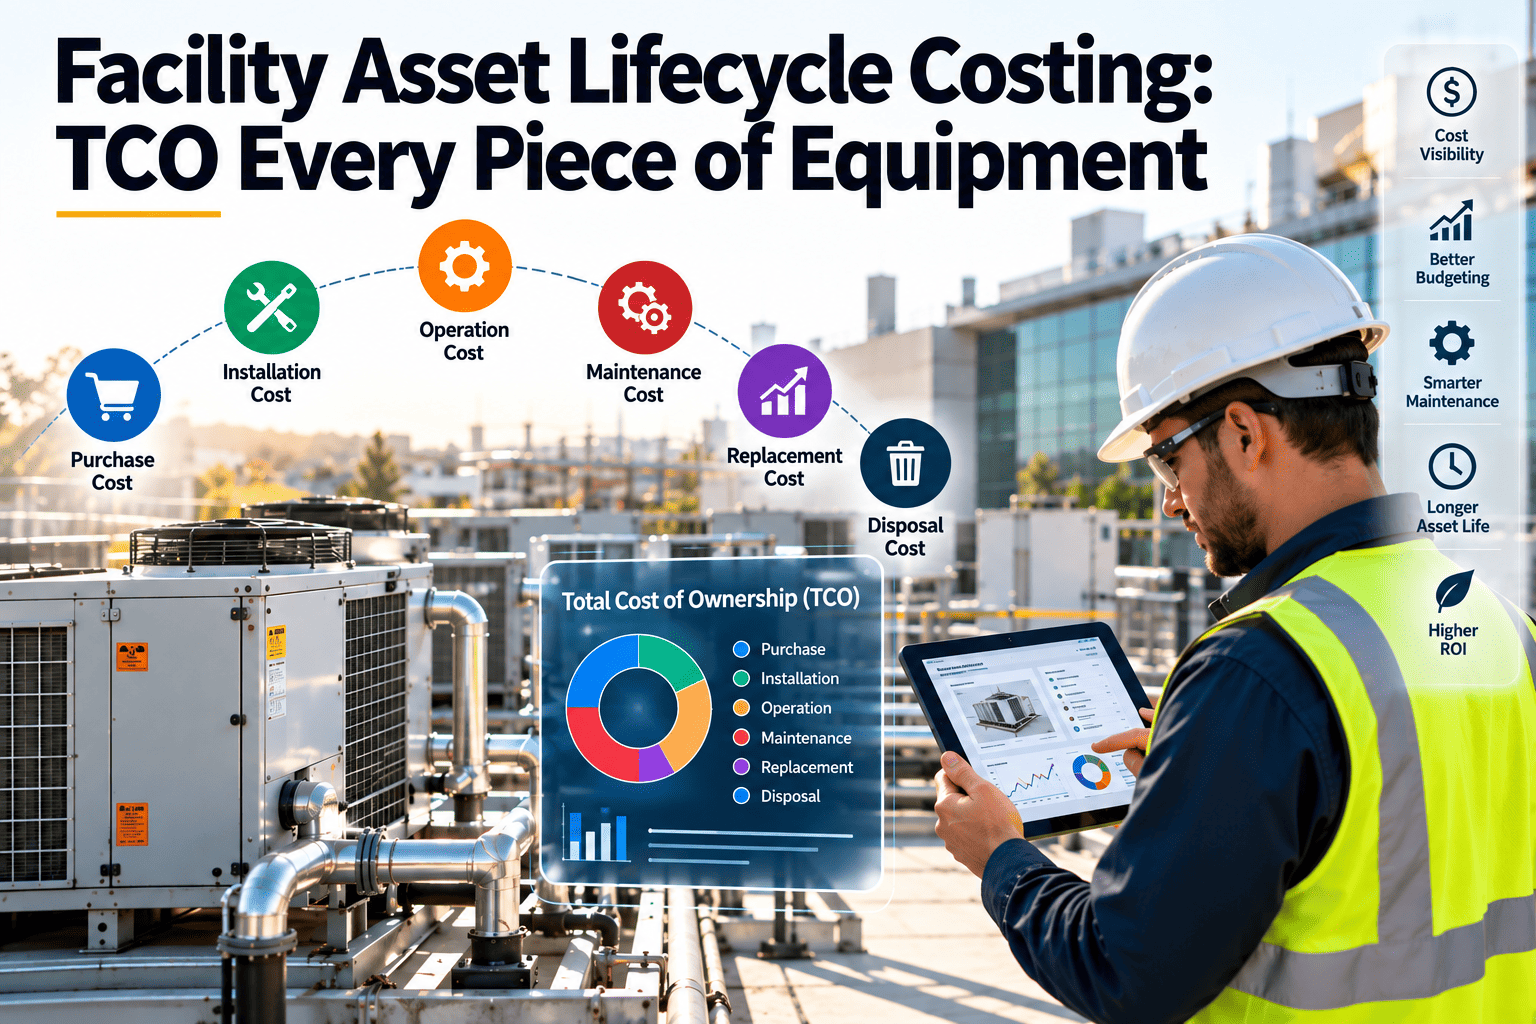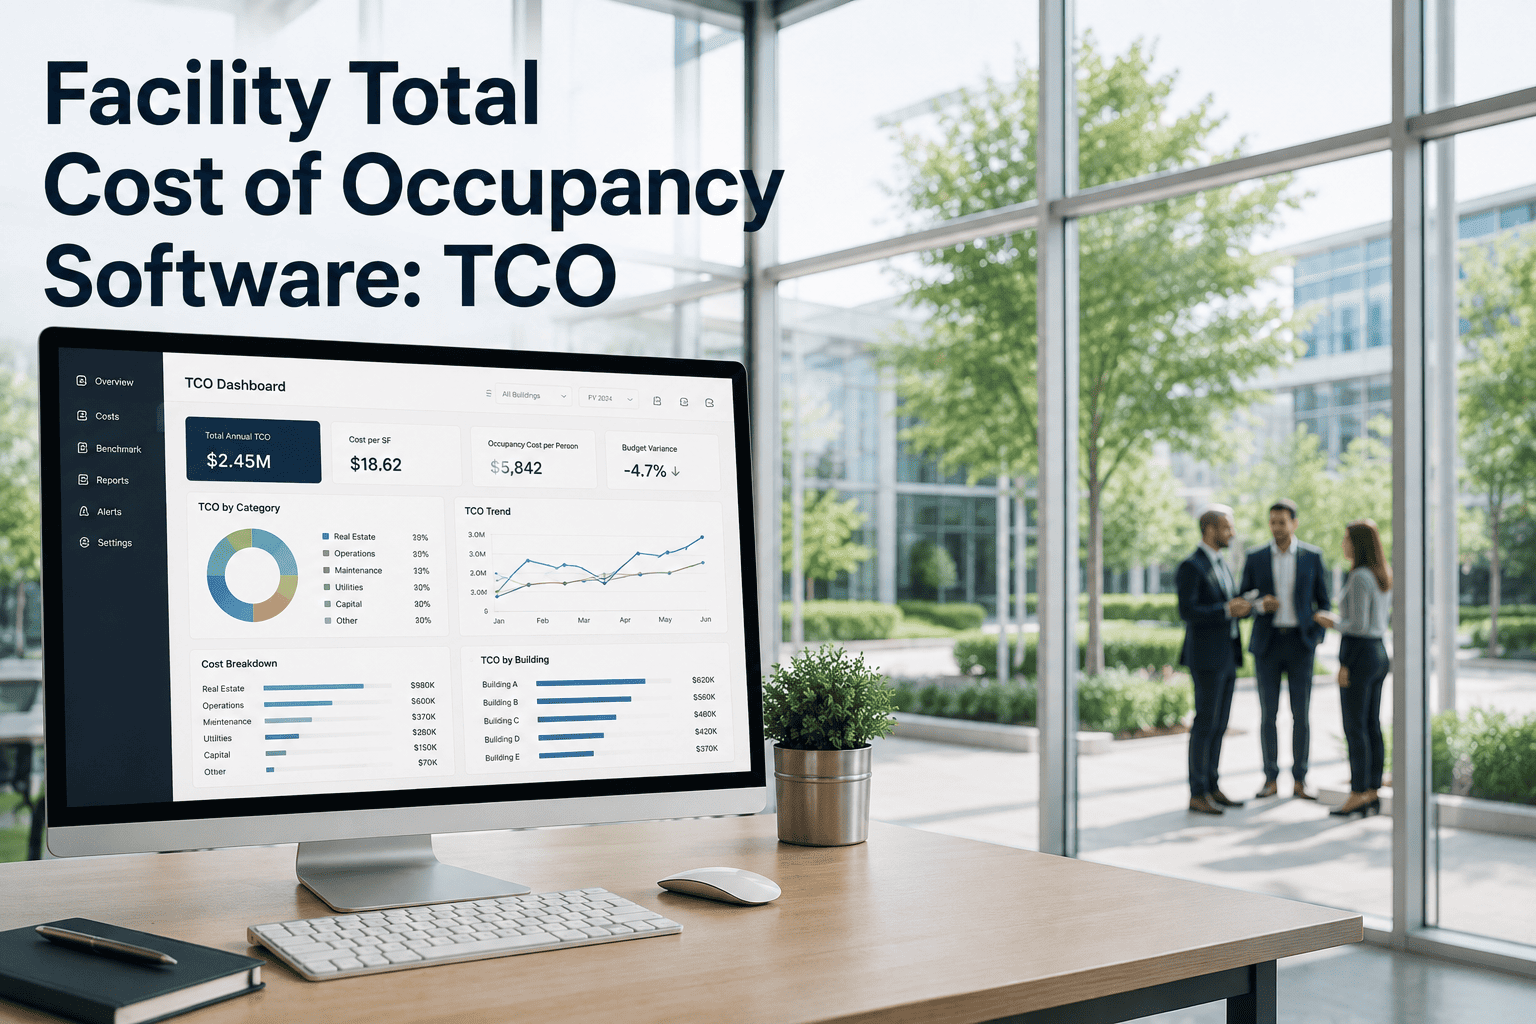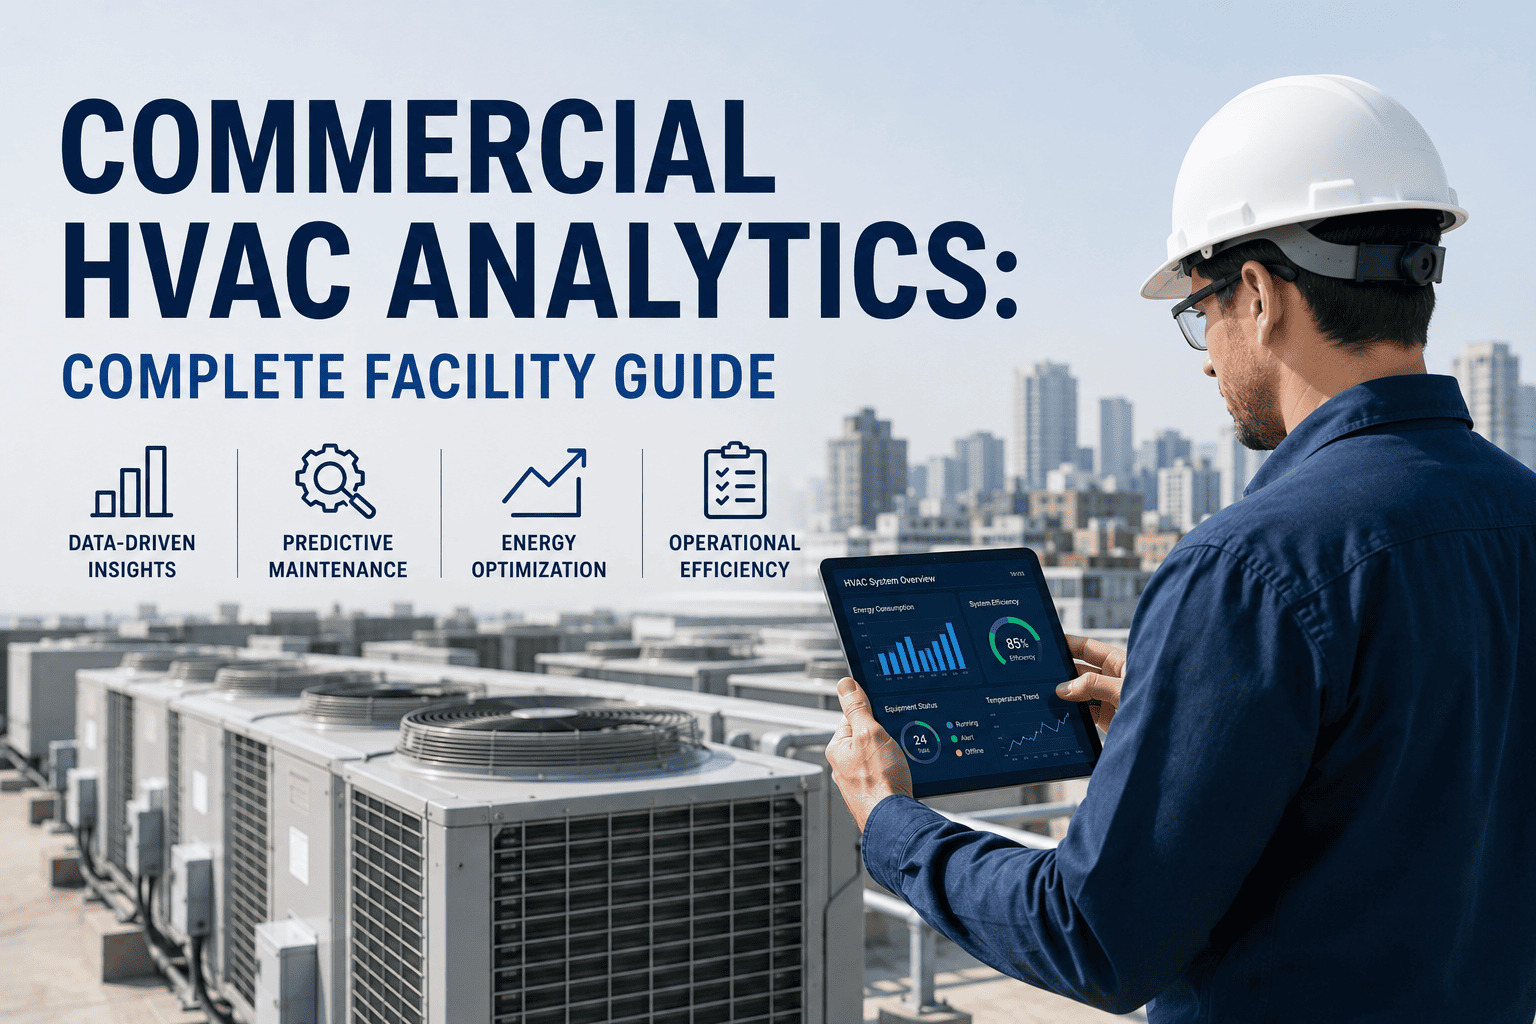
An HVAC purchase is usually decided on the price of the equipment. Yet over twenty years, the machine itself is often the smaller part of what it costs the building. Energy runs every hour it operates, maintenance and repairs build up as it ages, refrigerant and controls need attention, and a replacement decision eventually arrives. Total cost of ownership puts all of those costs on one page so the cheapest option on delivery day is not mistaken for the cheapest over its life. This guide lays out the cost buckets, a 20-year model, and how Oxmaint maintenance software supplies the maintenance data the model needs.
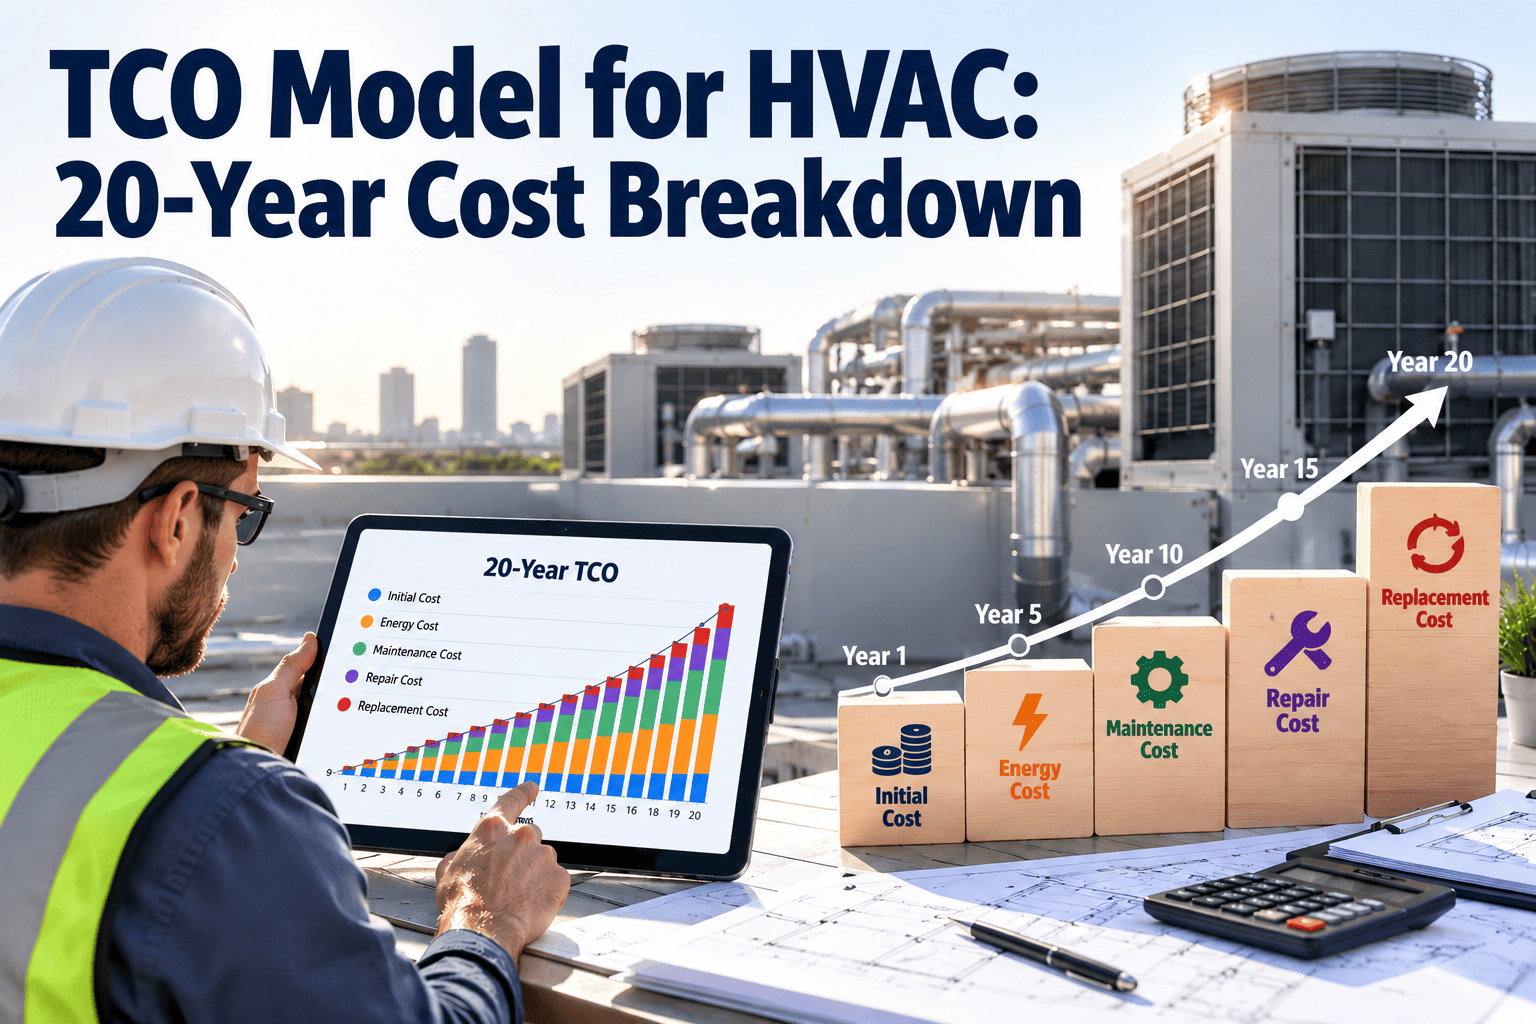
TCO Model for HVAC: 20-Year Cost Breakdown
See every cost bucket behind an HVAC system, from energy to replacement. Build a model that compares options on what they really cost to own.
Bar segments show categories, not exact shares. Shares vary with climate, runtime, energy prices, and maintenance practice.Why first cost misleads
Comparing bids on price alone optimizes the smallest and most visible slice. The larger costs arrive later, spread across years, and rarely appear in the purchase decision.
First-cost thinking
- Compares purchase and installation prices
- Treats maintenance as a separate, later problem
- Ignores efficiency differences between bids
- Leaves controls and refrigerant out of scope
- Replacement is someone else's decision
- Rewards the lowest bid
Lifecycle thinking
- Adds energy, maintenance, repair, and replacement over the study period
- Prices upkeep into the comparison
- Values efficiency differences over years of runtime
- Includes controls, refrigerant, and major component costs
- Plans end of life from the start
- Rewards the lowest total cost
The eight cost buckets in an HVAC TCO model
Each bucket needs a clear definition and a data source, or the model turns into guesswork.
| Bucket | What it includes | How to estimate | Data source |
|---|---|---|---|
| Purchase and installation | Equipment, rigging, installation, commissioning, permits | Quotes and installed-cost history | Bids and project records |
| Energy | Electricity, gas, water, and demand charges over runtime | Load profile × efficiency × rate with escalation | Meter data, equipment ratings, utility tariffs |
| Preventive maintenance | Scheduled inspections, filters, belts, cleaning, tuning | Task list × frequency × labor and parts | PM schedules and work orders |
| Repairs and corrective work | Unplanned repairs, call-outs, replacement parts | Failure history by equipment type, rising with age | Work order history and service records |
| Refrigerant and compliance | Charges, leak checks, recovery, regulatory changes | Charge size, leak history, and expected rules | Equipment records and compliance logs |
| Controls and software | Sensors, controllers, network, upgrades, and licences | Refresh cycle and support costs | Controls inventory and vendor quotes |
| Downtime and disruption | Tenant impact, lost use, emergency premiums | Outage frequency × duration × cost per hour | Outage logs and service agreements |
| End of life | Removal, disposal, refrigerant recovery, salvage value | Removal quotes less any residual value | Contractor quotes and disposal records |
An illustrative 20-year cost split
Published guidance varies, and some sources put upfront cost anywhere from a very small share to around a fifth of 20-year spend, with energy as the largest bucket. The split below only shows how a typical model might look. Replace it with your own numbers.
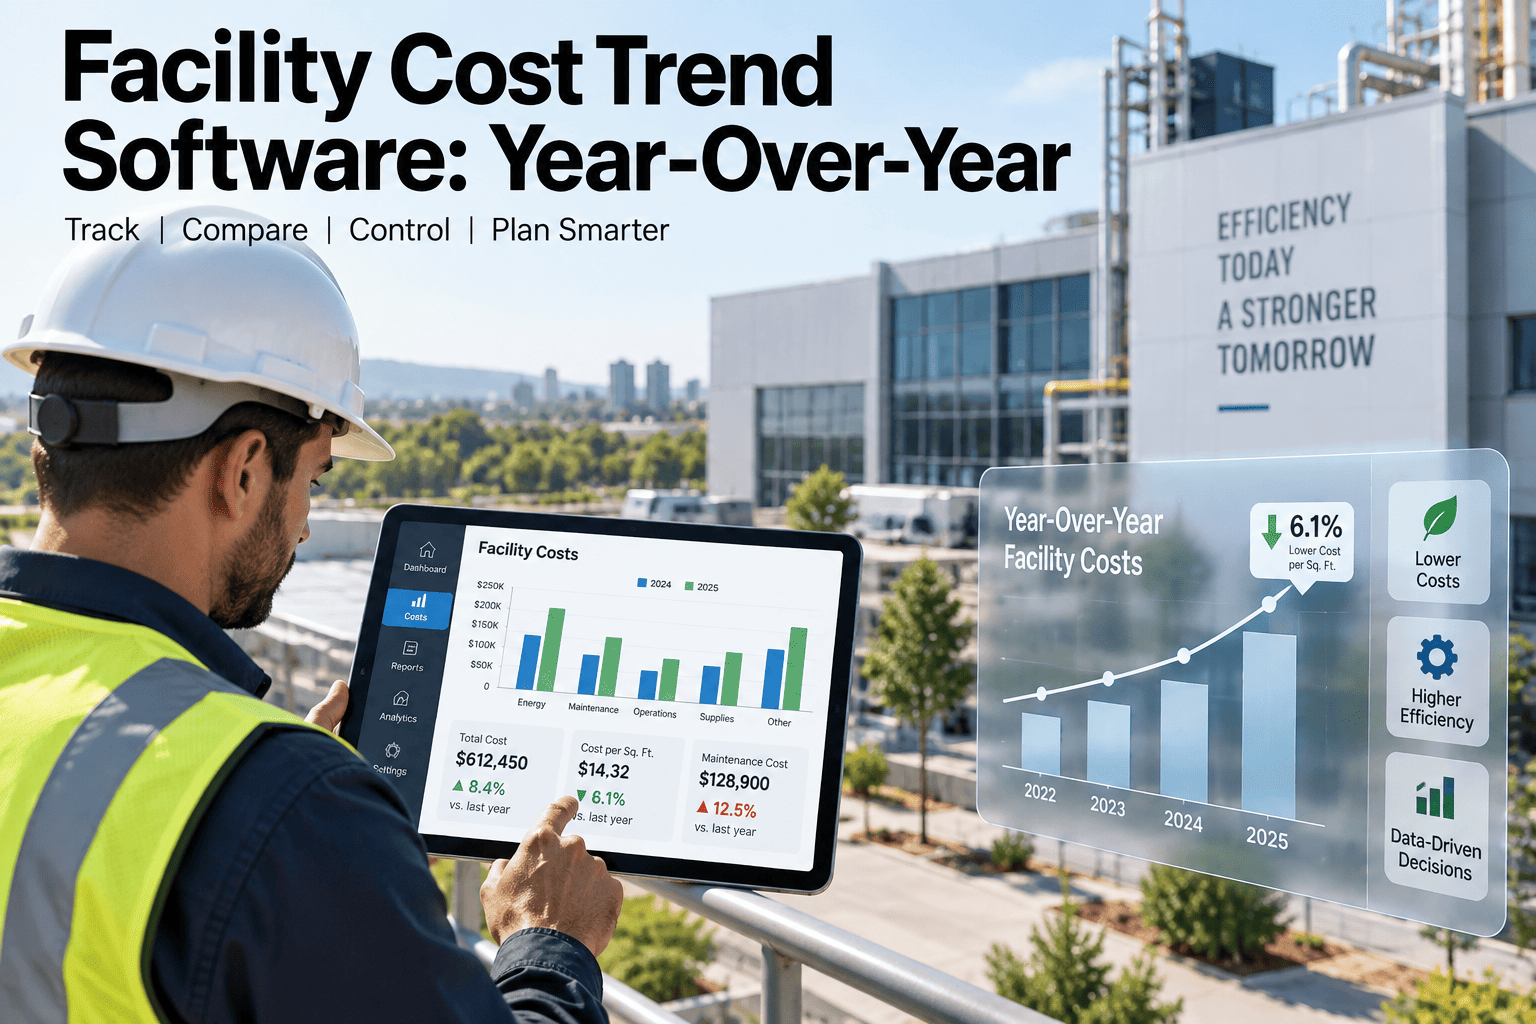
How costs change over twenty years
Costs are not flat. Maintenance and repair usually climb as equipment ages, while efficiency may slowly decline. Plan each phase differently.
Building the model: a step-by-step method
A good model is transparent. Anyone should be able to change an input and see the result.
Set the study period and discount rate
Use the expected service life or 20 years, and agree a discount rate with finance.Define the options
Compare like with like: capacity, efficiency, controls, and warranty for each option.Estimate each bucket by year
Use meter data, maintenance history, quotes, and manufacturer guidance, and state energy price escalation.Convert to present value
Discount each year's cost so future dollars are comparable with today's.Test the sensitivity
Change energy price, runtime, and repair growth to see which assumptions swing the result.A quick present value illustration
Equipment types age differently
Service life reference values differ by source and by maintenance quality. Use the ASHRAE service life and maintenance cost database as a starting reference, then adjust for your own history.
| Equipment | Commonly cited service life | What often drives late-life cost |
|---|---|---|
| Centrifugal chillers | About 20 to 25 years | Compressor work, refrigerant handling, tube fouling, and efficiency loss |
| Hot water boilers | About 20 to 25 years | Heat exchanger condition, burners, and controls |
| Rooftop units | About 15 to 20 years | Compressors, coils, corrosion, and economizer faults |
| Air handling units | About 20 years | Coils, fan motors, belts, and damper actuators |
| Cooling towers | About 20 years | Basin and fill condition, fans, and water treatment |
| Split systems | About 12 to 15 years | Compressor cost relative to the price of a new unit |
Comparing two options in the model
Set both options up with the same buckets and period. The structure below shows where the difference usually hides. Fill the cells with your own estimates.
| Bucket | Option A: lower first cost | Option B: higher efficiency and better controls | What decides the winner |
|---|---|---|---|
| Purchase and installation | Lower | Higher | The gap that must be recovered over time |
| Energy | Higher per year at the same load | Lower per year at the same load | Runtime hours, utility rates, and part-load behavior |
| Maintenance and repair | Depends on build quality and access | Depends on complexity and service support | History from similar equipment and supplier service terms |
| Controls and software | Basic, may need earlier upgrade | Advanced, may need licences and support | Refresh cycle and who maintains the controls |
| Downtime risk | Depends on redundancy and parts supply | Depends on diagnostics and warranty | Cost per hour of outage in your building |
| End of life | Similar | Similar, with possible salvage differences | Removal and refrigerant recovery quotes |
What drives the energy bucket
Energy is usually the largest slice, so small changes in assumptions move the total more than any other input.
- Runtime hours: schedules, occupancy, and whether equipment runs after hours.
- Load profile: how much of the year equipment runs at part load rather than design load.
- Efficiency: rated and measured, including degradation from fouling, drift, and wear.
- Controls: setpoints, resets, staging, and economizer behavior.
- Rates: energy price, demand charges, and expected escalation.
- Building envelope and use: changes in occupancy, equipment loads, or tenant mix.
Data to collect before you build the model
- Sub-metered or estimated energy data for each major system.
- Equipment nameplate data, installation date, and warranty terms.
- Preventive maintenance task lists, frequencies, and actual costs.
- Corrective work order history, with causes and repeat repairs.
- Refrigerant type, charge, and leak history.
- Outage records with duration and impact on tenants.
- Utility bills and tariff details, including demand charges.
Feed your TCO model with real maintenance data
Keep every HVAC asset, repair, and cost in one record so lifecycle models rest on evidence.
Maintenance strategy changes the TCO
Two identical machines can have very different lifetime costs depending on how they are maintained.
Reactive approach
- Repairs after failure at emergency rates
- Efficiency declines unnoticed as coils foul and sensors drift
- Secondary damage from run-to-failure
- Shorter service life
- Higher downtime and complaint volume
Planned and condition-based approach
- Scheduled inspections and cleaning
- Efficiency tracked against commissioning baseline
- Problems found before they cause damage
- Service life more likely to reach or exceed typical values
- Lower downtime and more predictable cost
Repair, retrofit, or replace: signals to act on
TCO is not only for purchasing. Run it again on aging equipment, using cumulative repair cost and efficiency trends.
- A single repair quote approaches or exceeds about half of the replacement cost.
- The equipment is past typical service life and repair frequency is rising.
- Several repairs on the same failure mode appear within a short period.
- Measured efficiency has fallen noticeably from the commissioning baseline.
- Refrigerant rules or parts availability make continued repair costly.
- A retrofit, such as variable speed drives or improved controls, recovers its cost within a defined period.
- Tenant complaints or outages linked to the unit are rising, and the cost of disruption is now visible in your records.
- The remaining life is long enough to spread a replacement over many years of lower energy and repair spend.
Common TCO modeling mistakes
Most models fail on assumptions, not arithmetic.
- Using nameplate efficiency as real efficiencyUse measured performance and part-load behavior where available.
- Assuming flat maintenance cost for 20 yearsModel rising repair cost with age, based on your own history.
- Ignoring energy price escalation and demand chargesState the escalation rate and tariff assumptions openly.
- Leaving out downtime costInclude outage cost where it affects tenants or operations.
- Comparing options with different scopeAlign capacity, controls, and warranty before comparing totals.
- Never updating the modelCompare actual costs each year and revise the forecast.
How Oxmaint supports HVAC lifecycle costing
The energy and purchase buckets come from other systems. The maintenance and repair buckets, and the evidence for replacement decisions, come from maintenance records.
Asset register with installation data
Record each unit's age, capacity, location, and warranty so age and remaining life are visible.Cumulative cost per asset
Track labor, parts, and contractor spend through the life of each unit.Preventive maintenance schedules
Plan inspections, filter changes, coil cleaning, and refrigerant checks with recorded results.Corrective work history
Use failure causes and repeat repairs to calibrate repair cost growth in the model.Inspections and compliance records
Keep refrigerant and safety records attached to the asset.Reports and dashboards
Rank units by age, repair cost, and backlog to support capital planning.KPIs for lifecycle cost management
Track the inputs that drive the model so forecasts improve every year.
Cumulative maintenance cost per unit
Total labor, parts, and contractor cost since installation, by assetRepair cost against replacement cost
Rolling repair spend divided by estimated replacement costEnergy use per unit of output
Measured consumption compared with the commissioning baselinePlanned work share
Planned work orders divided by all work orders on HVAC assetsRepeat repair rate
Repeat failures on the same unit and cause divided by total failuresForecast accuracy
Actual annual cost divided by modelled annual costHVAC TCO model FAQs
What share of 20-year HVAC cost is energy?
Energy is usually the largest bucket, but the share depends on climate, runtime, and rates. Use your own meter data rather than a generic percentage.
Which discount rate should we use?
Agree one with your finance team and apply it to every option. Show how the result changes at higher and lower rates.
How do we model maintenance cost growth?
Use your own repair history by equipment type, with costs rising as units age. Book a demo to see how history is captured.
When does replacement beat repair?
Run the model when repairs approach about half of replacement cost, repair frequency rises, or efficiency drops. Compare cumulative cost, not one invoice.
How does Oxmaint help?
It records age, cost history, preventive maintenance, and failures per HVAC asset, so models use real data. Sign up free to build your asset records.
Know what every HVAC unit really costs to own
Give your facility team one record of assets, repairs, and costs so lifecycle decisions rest on evidence.