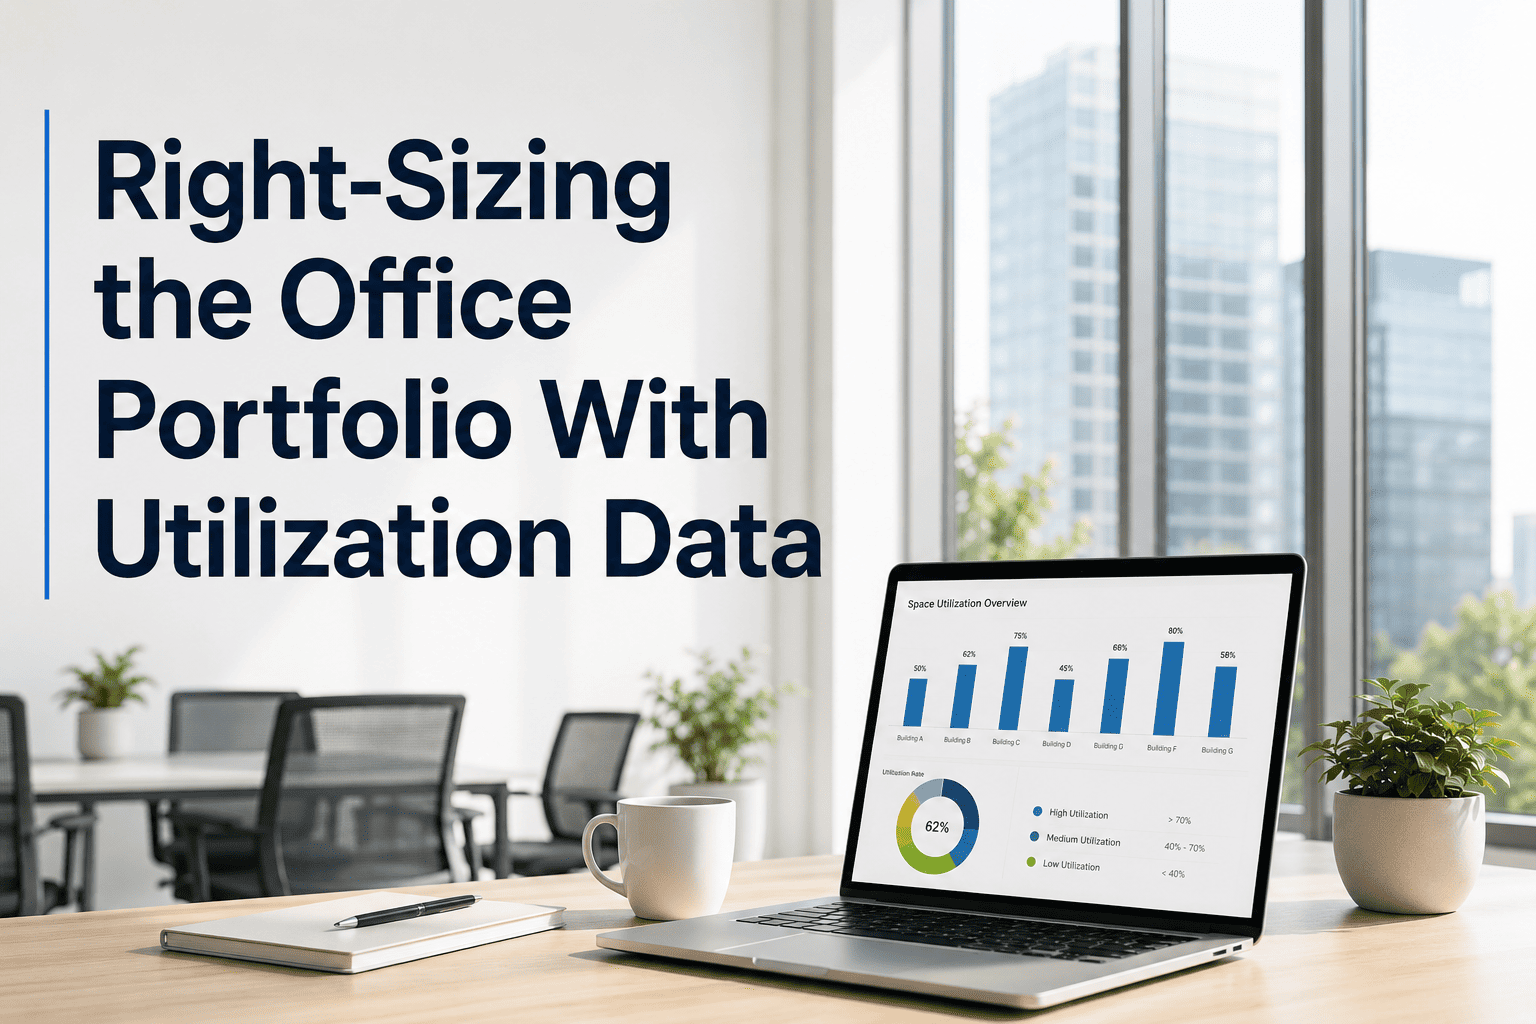
Right-sizing the office portfolio with utilization data is the single largest facilities-driven cost decision most organizations face this decade — hybrid work has left 30–50% of leased space sitting empty while real estate, energy and maintenance costs keep compounding. Office portfolio optimization turns that stranded square footage into recovered capital, but only when it is driven by hard utilization data rather than gut feel. This guide breaks down the methodology for workplace right-sizing in a hybrid world: how to measure true portfolio utilization, how to plan office space consolidation, and how to turn the findings into a board-defensible reduction strategy. If you want to put the same data engine behind your assets and maintenance operations, you can Start Free Trial of OxMaint and see the utilization analytics live on your own portfolio.
How much empty office space are you still paying to maintain?
Hybrid work quietly stranded 30–50% of the typical office portfolio — space that still draws rent, HVAC, cleaning and maintenance spend every month. Right-sizing the workplace with utilization data converts that drag into recovered capital and a leaner, defensible footprint.
A 500-seat floor averaging 180 daily occupants is carrying $1.2M–$2.4M in avoidable annual occupancy cost. Utilization data tells you exactly how much to cut — and where.
Why hybrid office portfolios are over-sized by design
Pre-2020 portfolios were leased for 4.5–5 days of full occupancy. Hybrid schedules of 2–3 in-office days structurally cap peak utilization at 40–60%, yet rent, utilities, cleaning and reactive maintenance budgets still cover 100% of the footprint.
Benchmark utilization for hybrid offices at daily peak — half the floor is vacant while operating costs run at full capacity.
Fully-loaded cost to maintain unused space — rent, energy, janitorial, security and reactive maintenance for ghost floors.
Typical right-sizing target after a utilization study — translating to millions in annual occupancy cost recovered.
Time for consolidation savings to fully offset move, construction and technology costs when executed against hard data.
How to measure true office portfolio utilization data
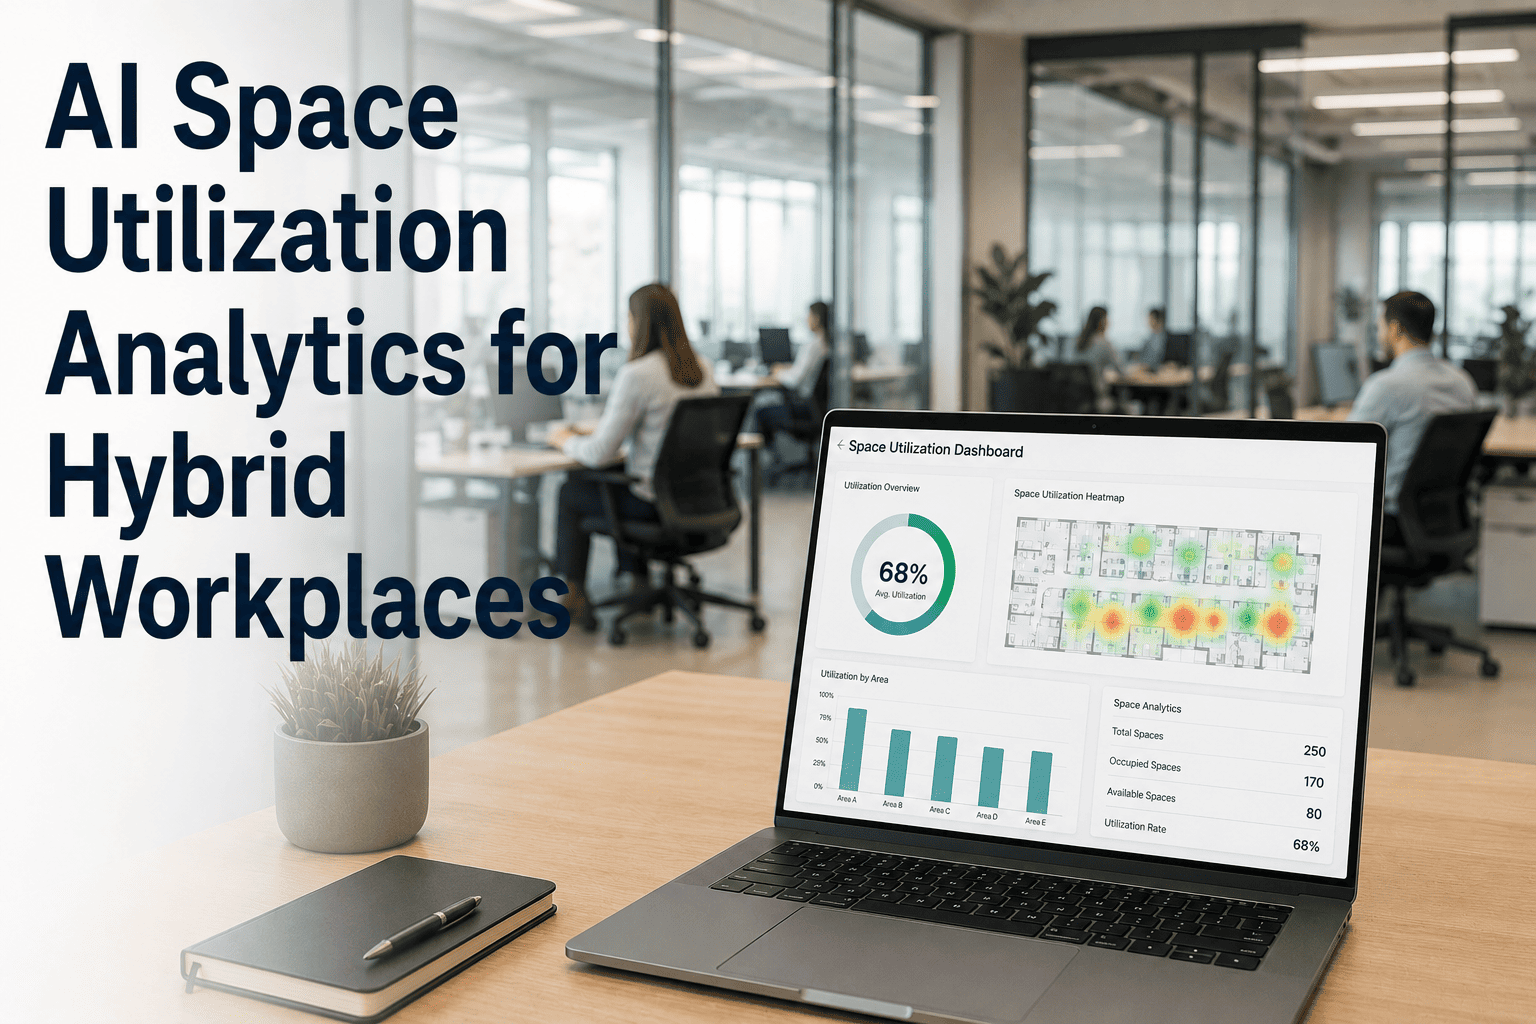
Right-sizing decisions are only as defensible as the data beneath them. A board-grade utilization study layers three measurement streams to produce a single, confidence-weighted utilization rate for every floor, building and metro in the portfolio.
Badge & access-system data
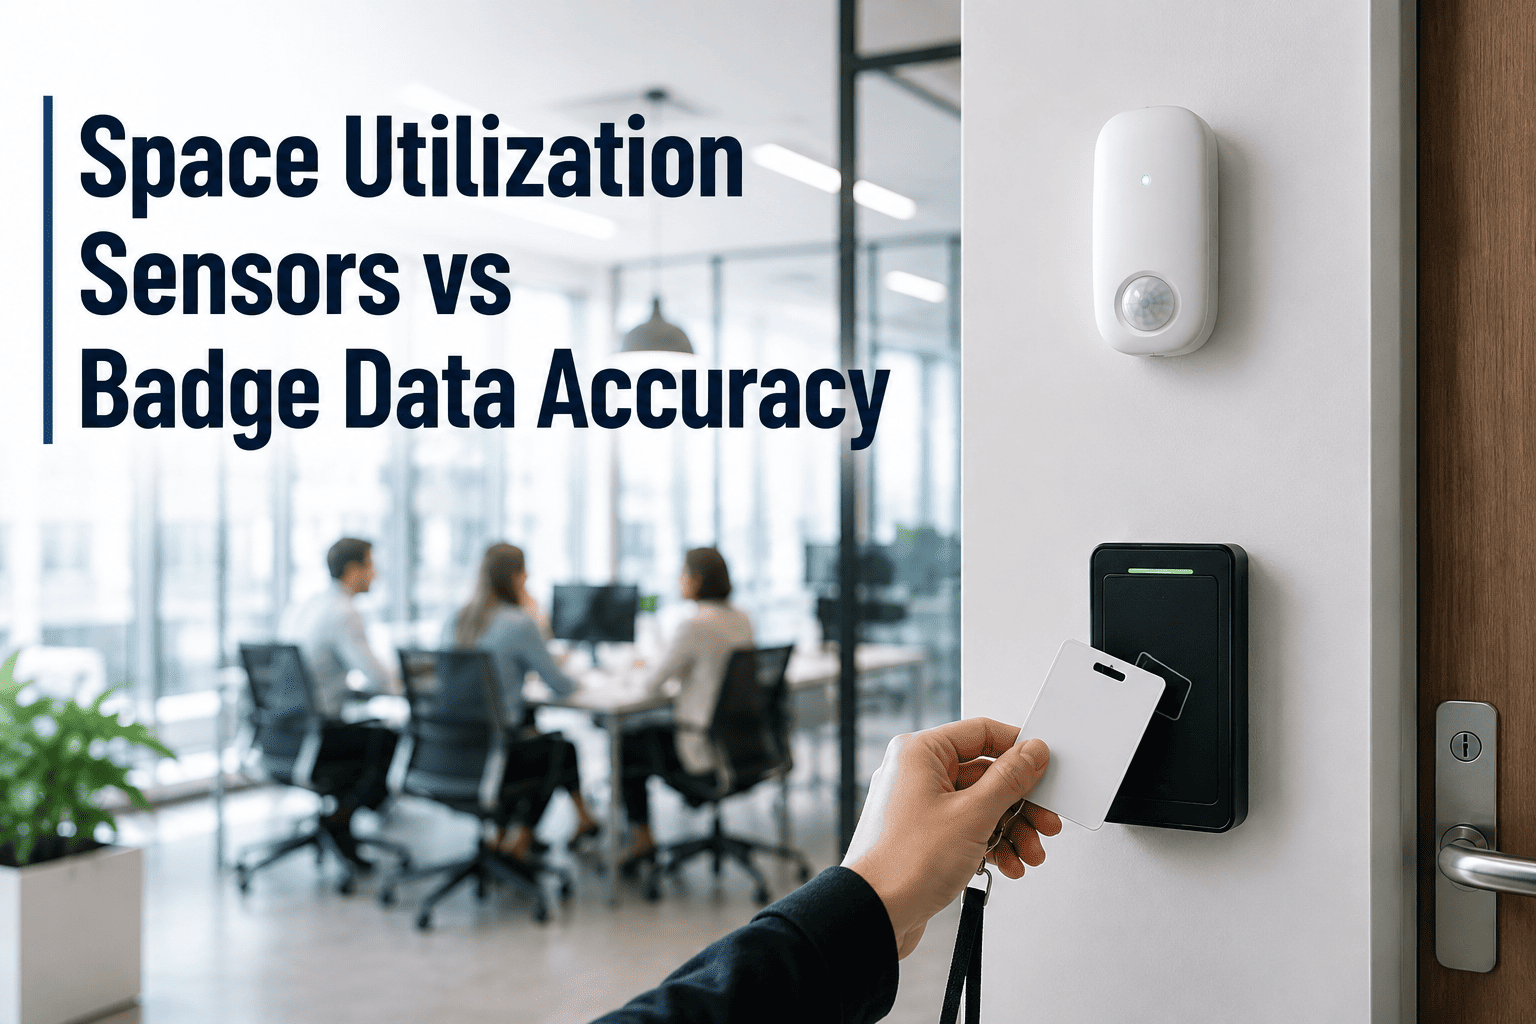
Tap-in counts from physical access control produce the backbone occupancy stream. It is the lowest-cost data source and covers 100% of the portfolio, but it misses tailgating, visitors and internal floor movement. Use it as the utilization floor, not the ceiling.
Wi-Fi & network endpoint density
Counting connected devices per floor per hour reveals true inter-floor migration and dwell time that badge data cannot see. Wi-Fi density correlates with actual work activity (not just entry), making it the strongest signal for space-type utilization — desks vs. collaboration zones vs. quiet rooms.
Sensor & booking-system validation
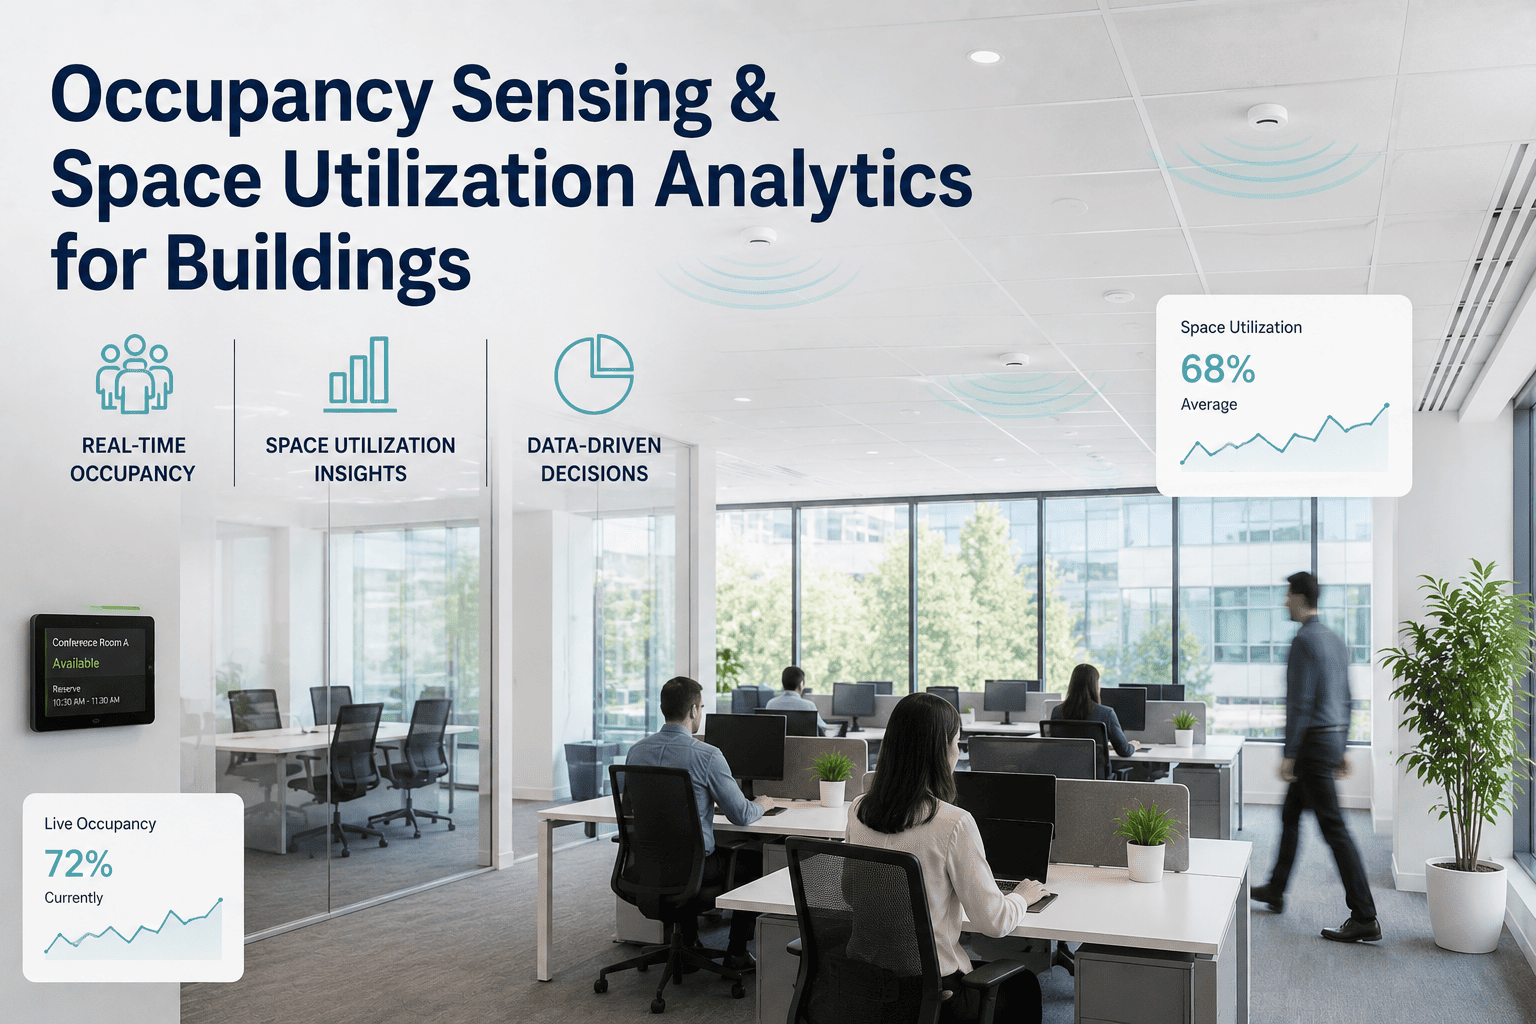
Desk and meeting-room sensors plus reservations data validate the other two streams and catch phantom bookings — reserved-but-unused rooms that inflate apparent demand. Triangulating all three gives a confidence-weighted utilization rate accurate to ±3%.
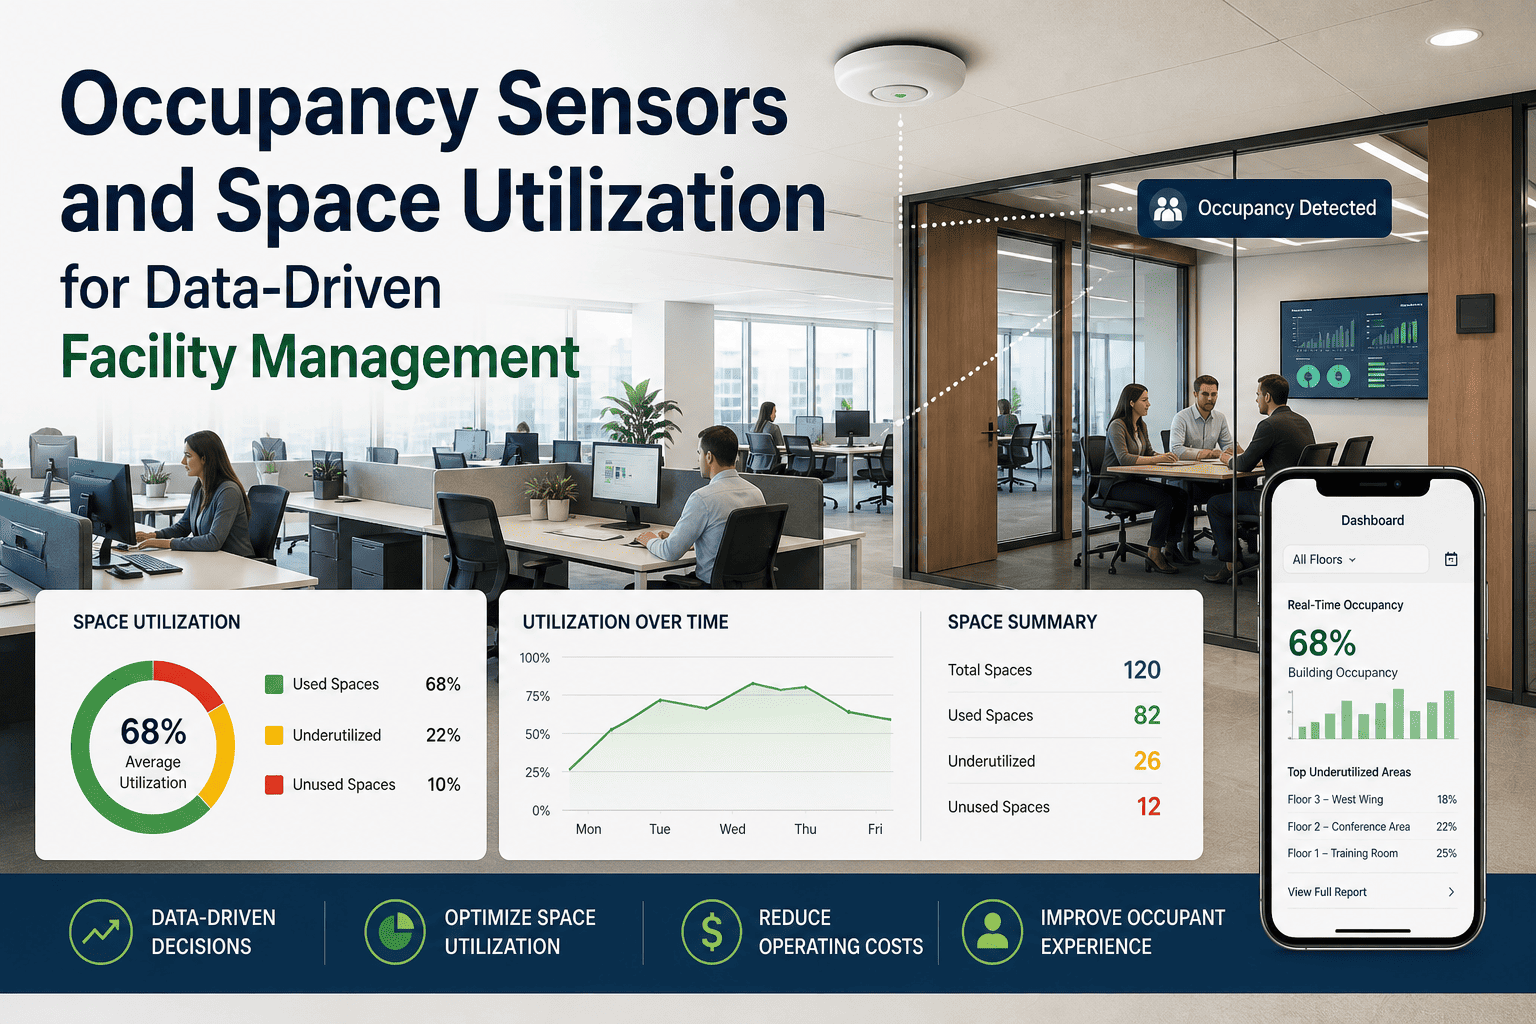
A floor provisioned for 500 seats that peaks at 210 occupants scores 42% utilization. Sustained below 55% for 90+ days, that floor is a primary right-sizing candidate. Track at floor, building and metro level — portfolio averages hide the worst offenders.
A step-by-step timeline for office space consolidation
Portfolio consolidation fails when teams skip straight to lease exits without a data baseline. This 6-month phased approach — modeled on a 1.2M-sq-ft, 8-building portfolio — turns utilization data into a sequenced reduction plan the CFO can underwrite.
Baseline measurement & data fusion
Deploy badge, Wi-Fi and sensor data collection across every floor. Fuse into a single dashboard. Target: a confidence-weighted utilization rate for 100% of the portfolio, refreshed daily. Example output: 3 of 8 buildings running below 35% peak utilization.
Rightsizing modeling & scenario testing
Model three scenarios: 15%, 25% and 35% footprint reduction. Stress-test each against peak-day demand, team adjacencies and lease-break costs. Pick the scenario that holds a 1.4× peak utilization buffer so consolidation never creates overcrowding.
Business case & executive sign-off
Convert the model into a board deck: annual savings, one-time exit/fit-out costs, payback period and risk register. Example: a 28% reduction on 1.2M sq ft yields $4.2M annual savings against $2.1M in exit and consolidation costs — a 6-month payback.
Phased consolidation & asset migration
Execute floor-by-floor: migrate teams, decommission vacated floors, retire or relocate building systems and tracked assets. Tie every moved asset — HVAC units, gensets, kitchen equipment — into the maintenance system so preventive schedules follow the asset, not the room.
A 1.2M-sq-ft portfolio: before and after right-sizing
Consider a professional-services firm with 8 buildings totaling 1.2M sq ft across three metros. After 90 days of fused utilization data, leadership confirmed what badge-only reporting had only hinted at: the portfolio was carrying over 400,000 sq ft of consistently empty space.
| Metric | Before Right-Sizing | After Right-Sizing | Impact |
|---|---|---|---|
| Portfolio size | 1,200,000 sq ft | 864,000 sq ft | −28% footprint |
| Average peak utilization | 38% | 61% | +23 pts |
| Annual occupancy cost | $18.4M | $13.2M | −$5.2M / year |
| Maintenance & energy (vacant space) | $1.7M | $0.4M | −$1.3M / year |
| One-time consolidation cost | — | $2.6M | 5-month payback |
| Net Year-1 benefit | — | — | +$3.9M |
“The utilization data gave us something we never had in 15 years of portfolio reviews: a defensible number. We stopped arguing about whether to cut and started arguing about how much.”
— Director of Facilities, 1,400-person professional services firm
How OxMaint powers data-driven office footprint reduction
OxMaint is an AI-powered CMMS and EAM platform built for the teams who have to execute the consolidation — not just model it. From asset migration to preventive maintenance scheduling on a leaner footprint, OxMaint turns utilization insights into operational savings and keeps the remaining workplace running flawlessly.
Asset tracking across consolidation
Every HVAC unit, generator, kitchen asset and piece of building equipment is tracked with full location history. When floors decommission, OxMaint flags which assets to retire, relocate or sell — preventing phantom maintenance on equipment that no longer exists. Outcome: eliminate 100% of preventive maintenance on decommissioned assets.
Preventive maintenance on a leaner footprint
As the portfolio shrinks, OxMaint automatically recalculates PM schedules to the active asset base — no more redundant work orders for vacant floors. Maintenance teams focus only on occupied, revenue-supporting space. Outcome: 25–35% reduction in PM labor hours within 90 days of consolidation.
Predictive maintenance analytics
OxMaint's AI engine analyzes asset sensor data to predict failures before they happen — critical on a consolidated footprint where every remaining system carries more load. Outcome: 30–50% reduction in unplanned downtime and extended asset life for the equipment now serving denser occupancy.
Audit-ready maintenance records
Every work order, inspection and asset migration is logged with timestamps, technician IDs and cost codes. When leadership asks “prove the savings are real,” OxMaint exports a complete audit trail tying maintenance spend to the consolidated footprint. Outcome: zero-day audit readiness for ISO 55000 and internal governance reviews.
See OxMaint on your portfolio — book a 30-minute demo
Walk through how OxMaint tracks every building asset, auto-recalculates preventive maintenance as you consolidate, and gives you the audit trail your CFO needs to defend the savings.
Right-sizing the office portfolio: what teams ask most
What is office portfolio right-sizing in a hybrid work model?
Office portfolio right-sizing is the data-driven process of reducing leased or owned workspace to match actual hybrid occupancy demand. In a hybrid model — where employees use the office 2–3 days per week — peak utilization typically runs 40–60%, meaning 30–50% of the portfolio is funded but unused. Right-sizing uses badge, Wi-Fi and sensor data to identify that surplus and consolidate the footprint, recovering millions in annual occupancy and maintenance cost without harming the workplace experience.
How do you measure office space utilization for right-sizing decisions?
Measure utilization by fusing three data streams: badge/access tap-ins for baseline occupancy, Wi-Fi endpoint density for inter-floor migration and dwell time, and desk/room sensors plus booking data for phantom-reservation detection. The core formula — peak daily occupants divided by provisioned capacity — produces a utilization rate for every floor and building. Triangulating all three streams achieves ±3% accuracy. You can connect those data sources to a platform like OxMaint — Start Free Trial to see the analytics live.
How much office space can a company typically reduce in a hybrid model?
Most organizations can defensibly reduce their office footprint by 20–35% after a utilization study, with some aggressive consolidations reaching 40%. The exact number depends on peak utilization, lease break economics, team adjacency requirements and future growth projections. A 1.2M-sq-ft portfolio running at 38% peak utilization, for example, can typically shed 28% of its space while still maintaining a 1.4× peak-day buffer against overcrowding.
What are the biggest risks of office downsizing without utilization data?
The biggest risks are over-consolidation (creating overcrowding that drives attrition), under-consolidation (leaving savings on the table), and breaking team adjacencies that collaboration depends on. Without fused utilization data, teams also risk cutting floors where maintenance costs are disproportionately high — stranding expensive building systems on vacant floors. A data-driven approach with 90+ days of baseline measurement eliminates gut-feel cuts and produces a plan the board can underwrite.
How does a CMMS support office portfolio consolidation?
A CMMS like OxMaint supports consolidation by tracking every building asset through the migration — flagging equipment to retire, relocate or sell, and automatically recalculating preventive maintenance schedules to the active footprint. Without it, teams keep running PM work orders on decommissioned floors, wasting 25–35% of maintenance labor hours. OxMaint also provides the audit trail leadership needs to prove the savings are real. Book a walkthrough at calendly.com/oxmaintapp/30min.
Stop paying to maintain empty space
Put OxMaint's AI-powered asset tracking and maintenance analytics behind your portfolio right-sizing. See how much you save when every work order, PM schedule and spare part is tied to active, occupied space — not ghost floors.
Free 14-day trial · No credit card