Emergency work orders are the most expensive work your maintenance team does — and the most avoidable. Emergency repairs cost 3 to 5 times more than planned interventions when you account for overtime labour premiums, expedited parts at 200–400% markup, unplanned production downtime, and the secondary damage that accumulates between detection and response. The facilities that have cut emergency work orders by 50% or more did not do it with better technicians or bigger budgets. They did it by changing what work was visible before it became urgent. Sign in to OxMaint to build the PM programme that shifts your maintenance workload from reactive firefighting to planned execution — or book a demo to see how OxMaint structures PM scheduling, asset prioritisation, and emergency work order tracking for your facility.
The Numbers Behind the Problem
What Reactive Maintenance Actually Costs — In Data
3–5×
Higher cost of emergency repairs vs. planned maintenance — overtime, expedited parts, secondary damage
$260K
Average cost of one hour of unplanned equipment downtime across industries — Aberdeen Group
25 hrs
Average monthly unplanned downtime per facility — time that structured PM converts into planned production
85%
Reduction in emergency repairs achievable with a comprehensive PM programme — sustained over 12 months
Reactive vs. Planned
What Changes When You Shift from Reactive to Planned Maintenance
Equipment fails without warning — the first sign is production stopping
Parts ordered at emergency pricing with overnight freight — 200–400% premium over standard
Technicians pulled from planned jobs at overtime rates to respond to breakdowns
Secondary damage from running degraded equipment accumulates before failure is visible
Maintenance budget consumed by unpredictable emergency costs — planning is impossible
Asset lifespan reduced 35–50% through neglect and delayed intervention — replacement cycles accelerate
60–70%
Of maintenance budget consumed by reactive repairs in facilities without structured PM
Inspections detect degradation weeks before failure — work is scheduled at the next planned window
Parts pre-ordered at standard pricing, reserved in stores before the job is scheduled
Technician time scheduled at regular rates — no overtime premium, no production stoppage response
Intervention before degradation causes secondary damage — repair scope is contained and predictable
Maintenance budget is predictable — planned spend replaces emergency spend with 3–5× better value
Asset lifespan extended 40–60% through consistent care — capital replacement cycles extend significantly
$1 spent on PM
Returns an average of $5 in avoided emergency repair and downtime costs
The Work Orders That Are Killing Your Budget Are Already Visible — If You Know Where to Look.
OxMaint converts inspection findings into planned work orders before they become emergency calls — with PM scheduling, asset prioritisation, and work order ratio tracking built in from day one.
Root Causes
Why Emergency Work Orders Persist Even in Teams That Run PM Programmes
Most facilities that still generate high volumes of emergency work orders are not failing to run preventive maintenance. They are running PM on the wrong assets, at the wrong intervals, with incomplete records that make trend analysis impossible. Fixing the emergency work order rate requires diagnosing which of the following root causes is driving it — not just adding more PM tasks to the schedule. Sign in to OxMaint to see your current emergency-to-planned work order ratio and identify which assets are driving the emergency load.
01
No Asset Criticality Classification
PM resources are distributed uniformly across all assets. High-criticality equipment that causes $50,000 per downtime hour gets the same PM frequency as a non-critical utility asset. Criticality-weighted PM scheduling targets the resources where failure consequences are highest.
02
Incorrect PM Intervals
PM intervals set from OEM recommendations — fixed calendar intervals that do not reflect actual duty cycles, operating conditions, or historical failure patterns. Assets running in harsh environments fail faster than calendar intervals predict. Intervals must be calibrated from actual failure history, not manufacturer defaults.
03
PM Tasks Not Connected to Failure Modes
PM checklists are generic — lubricating, cleaning, and visual checking without identifying the specific failure modes the task is designed to detect. A PM task that does not target a specific failure mode cannot reliably prevent it. Each PM task should trace back to a failure mode on a specific component of the specific asset being serviced.
04
No Inspection Finding Escalation
PM inspections identify degradation but the finding is written in a paper log rather than generating a corrective work order. The degraded condition continues until it becomes an emergency. In OxMaint, any inspection finding above a configured severity threshold automatically generates a corrective work order — closing the gap between detection and action.
Sign in to activate finding-to-work-order escalation.
05
PM Compliance Below 80%
A PM programme with 60% completion rate is not a PM programme — it is a partially reactive programme with scheduled intentions. PM compliance below 80% means the programme is too ambitious for the available workforce. The correct response is to reduce PM scope to the highest-criticality assets and execute at 90%+ compliance rather than covering all assets at 60%.
06
No Failure Data Feedback Loop
Emergency work orders are closed without root cause capture. The same failure mode recurs on the same asset every 6–8 months. Without failure data captured at work order close and analysed for patterns, the PM programme cannot learn from what it is missing.
Book a demo to see failure pattern analysis in OxMaint.
Measurement Framework
How to Measure Your Emergency Work Order Problem — Before and After
Reducing emergency work orders requires establishing a baseline first. The three metrics below determine your starting point and track improvement over time. Measure them monthly and compare against the 12-week moving average — single-month variation is noise; trends are signal. Sign in to OxMaint to see these metrics calculated automatically from your work order history.
PMR
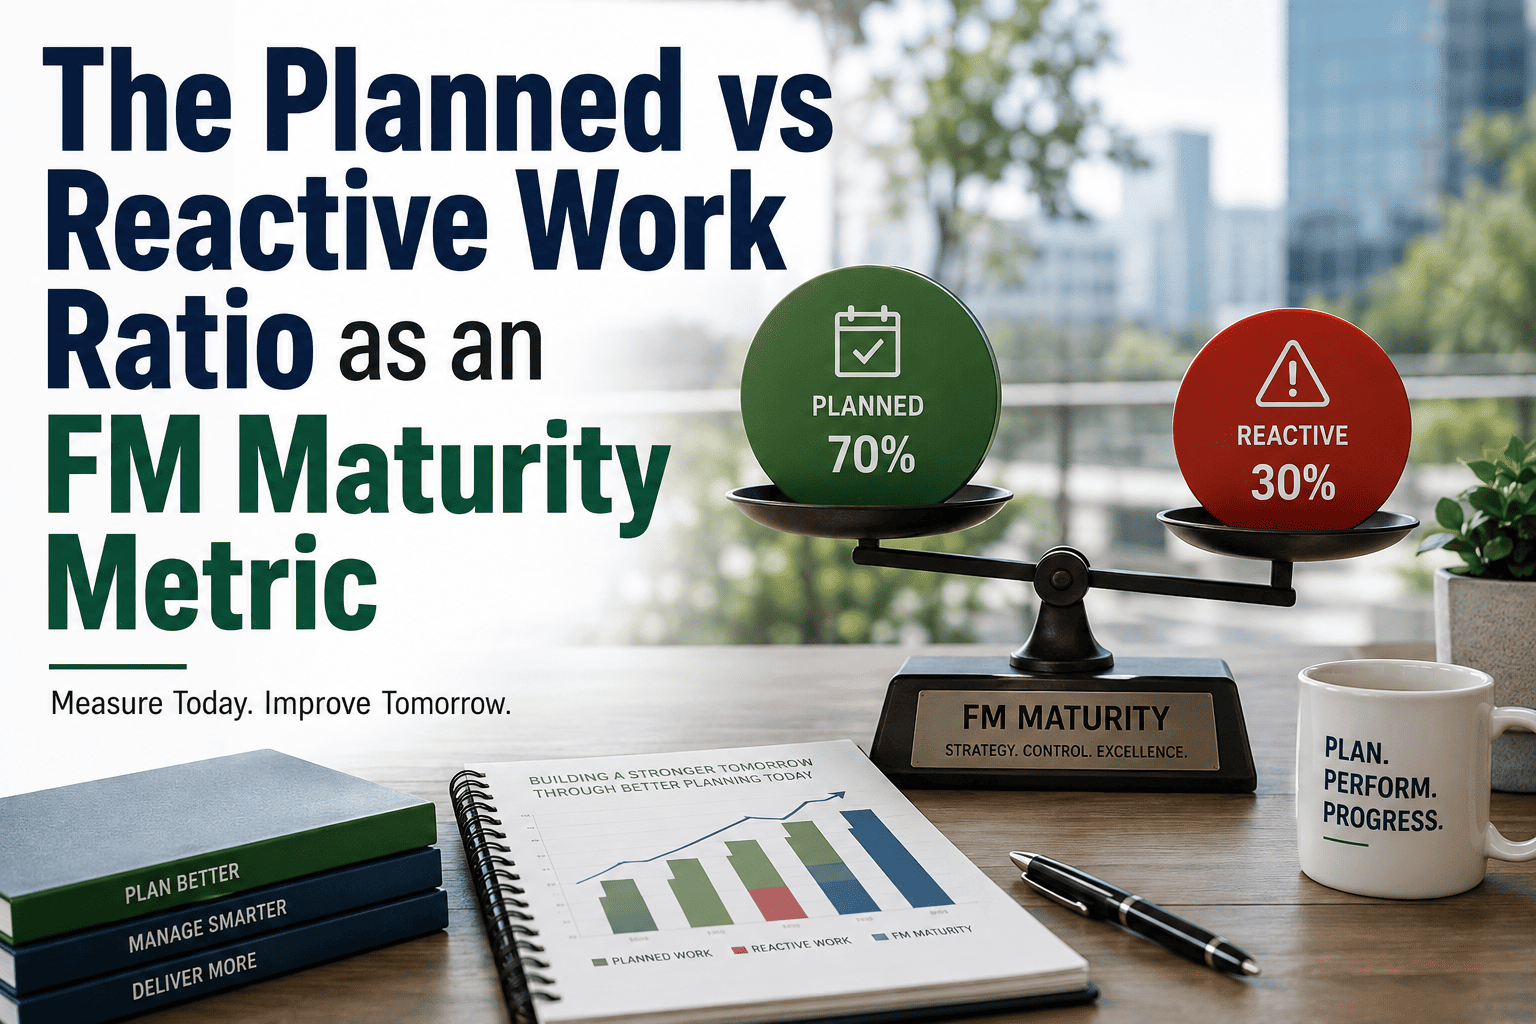
Planned Maintenance Ratio
Planned WOs ÷ Total WOs × 100
World class:
>85% planned
Good:
70–85% planned
Reactive:
<70% planned
This is the primary metric. Most reactive facilities start at 40–55% planned. Crossing 70% within 12 months of structured PM implementation is achievable in most facilities.
EWR
Emergency Work Order Rate
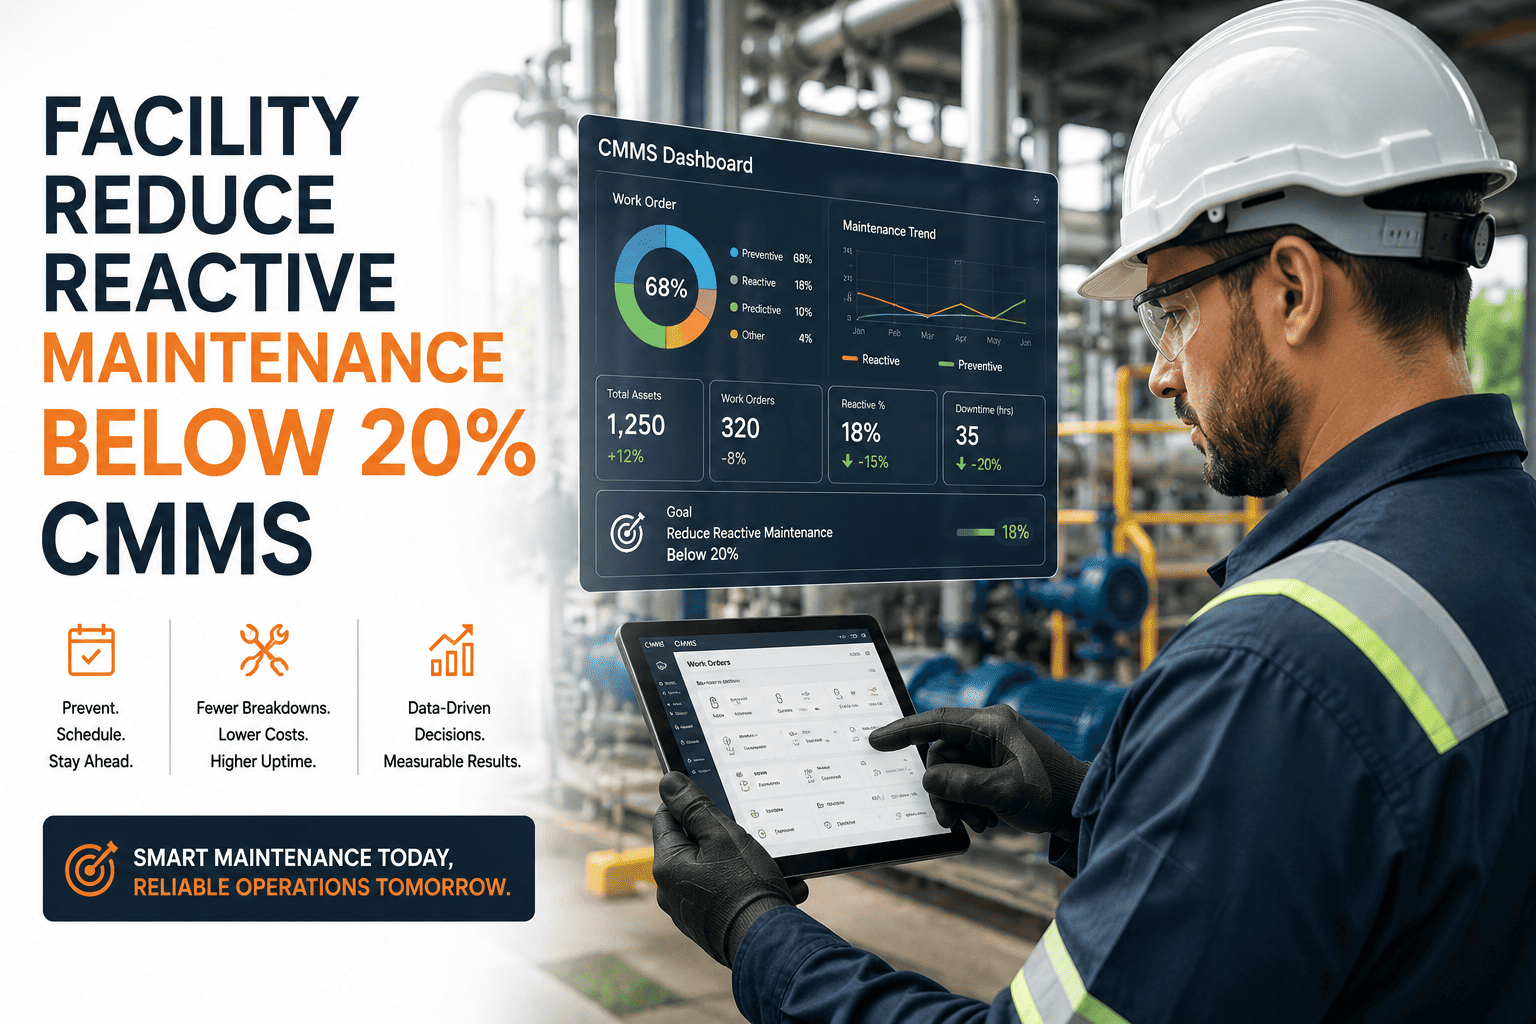
Emergency WOs ÷ Total WOs × 100
World class:
<10% emergency
Good:
10–20% emergency
Problem:
>20% emergency
Track per asset class, not facility-wide only. A 10% emergency rate facility-wide may mask a 40% emergency rate on critical rotating equipment — the actual problem location.
PM WOs completed on time ÷ PM WOs scheduled × 100
Target:
>90% on time
Acceptable:
80–90% on time
Problematic:
<80% on time
PM completion is the most commonly tracked maintenance KPI — used by 56% of facilities. If compliance is below 80%, reduce PM scope before expanding it. Execute fewer tasks at higher compliance rather than more tasks at lower compliance.
Know Your Ratio Before You Can Change It.
OxMaint calculates your Planned Maintenance Ratio, Emergency Work Order Rate, and PM Compliance automatically from existing work order data — giving you the baseline to measure every improvement from.
Implementation Path
Six Steps to Cut Emergency Work Orders by 50% — in 12 Months
1
Classify Asset Criticality
Score every asset by failure consequence — production impact, safety risk, and replacement cost. Assign Tier 1 (critical), Tier 2 (important), and Tier 3 (non-critical) classifications. Apply maximum PM frequency to Tier 1 assets only. Do not increase PM frequency across all assets — you will only reduce compliance further. In OxMaint, criticality classification drives PM interval configuration automatically.
Sign in to configure asset criticality tiers.
2
Identify Your Top 10 Emergency Work Order Sources
Pull the last 12 months of emergency work orders and rank assets by emergency work order count. The top 10 assets are generating the majority of your emergency load — and each one has a preventable failure mode. For each asset, identify the failure mode that triggered the emergency and build a PM task specifically designed to detect that failure 4–8 weeks before it recurs.
Book a demo to see emergency work order source analysis in OxMaint.
3
Set Intervals from Failure History, Not OEM Defaults
For each top-10 emergency asset, calculate mean time between failures (MTBF) from your work order history. Set the PM interval at 50–70% of MTBF for Tier 1 assets — this creates a detection window before failure that eliminates the emergency scenario. OEM-recommended intervals are conservative averages; your actual failure pattern may be faster or slower depending on your duty cycle and environment. OxMaint calculates MTBF per asset automatically from work order history.
4
Connect PM Inspections to Corrective Work Orders
Every PM inspection must have a defined escalation path. Configure OxMaint so that any finding above a minimum severity level automatically generates a corrective work order linked to the inspection record. This converts detected degradation into a planned repair before it becomes an emergency. Without this connection, PM inspections identify problems that remain unaddressed until failure.
Sign in to activate finding escalation workflows.
5
Target 90%+ PM Compliance on Tier 1 Assets
PM compliance below 80% on critical assets means the programme is providing less protection than it appears to. If PM completion is falling below target, reduce the number of tasks per PM to a manageable set and execute them completely. A 5-task PM completed at 100% compliance outperforms a 15-task PM completed at 50%. OxMaint tracks PM compliance per asset class and surfaces which Tier 1 assets are falling behind before the missed PM causes an emergency.
Book a demo to see PM compliance dashboards.
6
Track and Review Monthly — Adjust Intervals Based on Results
Review Planned Maintenance Ratio, Emergency Work Order Rate, and PM Compliance monthly. For assets that continue generating emergency work orders despite PM compliance above 80%, the interval is too long — shorten it. For assets with zero failures over 18 months, the interval may be too frequent — extend it. The PM programme improves continuously from the data it generates.
Sign in to see your monthly maintenance KPI dashboard in OxMaint.
What Maintenance Managers Say After Making the Shift
"
Our emergency work order rate was 38% when we started tracking it — we thought our maintenance was fine because the equipment was running. Once we had the data, it was obvious we were in a reactive death spiral. Emergency repairs were consuming 65% of our maintenance budget. We had two people essentially on full-time call response. When we implemented OxMaint and built criticality-weighted PM schedules for our top 20 assets, we saw the emergency rate drop to 22% within 6 months and to 14% by the end of the year. The 14% that remains is genuinely unpredictable — infant failure, operator damage, acts of God. Everything else is now planned. The budget savings allowed us to hire a third technician, which improved our PM compliance further and the improvement has compounded from there.
OxMaint Capabilities
What OxMaint Delivers for Emergency Work Order Reduction
Scheduling
Criticality-Weighted PM Scheduling
PM intervals configured per asset criticality tier — Tier 1 critical assets at maximum frequency, Tier 3 non-critical at lean intervals. PM work orders generated automatically at configured intervals with asset-specific task lists. Overdue PM alerts before the window closes.
Sign in to configure PM schedules by asset tier.
Analytics
Emergency vs. Planned Work Order Dashboard
Real-time Planned Maintenance Ratio, Emergency Work Order Rate, and PM Compliance calculated from live work order data. Per-asset and per-asset-class breakdown shows exactly where emergency work orders originate. Monthly trend lines reveal whether the programme is improving or stagnating.
Book a demo to see the KPI dashboard configured for your facility.
Escalation
Inspection Finding to Corrective Work Order
PM inspection findings above configured severity thresholds auto-generate corrective work orders linked to the inspection record. Detected degradation converts to planned work before it becomes an emergency call. The chain from inspection to corrective action is traceable and documented.
History
MTBF Calculation per Asset
Mean time between failures calculated automatically per asset from work order history — giving maintenance planners the data to set PM intervals from actual failure patterns rather than OEM defaults. MTBF trend visible per asset over any rolling period.
Sign in to see MTBF calculated for your asset fleet.
Compliance
PM Compliance Tracking and Alerts
PM completion rate tracked per asset, per asset class, and per technician. Overdue PM work orders surface automatically in the maintenance dashboard with days-overdue count. Compliance trend line shows whether the programme is maintaining or declining over time.
Failure
Root Cause Capture at Work Order Close
Emergency work orders require root cause capture at close — failure mode, contributing factor, and detection point. Over time this data populates the failure pattern analysis that identifies which PM tasks are catching failures and which failure modes are still not being detected.
Book a demo to see failure pattern analysis in OxMaint.
The Emergency Work Orders You Are Running This Week Were Visible Last Month — If You Had Been Looking.
OxMaint builds the PM programme, tracks the metrics, and escalates inspection findings into planned work orders — so the next breakdown becomes a scheduled repair instead. Free trial. No implementation fees. PM schedules active in days.
Common Questions
Maintenance Managers Ask These About Reducing Emergency Work Orders
What planned maintenance ratio should I target to have a healthy maintenance programme?
World-class maintenance operations target above 85% planned work orders. Crossing 70% within the first 12 months of a structured PM programme is achievable for most facilities starting from a reactive baseline. Below 70% indicates the programme is still predominantly reactive — emergency spend will remain disproportionate to planned spend.
Sign in to see your current planned maintenance ratio calculated from existing work order data in OxMaint.
How long does it typically take to see emergency work order volume drop after implementing structured PM?
The first measurable reduction typically appears at 60–90 days — once the highest-criticality assets have completed their first PM cycle and early-stage findings have been converted to corrective work orders. The largest reduction occurs between months 6 and 12, as the feedback loop from PM findings to corrective actions to interval adjustment matures. A 50% reduction in emergency work order rate within 12 months is achievable for most facilities.
Book a demo to model the expected timeline for your asset profile.
Can OxMaint identify which specific assets are generating the most emergency work orders?
Yes. OxMaint's work order analytics surfaces emergency work order frequency per asset, per asset class, and per location — with trend lines showing whether the rate is improving or increasing. This identifies the top emergency sources that should be the first priority for PM interval adjustment and inspection task review.
Sign in to see your emergency work order source analysis.
What PM compliance rate is required to actually reduce emergency work orders?
PM compliance above 80% on Tier 1 critical assets is the threshold below which emergency rates typically do not improve. A programme with 60% compliance is providing intermittent protection — not systematic prevention. If compliance is below 80%, reduce PM scope to the most critical tasks and execute them completely before expanding.
Book a demo to see how OxMaint tracks and alerts on PM compliance by asset tier.
Does OxMaint automatically suggest PM interval adjustments based on failure patterns?
OxMaint calculates MTBF per asset from work order history and presents this alongside the current configured PM interval — making the comparison visible so maintenance planners can identify where intervals are mismatched with actual failure patterns. Interval adjustment recommendations are supported by the data but remain a planning decision made by the maintenance team.
Sign in to see MTBF vs. PM interval comparison for your asset fleet.