Most facility directors track work order completion rates and call it performance management — then wonder why emergency repairs consume 45% of their maintenance budget. A mid-rise commercial building in Dallas discovered that switching from reactive metrics to predictive KPIs cut unplanned breakdowns by 58% within six months. The difference was not more maintenance — it was measuring the right things. Facilities using Oxmaint CMMS — Sign Up Free to automate KPI tracking report 3x faster identification of declining asset health and 40% fewer emergency work orders annually.
Building Maintenance KPIs Every Facility Director Must Track
Move beyond reactive metrics. Track the indicators that predict equipment failures, control costs, and prove maintenance ROI to executive leadership.
Why Most Facility Teams Track the Wrong Maintenance Metrics
Completion rate alone tells you work gets done — not whether it prevents failures. Facilities that rely solely on reactive metrics like work orders closed per week miss the upstream signals: rising mean-time-between-failures, creeping energy consumption on aging HVAC units, and PM schedule adherence falling below 90%. A structured CMMS dashboard — Book a Demo surfaces these leading indicators before they become emergency line items.
Essential KPI Categories for Building Maintenance
Effective maintenance measurement spans five interconnected domains. Tracking only one category creates blind spots — facilities that monitor all five through an integrated Oxmaint platform — Sign Up Free gain a complete operational picture that drives both daily decisions and long-term capital planning.
MTBF, MTTR, OEE, asset uptime percentage, failure frequency by asset class
Backlog ratio, completion rate, response time, planned vs. unplanned ratio
Maintenance cost per sq ft, cost per asset, labor-to-material ratio, budget variance
PM schedule adherence, inspection pass rates, regulatory audit readiness score
Energy use intensity, HVAC efficiency index, utility cost per occupied hour
Asset Performance KPIs
Asset performance metrics tell you whether your equipment is getting healthier or trending toward failure. Facility directors who track these indicators through automated CMMS dashboards — Sign Up Free catch degradation patterns 3–6 weeks before critical failure events.
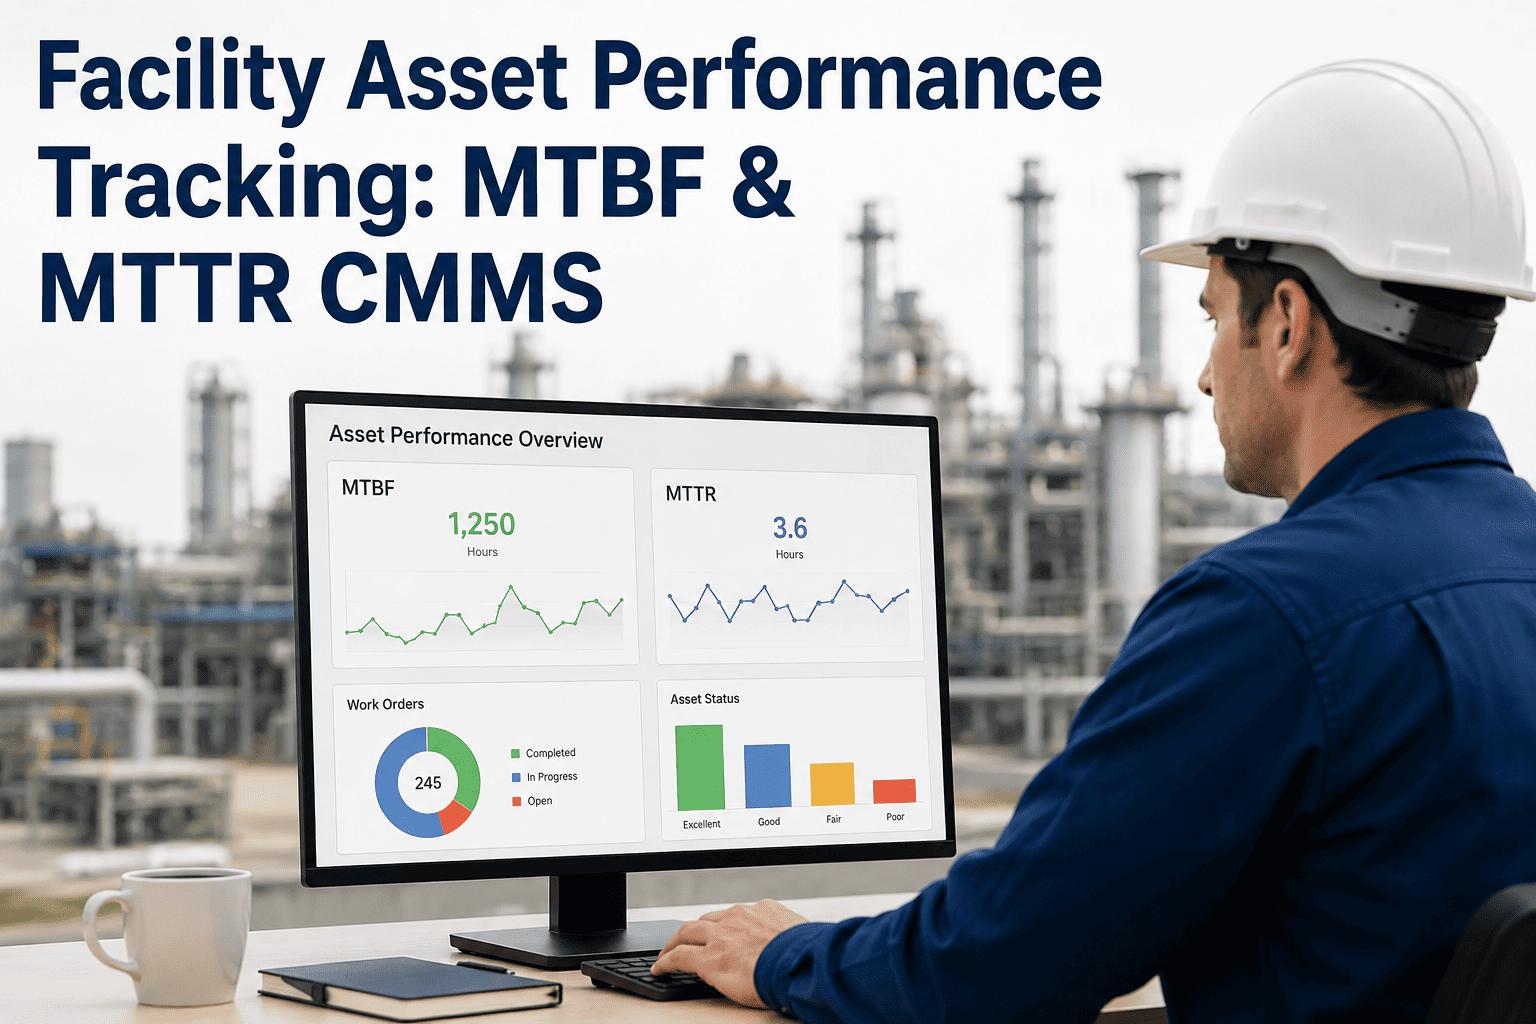
Measures average operating time between breakdowns for each asset. An MTBF declining over three consecutive periods signals the asset is entering wear-out phase. Target benchmark: HVAC chillers above 2,200 hours, elevators above 4,500 hours, generators above 1,800 hours.
Tracks average hours from failure report to full restoration. Rising MTTR often indicates parts availability issues, skill gaps on the maintenance team, or inadequate troubleshooting documentation. Target: under 4 hours for critical systems, under 24 hours for non-critical.
The ratio of operational hours to total scheduled hours per asset. Critical building systems — elevators, fire suppression, HVAC — should maintain 98%+ uptime. Tracking this KPI monthly per asset class in your CMMS — Book a Demo creates the data foundation for capital replacement planning.
Work Order Efficiency KPIs
Work order metrics reveal how effectively your team converts maintenance requests into completed tasks. These KPIs separate high-functioning teams from those drowning in backlogs and reactive firefighting.
The ratio of planned work orders to total work orders executed. World-class facilities maintain PMP above 80%. Every 10% increase in PMP correlates with 15% lower total maintenance cost because planned work uses 40% less labor than emergency repairs.
Total open work order hours divided by available weekly labor hours. A healthy backlog sits between 2–4 weeks. Below 2 weeks means overstaffing; above 6 weeks means critical tasks are being deferred. CMMS platforms like Oxmaint — Sign Up Free auto-calculate backlog in real time.
Percentage of work orders resolved on the first technician visit without requiring a return trip. Benchmark target: 85%+. Low first-time fix rates indicate insufficient diagnostic information on work orders, missing parts, or technicians dispatched without proper skill matching.
Cost Control KPIs
Financial KPIs translate maintenance activity into the language executives understand — budget adherence, cost per unit, and return on investment. Tracking these alongside operational metrics builds the business case for maintenance investment.
Total annual maintenance spend divided by gross building area. BOMA benchmarks range from $2.50–$4.50/sq ft for Class A office buildings. Facilities exceeding their class benchmark by 20%+ should audit asset condition, contractor rates, and PM program effectiveness through a CMMS cost analysis — Book a Demo.
Measures actual spend versus approved budget on a monthly and quarterly basis. Consistent negative variance above 5% indicates either poor estimation, scope creep on work orders, or hidden reactive maintenance costs. CMMS-automated cost tracking eliminates the manual reconciliation that delays variance detection.
Stop Managing Maintenance by Gut Feel
Oxmaint CMMS auto-calculates every KPI on this page from your live work order data — no spreadsheets, no manual formulas, no month-end scramble to build reports for leadership.
Compliance and Safety KPIs
Regulatory compliance metrics protect your facility from fines, liability, and insurance premium increases. These KPIs demonstrate due diligence to OSHA inspectors, fire marshals, and insurance auditors.
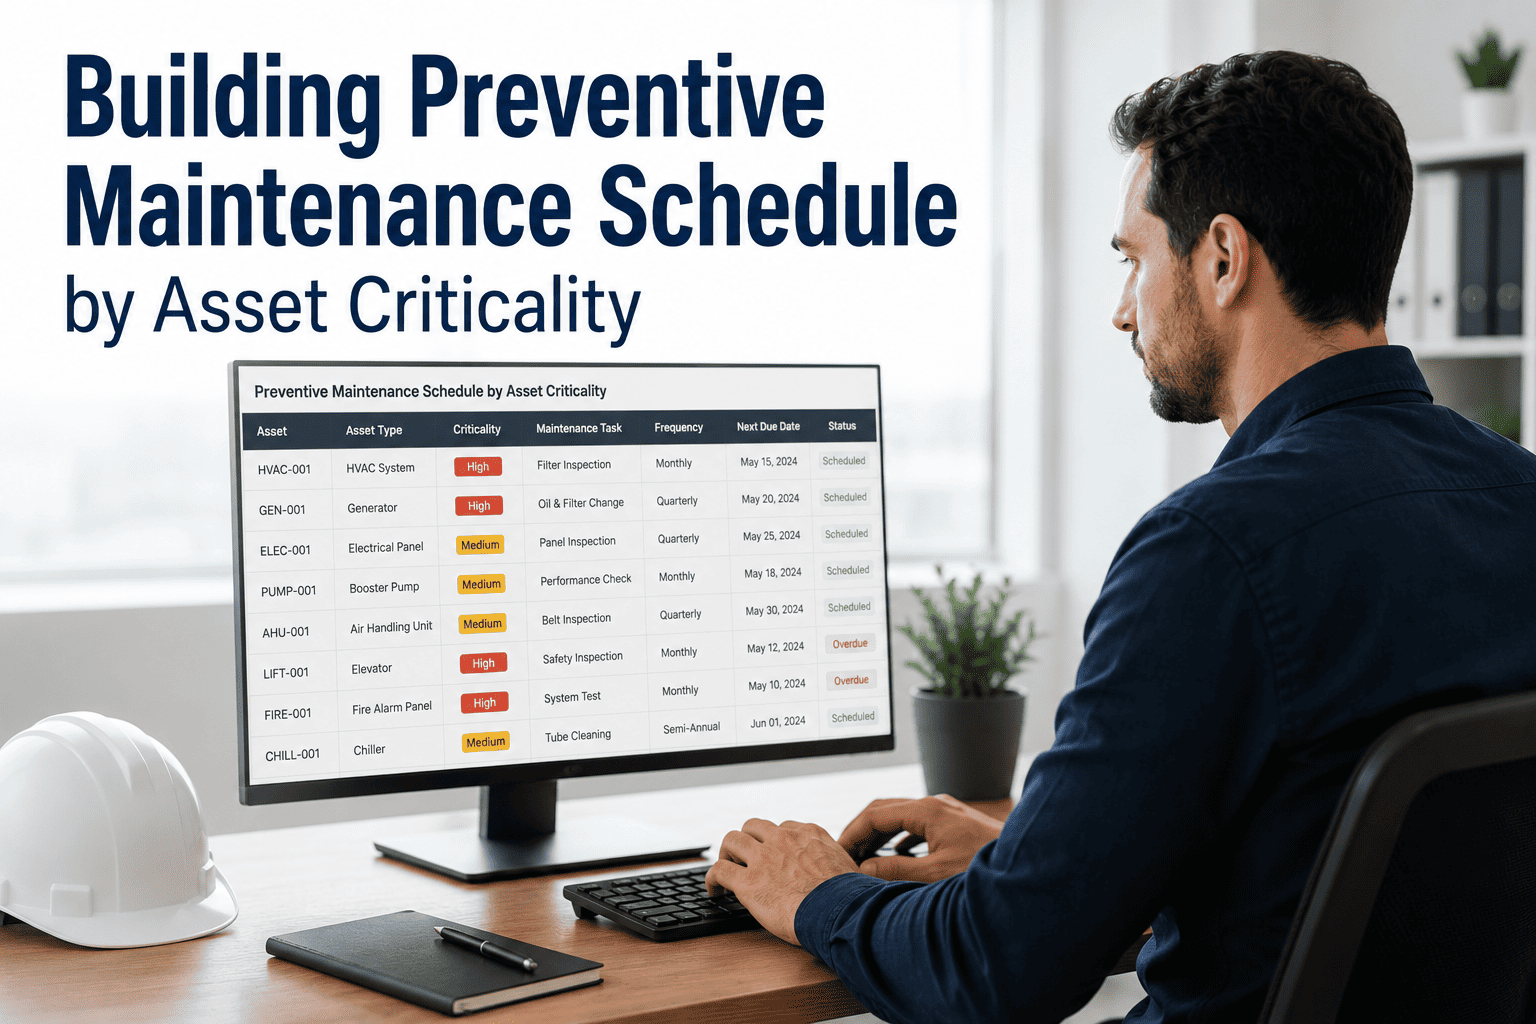
Percentage of scheduled preventive maintenance tasks completed within their due window. Target: 95%+. Facilities tracking this KPI through Oxmaint — Sign Up Free get automated alerts 72 hours before due dates and escalation notifications for overdue tasks. OSHA and NFPA auditors specifically request PM adherence documentation.
Number of recordable safety incidents per 200,000 maintenance labor hours. Track near-misses alongside actual incidents — a rising near-miss count is a leading indicator. Facilities with CMMS-integrated safety reporting reduce incident rates by 30% within the first year through better hazard visibility.
Energy and Sustainability KPIs
Energy metrics connect maintenance quality to operating cost and ESG reporting. Poorly maintained HVAC systems consume 15–25% more energy than properly serviced equipment — tracking these KPIs turns maintenance from a cost line into a sustainability asset.
Total energy consumption per square foot per year. Tracking EUI alongside maintenance activity in a unified CMMS dashboard — Book a Demo reveals which maintenance gaps drive energy waste. A 2°F drift in chiller setpoint calibration can increase energy costs by 8% annually.
Compares actual HVAC energy consumption against the manufacturer's rated efficiency at current load conditions. A declining efficiency index triggers filter inspections, coil cleaning, refrigerant level checks, and economizer calibration — all scheduled as automated PM tasks through your CMMS.
Spreadsheets vs. CMMS-Automated KPI Tracking
Most facilities start with spreadsheet-based KPI tracking. It works for the first month — then data entry falls behind, formulas break, and the dashboard becomes a quarterly scramble instead of a daily management tool.
How Oxmaint Powers Your KPI Dashboard
Oxmaint CMMS connects work order management, asset tracking, inventory control, and compliance scheduling into a single platform that auto-generates every KPI facility directors need.
Pre-built maintenance KPI views covering asset performance, work order efficiency, cost tracking, and compliance adherence — no configuration required at setup.
Set custom warning and critical thresholds for each KPI. Receive push notifications, email alerts, or SMS when metrics cross boundaries — before problems escalate.
Runtime-based and calendar-based preventive maintenance triggers with automatic work order generation, technician assignment, and parts reservation.
Generates audit-ready reports for OSHA, NFPA, and insurance inspectors with timestamped PM completion records, safety checklists, and corrective action logs.
We went from spending two days assembling monthly maintenance reports to having a live dashboard that leadership checks daily. The shift from reactive to data-driven maintenance saved us $380K in avoided emergency repairs in the first year.
— Director of Facilities, 1.2M sq ft commercial portfolio
Start Tracking the KPIs That Actually Prevent Failures
Every day without automated KPI tracking is another day of invisible asset degradation, budget leakage, and compliance risk. Oxmaint CMMS deploys in under a week and starts delivering actionable maintenance intelligence from day one.
Frequently Asked Questions
Track 8–12 core KPIs across asset performance, work order efficiency, cost control, compliance, and energy. Fewer than 8 leaves blind spots; more than 15 creates noise. Oxmaint's pre-built dashboards — Sign Up Free include the essential metrics with customization for your facility type.
Best-in-class facilities maintain 80%+ planned work. Most commercial buildings start at 40–50% when transitioning from reactive maintenance. Reaching 80% typically takes 6–12 months of structured PM program development with CMMS support.
Divide total annual maintenance expenditure — including labor, materials, contractor costs, and equipment — by gross building area. Compare against BOMA benchmarks for your building class. Schedule a demo to see how Oxmaint auto-calculates this from your work order cost data.
Facilities as small as 25,000 sq ft see measurable improvement. The same KPIs apply regardless of building size — the difference is fewer assets to track. Cloud CMMS platforms eliminate the overhead that once made KPI tracking impractical for smaller operations.
Most facilities report measurable KPI improvement within 60–90 days. PM schedule adherence typically improves first, followed by backlog reduction and planned maintenance percentage increases. Cost savings from reduced emergency work become visible in the second quarter.
Yes. Oxmaint connects with major building management systems, IoT sensor networks, and energy monitoring platforms to pull real-time asset performance data into your KPI dashboards. Start your free account and explore the integration library.