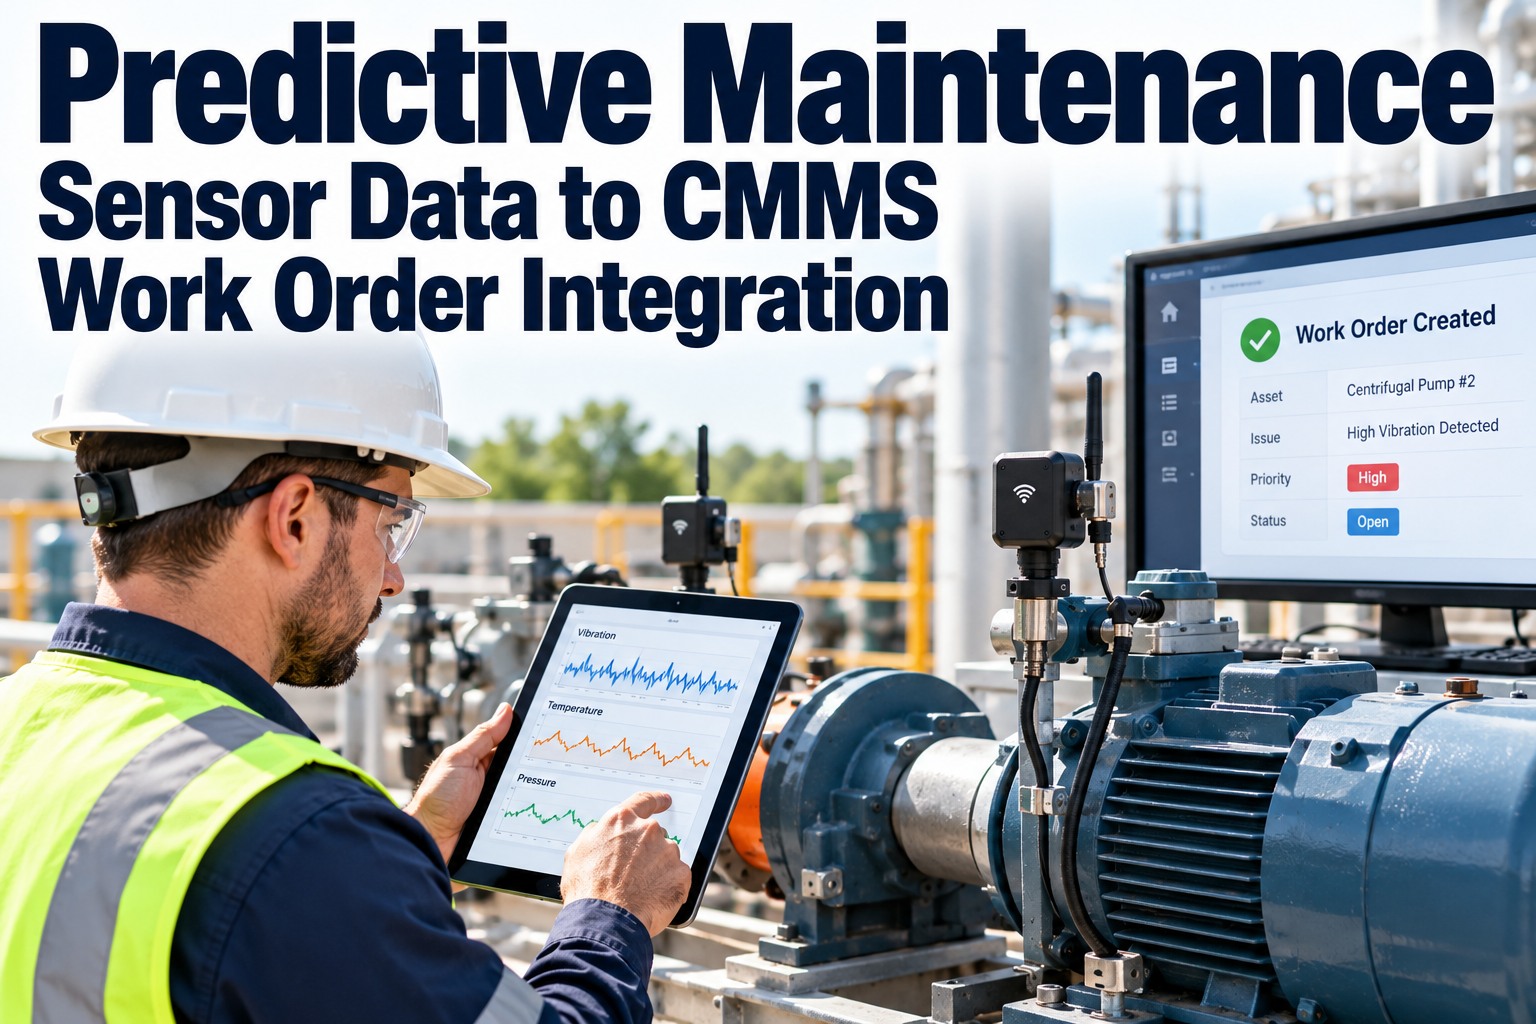
The vibration alert fired three weeks ago, landed in a condition-monitoring dashboard nobody on the floor logs into, and sat there until the bearing let go on a Tuesday and took the line with it. Detection was never the problem — the handoff is, because a predictive alert is a countdown, and the whole P-F interval burns while someone waits to notice the dashboard and open a work order by hand. This page shows how predictive sensor data connects straight to a work order in OXMAINT AI, the AI-powered CMMS that turns an alert into ranked, assigned action before potential failure becomes functional failure.
Predictive Maintenance · Sensor Data · CMMS Work Order Integration
A Predictive Alert Is a Countdown. A Dashboard Isn't a Response.
Your sensors already see the failure coming. OXMAINT AI is the CMMS on the other side of the alert — ingesting condition data, auto-raising a ranked work order with the asset, the fault, the severity and the reading attached, and closing the loop before the P-F interval runs out.
Condition-monitoring tools are excellent at spotting the first sign of trouble — the P point, weeks before anything breaks. Where predictive programs fall apart is the step after: turning that signal into work someone actually does. The insight lands in a dashboard or an email, and the burden of reading it and opening a work order by hand falls on one person who is already busy. If the CMMS never learns about the P point, it cannot do anything to prevent F — and every day the alert waits, the warning window shrinks. Sign up free and route condition alerts straight into OXMAINT AI.
The P-F Curve — Why the Handoff Has to Be Instant
The P-F curve is the whole argument in one picture. P is the moment a failure becomes detectable; F is the moment the asset stops doing its job. The gap between them is all the time you get to plan, order parts and schedule the fix instead of reacting at 2 a.m. The earlier your sensors catch it, the longer that window — but only if the alert becomes a work order while the window is still open.
The further left you detect, the more of the P–F interval you keep — and the integration is what stops that window being spent on a manual handoff.
The Sensors That Buy You the Most Warning
Different techniques catch a failure at different points on the curve. The earliest-warning methods are where the planning window is widest — and every one of them is only as useful as the work order it eventually triggers. Book a demo to see each sensor feed route into OXMAINT AI.
V
Vibration Analysis
ISO 20816 severity zones catch imbalance, misalignment, looseness and bearing wear weeks out — the earliest, richest signal.
U
Ultrasound & Acoustic
Hears early bearing friction, lubrication starvation, leaks and electrical arcing before heat or audible noise appear.
O
Oil Analysis
Wear metals, viscosity and contamination (ISO 4406) reveal internal wear long before it reaches the surface.
T
Infrared Thermography
Hot spots on connections, bearings and motors — later on the curve than vibration, still well ahead of failure.
M
Motor Current (MCSA)
Reads the motor's own current for rotor-bar, winding and load faults — no extra sensor on the shaft required.
P
Process Sensors
Temperature, pressure, flow and speed trended against limits — the baseline signal nearly every asset already streams.
Sensors on the asset stream vibration, temperature, current and ultrasound.
→
02
Gateway
An edge gateway collects and forwards the data over MQTT or OPC-UA.
→
03
Detect
The condition platform compares to thresholds or flags an anomaly.
→
04
Alert
A fault is raised with the asset, the type, the severity and the reading.
→
05
Integrate
The alert posts into the CMMS over an API or a webhook.
→
06
Act
A ranked work order opens — assigned, with the full context attached.
↻ The closed work order's outcome flows back to the asset record — tuning thresholds and building the reliability history.
What Rides on the Auto-Generated Work Order
The difference between a useful integration and alert noise is context. A work order that just says "check Pump 4" sends a technician out blind; one that carries the data turns the P-F interval into a planned, confident repair. Every auto-generated work order should arrive with these.
Asset & Location
Exactly which unit and where — no decoding an alert ID against a spreadsheet.
Fault Type
Bearing, imbalance, looseness — what the data actually points to, not just "anomaly".
Severity
A criticality tier that sets the work order's priority and who it routes to.
Reading & Trend
The measurement and its trajectory — the evidence, not just a red light.
Recommended Action
The prescriptive next step, so the technician starts the job already informed.
The P-F Clock
How much warning window is left — so scheduling reflects real urgency.
Why Not Every Alert Should Become a Work Order
The fastest way to kill a predictive program is to pipe every raw alert straight into the work queue. False positives pile up, technicians stop trusting the flags, and real faults get lost in the noise — the same alert fatigue that sank the dashboard, just moved into the CMMS. The integration has to be selective: severity tiers, de-duplication of repeat alerts, and an actionability gate so only real, prioritized faults ever become a work order. Book a demo to see severity-filtered alerts in OXMAINT AI.
Close the Gap Between the Alert and the Wrench.
Connect your condition-monitoring data to the CMMS that acts on it — ranked work orders from real faults, full context attached, and a closed loop that keeps the P-F interval working for you.
OXMAINT AI is the maintenance system of record on the receiving end of your sensors — it does not replace your condition-monitoring platform, it operationalizes what the platform finds. Here is what the connected CMMS does with every reading.
CONNECT IT
Ingest Condition Data
Take alerts and readings over API, webhook, MQTT or OPC-UA from your sensors and condition-monitoring platform.
RAISE IT
Alert Becomes a Work Order
A qualifying fault auto-opens a ranked work order — assigned and tracked — with no one re-keying it from a dashboard.
CONTEXT IT
The Data Rides Along
Asset, fault type, severity, reading, trend and recommended action all land on the work order with it.
FILTER IT
Severity Tiers and De-Dup
Criticality routing and duplicate suppression keep false positives out of the queue, so flags stay trusted.
TREND IT
Reliability Data Builds Itself
Which assets alert most, how often, and time between failures — reliability data assembled from every event.
CLOSE IT
Outcome Loops Back
The repair result returns to the asset's history, sharpening the next alert and the next decision.
"
We had spent well into six figures on vibration sensors and a monitoring platform, and our unplanned failures barely moved. The sensors were right almost every time — the alerts just died in a dashboard a reliability analyst checked on Fridays. The day those alerts started opening work orders with the fault and the reading already on them, the gap between knowing and doing collapsed from a week to the same shift. We didn't buy better sensors. We finally used the ones we had.
Reliability Engineer · Process Manufacturing
Frequently Asked Questions
What is the P-F curve and the P-F interval?
The P-F curve maps an asset's decline from the point a failure first becomes detectable (P) to the point it can no longer do its job (F). The P-F interval is the time between them — your window to detect, plan and act. The earlier you detect, the wider the window.
How does predictive sensor data become a CMMS work order?
Sensors stream to a condition platform that flags a fault; the alert posts into the CMMS over an API or webhook, and a ranked work order opens automatically with the asset, fault, severity and reading attached — no manual re-keying from a dashboard. Sign up free to set it up in OXMAINT AI.
Which sensors give the most warning?
Vibration analysis, ultrasound and oil analysis sit earliest on the P-F curve — often weeks of warning. Thermography comes later, and anything you can hear or feel is usually too late to plan around. The earliest signals leave the widest planning window.
Won't integrating alerts flood us with false work orders?
Only if the integration is naive. Severity tiers, de-duplication and an actionability gate mean raw noise never reaches the queue — just the real, prioritized faults. Done right, the CMMS gets fewer, better work orders, not more.
How does OXMAINT AI connect to our condition-monitoring system?
Through standard integration — API, webhook, MQTT or OPC-UA — so alerts and readings from your existing sensors and platform flow in without a custom build. OXMAINT AI runs the maintenance response; your platform keeps doing the detection.
Your Sensors See It Coming. Make Sure the Work Order Does Too.
Connect predictive sensor data to OXMAINT AI — alerts that become ranked work orders, full context on every one, severity filtering that keeps trust intact, and a closed loop that builds reliability data. Stop losing the P-F interval to a manual handoff.